Financial Comparative Analysis

Dashboard For Strategic Evaluation Of Key Business Financials Ppt Gallery Aids PDF
This slide displays dashboard to review business performance and formulate appropriate improvement strategies. It further includes kpis such as revenue comparison, top selling categories, sales by month, customer satisfaction, etc. Showcasing this set of slides titled Dashboard For Strategic Evaluation Of Key Business Financials Ppt Gallery Aids PDF. The topics addressed in these templates are Revenue Comparison, Top Selling Categories, New Customer. All the content presented in this PPT design is completely editable. Download it and make adjustments in color, background, font etc. as per your unique business setting.
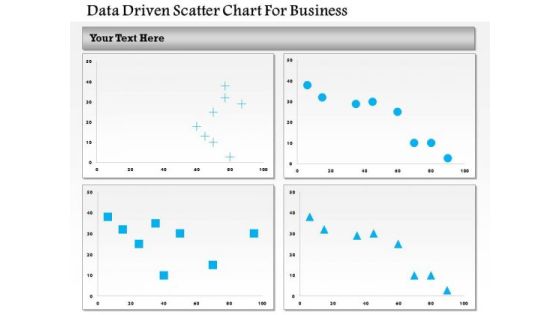
Business Diagram Data Driven Scatter Chart For Business PowerPoint Slide
This business diagram has been designed with four comparative charts. This slide suitable for data representation. You can also use this slide to present business analysis and reports. Use this diagram to present your views in a wonderful manner.

PPM Private Equity Financials Forecast Of Income Statement And Balance Sheet Numbers Ppt PowerPoint Presentation Infographic Template Example 2015 PDF
This slide shows companys Financial Comparison based on certain parameters like Revenue, EBIT, Net Cash Flows, Total Assets, Working Capital etc. from the years 2019 to 2023. Deliver an awe-inspiring pitch with this creative ppm private equity financials forecast of income statement and balance sheet numbers ppt powerpoint presentation infographic template example 2015 pdf bundle. Topics like revenue, gross profit, ebit, net cash flows, working capital, 2019 to 2023 can be discussed with this completely editable template. It is available for immediate download depending on the needs and requirements of the user.
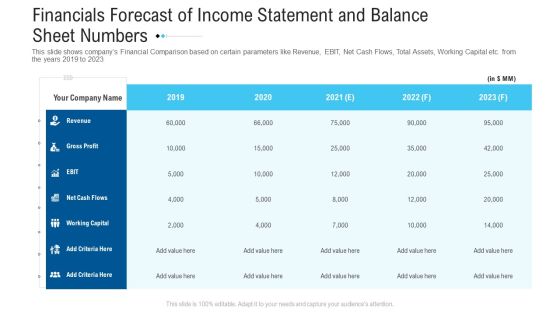
Funding Deck Raise Grant Funds Public Organizations Financials Forecast Of Income Statement And Balance Sheet Numbers Themes PDF
This slide shows companys Financial Comparison based on certain parameters like Revenue, EBIT, Net Cash Flows, Total Assets, Working Capital etc. from the years 2019 to 2023. Deliver an awe inspiring pitch with this creative funding deck raise grant funds public organizations financials forecast of income statement and balance sheet numbers themes pdf bundle. Topics like revenue, gross profit, 2019 to 2023 can be discussed with this completely editable template. It is available for immediate download depending on the needs and requirements of the user.

Business Diagram Two Tablets With Growth Bar Graph Data Driven PowerPoint Slide
This business diagram has been designed with comparative charts on tablets. This slide suitable for data representation. You can also use this slide to present business reports and information. Use this diagram to present your views in a wonderful manner.

Pitch Book Capital Funding Deal IPO Pitchbook Competitor Comparison On The Basis Of Key Financials Mockup PDF
The slide provides the companys comparisons with its competitors on the basis of key financials total revenue, net income, Assets under Management, employee count, number of IPO deals etc. Deliver an awe inspiring pitch with this creative pitch book capital funding deal ipo pitchbook competitor comparison on the basis of key financials mockup pdf bundle. Topics like net income, total revenue, employees can be discussed with this completely editable template. It is available for immediate download depending on the needs and requirements of the user.

Sell Side M And A Pitchbook With Deal Overview Competitor Comparison Based On Key Financials Formats PDF
The slide provides the companys comparisons with its competitors on the basis of key financials total revenue, net income, Assets under Management, employee count, number of sales deals etc. Are you in need of a template that can accommodate all of your creative concepts This one is crafted professionally and can be altered to fit any style. Use it with Google Slides or PowerPoint. Include striking photographs, symbols, depictions, and other visuals. Fill, move around, or remove text boxes as desired. Test out color palettes and font mixtures. Edit and save your work, or work with colleagues. Download Sell Side M And A Pitchbook With Deal Overview Competitor Comparison Based On Key Financials Formats PDF and observe how to make your presentation outstanding. Give an impeccable presentation to your group and make your presentation unforgettable.

Equity Debt And Convertible Bond Investment Banking Pitch Book Competitor Comparison Bases To Key Financials Icons PDF
The slide provides the companys comparisons with its competitors on the basis of key financials total revenue, net income, Assets under Management, employee count, number of M and A deals etc. Make sure to capture your audiences attention in your business displays with our gratis customizable Equity Debt And Convertible Bond Investment Banking Pitch Book Competitor Comparison Bases To Key Financials Icons PDF. These are great for business strategies, office conferences, capital raising or task suggestions. If you desire to acquire more customers for your tech business and ensure they stay satisfied, create your own sales presentation with these plain slides.
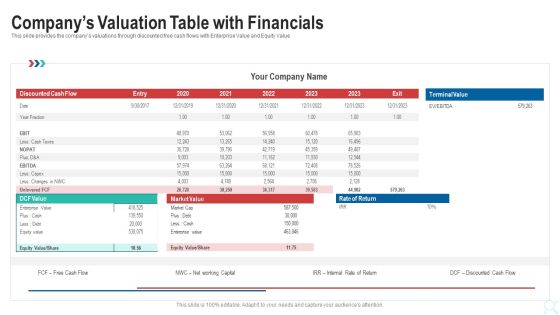
Pitch Deck To Raise New Venture Financing From Seed Investors Companys Valuation Table With Financials Graphics PDF
Deliver and pitch your topic in the best possible manner with this pitch deck to raise new venture financing from seed investors companys valuation table with financials graphics pdf. Use them to share invaluable insights on companys valuation table with financials and impress your audience. This template can be altered and modified as per your expectations. So, grab it now.

Post Initial Pubic Offering Market Pitch Deck Key Statistics Related To Companys Financials And Operations Topics PDF
The slide provides a key facts and figures related to companies financials and operations. Key facts include Revenue, Interest Income, Net Income, Total Deposits, Number of Branches etc. Deliver and pitch your topic in the best possible manner with this post initial pubic offering market pitch deck key statistics related to companys financials and operations topics pdf. Use them to share invaluable insights on revenue, interest income, net income and impress your audience. This template can be altered and modified as per your expectations. So, grab it now.

Sell Side M And A Pitchbook With Deal Overview Operational And Financials Forecast Management Vs Consensus Clipart PDF
The slide provides the operations and financials forecast of the company XYZ by the management and consensus. Key heads includes revenue, interest income, non-performing assets, total assets etc. Explore a selection of the finest Sell Side M And A Pitchbook With Deal Overview Operational And Financials Forecast Management Vs Consensus Clipart PDF here. With a plethora of professionally designed and pre made slide templates, you can quickly and easily find the right one for your upcoming presentation. You can use our Sell Side M And A Pitchbook With Deal Overview Operational And Financials Forecast Management Vs Consensus Clipart PDF to effectively convey your message to a wider audience. Slidegeeks has done a lot of research before preparing these presentation templates. The content can be personalized and the slides are highly editable. Grab templates today from Slidegeeks.

Comparison Ppt PowerPoint Presentation Infographics Layout Ideas
This is a comparison ppt powerpoint presentation infographics layout ideas. This is a two stage process. The stages in this process are female, male, finance, percentage, compare.

Comparison Ppt PowerPoint Presentation Layouts Outline
This is a comparison ppt powerpoint presentation layouts outline. This is a four stage process. The stages in this process are percentage, people, compare, finance, marketing.
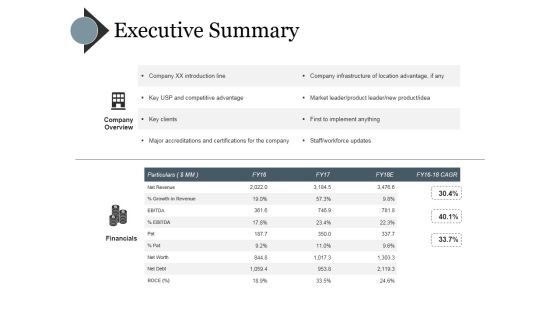
Executive Summary Ppt PowerPoint Presentation Outline Elements
This is a executive summary ppt powerpoint presentation outline elements. This is a two stage process. The stages in this process are company xx introduction line, key usp and competitive advantage, key clients, major accreditations and certifications for the company, company infrastructure of location advantage, if any.
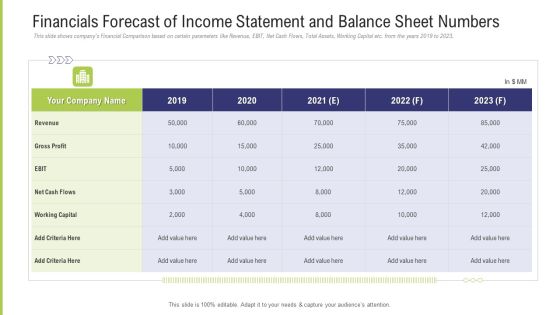
Funding Pitch Deck To Obtain Long Term Debt From Banks Financials Forecast Of Income Statement And Balance Sheet Numbers Diagrams PDF
This slide shows companys Financial Comparison based on certain parameters like Revenue, EBIT, Net Cash Flows, Total Assets, Working Capital etc. from the years 2019 to 2023. Deliver an awe inspiring pitch with this creative funding pitch deck to obtain long term debt from banks financials forecast of income statement and balance sheet numbers diagrams pdf bundle. Topics like revenue, gross profit, net cash flows, 2019 to 2023 can be discussed with this completely editable template. It is available for immediate download depending on the needs and requirements of the user.

Finance And Accounting Comparison Ppt PowerPoint Presentation Gallery
This is a finance and accounting comparison ppt powerpoint presentation gallery. This is a two stage process. The stages in this process are financial planning, accounting comparison, financial comparison.

Information Systems Security And Risk Management Plan Comparison Rules PDF
This graph chart is linked to excel, and changes automatically based on data. Just left click on it and select Edit Data. Find highly impressive Information Systems Security And Risk Management Plan Comparison Rules PDF on Slidegeeks to deliver a meaningful presentation. You can save an ample amount of time using these presentation templates. No need to worry to prepare everything from scratch because Slidegeeks experts have already done a huge research and work for you. You need to download Information Systems Security And Risk Management Plan Comparison Rules PDF for your upcoming presentation. All the presentation templates are 100 percent editable and you can change the color and personalize the content accordingly. Download now.

Comparison Ppt PowerPoint Presentation Professional Grid
This is a comparison ppt powerpoint presentation professional grid. This is a two stage process. The stages in this process are business, marketing, comparison, finance, timeline.

Comparison Ppt PowerPoint Presentation Icon Topics
This is a comparison ppt powerpoint presentation icon topics. This is a two stage process. The stages in this process are business, marketing, comparison, planning, management.

Comparison Ppt PowerPoint Presentation File Master Slide
This is a comparison ppt powerpoint presentation file master slide. This is a two stage process. The stages in this process are business, marketing, comparison, finance, management.

Digital Multi Channel Marketing Roi Strategy Clipart PDF
This slide covers online marketing channels rate on investment. The purpose of this template is to judge how well a particular marketing channel perform in comparison of others. It includes elements such as Email, SEO, direct mail and online ads Showcasing this set of slides titled Digital Multi Channel Marketing Roi Strategy Clipart PDF. The topics addressed in these templates are Return On Investment, Digital Marketing Channels, Key Takeaways. All the content presented in this PPT design is completely editable. Download it and make adjustments in color, background, font etc. as per your unique business setting.

Comparison Ppt PowerPoint Presentation Icon Information
This is a comparison ppt powerpoint presentation icon information. This is a three stage process. The stages in this process are business, marketing, comparison, finance, management.

Year Based Company Finance Growth Ppt PowerPoint Presentation Layouts
This is a year based company finance growth ppt powerpoint presentation layouts. This is a ten stage process. The stages in this process are financial result, net sales, other income, ebita, ebita margins, profit before tax, taxes, tax rate, profit after tax, pat margins.

Business Diagram Six Staged Pie Charts For Text Representation PowerPoint Slide
This slide displays graphic six staged pie charts. Download this diagram to present and compare business data. Use this diagram to display business process workflows in any presentation.

Buyer Behavior Ppt PowerPoint Presentation Images
This is a buyer behavior ppt powerpoint presentation images. This is a two stage process. The stages in this process are comparison, percentage, people, finance, business.

Comparison Ppt PowerPoint Presentation Summary Influencers
This is a comparison ppt powerpoint presentation summary influencers. This is a three stage process. The stages in this process are business, marketing, comparison, finance, management.

Budgeting Planned Actual Comparison Ppt PowerPoint Presentation Graphics
This is a budgeting planned actual comparison ppt powerpoint presentation graphics. This is a two stage process. The stages in this process are value difference, actual cost, planned cost, type of cost.
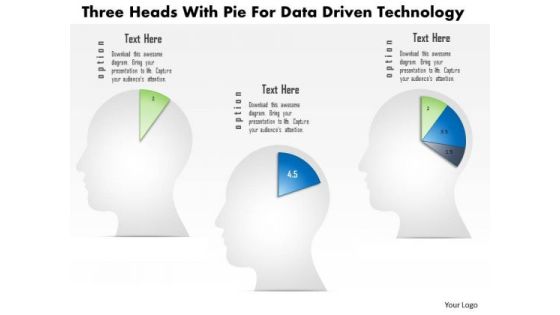
Business Diagram Three Heads With Pie For Data Driven Technology PowerPoint Slide
This business diagram displays three human faces with pie charts. This Power Point template has been designed to compare and present business data. You may use this diagram to impart professional appearance to your presentations.
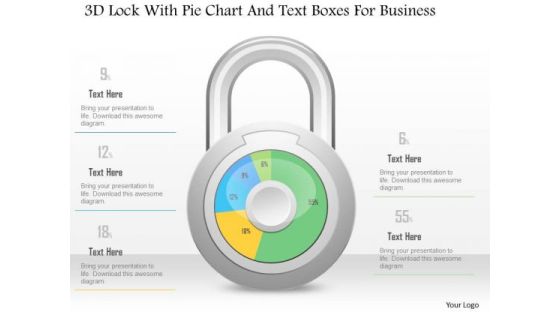
Business Diagram 3d Lock With Pie Chart And Text Boxes For Business PowerPoint Slide
This Power Point diagram has been crafted with pie chart in shape of lock. It contains diagram of lock pie chart to compare and present data in an effective manner. Use this diagram to build professional presentations for your viewers.

Business Diagram 3d Lock With Pie Graph For Result Representation PowerPoint Slide
This Power Point diagram has been crafted with pie chart in shape of lock. It contains diagram of lock pie chart to compare and present data in an effective manner. Use this diagram to build professional presentations for your viewers.
Business Diagram Human Icons With Bubbles And Different Icons Inside PowerPoint Slide
This diagram displays graph with percentage value growth. This business slide is suitable to present and compare business data. Use this diagram to build professional presentations for your viewers.

Business Diagram Three Staged Pencil Diagram For Graph Formation PowerPoint Slide
This business diagram displays set of pencils. This Power Point template has been designed to compare and present business data. Download this diagram to represent stages of business growth.

Development In Past 10 Years Template 1 Ppt PowerPoint Presentation Infographics
This is a development in past 10 years template 1 ppt powerpoint presentation infographics. This is a ten stage process. The stages in this process are net sales, other income, ebita margins, profit before tax, taxes.

Clustered Column Ppt PowerPoint Presentation Backgrounds
This is a clustered column ppt powerpoint presentation backgrounds. This is a two stage process. The stages in this process are business, marketing, finance, compare, management.

Company Cash Flow Statement Over Years Ppt PowerPoint Presentation Gallery
This is a company cash flow statement over years ppt powerpoint presentation gallery. This is ten stage process. The stages in this process are financial result, financial position, share capital, equity share data.

Comparison Ppt PowerPoint Presentation Design Ideas
This is a comparison ppt powerpoint presentation design ideas. This is a two stage process. The stages in this process are compare, finance, analysis, business, marketing.

Comparison Ppt PowerPoint Presentation Portfolio Inspiration
This is a comparison ppt powerpoint presentation portfolio inspiration. This is a two stage process. The stages in this process are business, marketing, comparison, finance, management.
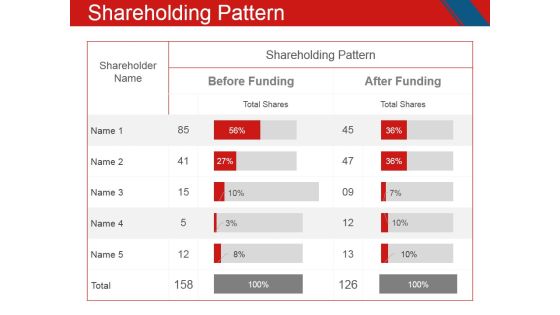
Shareholding Pattern Ppt PowerPoint Presentation Model Microsoft
This is a shareholding pattern ppt powerpoint presentation model microsoft. This is a two stage process. The stages in this process are shareholder name, shareholding pattern, before funding, after funding.

Comparison Ppt PowerPoint Presentation Guidelines
This is a comparison ppt powerpoint presentation guidelines. This is a three stage process. The stages in this process are finance, business, marketing, percentage, compare.

Comparison Ppt PowerPoint Presentation Outline
This is a comparison ppt powerpoint presentation outline. This is a two stage process. The stages in this process are business, strategy, marketing, analysis, finance, compare.

Comparison Ppt PowerPoint Presentation Gallery Infographics
This is a comparison ppt powerpoint presentation gallery infographics. This is a two stage process. The stages in this process are business, strategy, analysis, planning, finance, compare.

Comparison Ppt PowerPoint Presentation Summary Slideshow
This is a comparison ppt powerpoint presentation summary slideshow. This is a two stage process. The stages in this process are north america, africa, compare, finance, analysis.

Last 90 Days Results Ppt PowerPoint Presentation Introduction
This is a last 90 days results ppt powerpoint presentation introduction. This is a six stage process. The stages in this process are revenue, new customers, gross profit, sales comparison.

Comparison Ppt PowerPoint Presentation File Picture
This is a comparison ppt powerpoint presentation file picture. This is a two stage process. The stages in this process are men, women, finance, percentage, compare.

Comparison Ppt PowerPoint Presentation Inspiration Structure
This is a comparison ppt powerpoint presentation inspiration structure. This is a two stage process. The stages in this process are compare, measure, finance, percentage, business.

Comparison Ppt PowerPoint Presentation Diagram Ppt
This is a comparison ppt powerpoint presentation diagram ppt. This is a two stage process. The stages in this process are male, female, compare, finance, percentage.

Comparison Ppt PowerPoint Presentation Professional Pictures
This is a comparison ppt powerpoint presentation professional pictures. This is a two stage process. The stages in this process are male, female, finance, compare, planning.

Comparison Ppt PowerPoint Presentation Ideas Vector
This is a comparison ppt powerpoint presentation ideas vector. This is a three stage process. The stages in this process are compare, finance, marketing, strategy, planning.
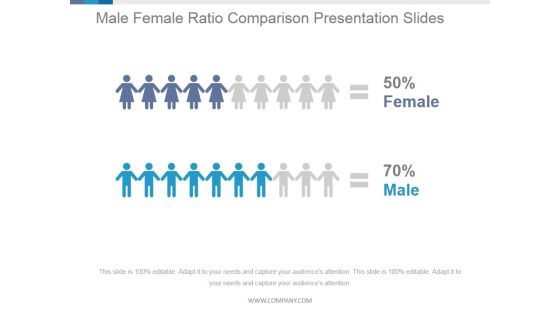
Male Female Ratio Comparison Ppt PowerPoint Presentation Picture
This is a male female ratio comparison ppt powerpoint presentation picture. This is a two stage process. The stages in this process are female, male, finance, compare.

Comparison Ppt PowerPoint Presentation Gallery Icons
This is a comparison ppt powerpoint presentation gallery icons. This is a two stage process. The stages in this process are business, strategy, analysis, pretention, comparison.

Comparison Ppt PowerPoint Presentation Summary Outfit
This is a comparison ppt powerpoint presentation summary outfit. This is a three stage process. The stages in this process are business, marketing, finance, human, analysis.

Comparison Ppt PowerPoint Presentation Pictures Format Ideas
This is a comparison ppt powerpoint presentation pictures format ideas. This is a two stage process. The stages in this process are business, strategy, marketing, analysis, male, female, comparison.
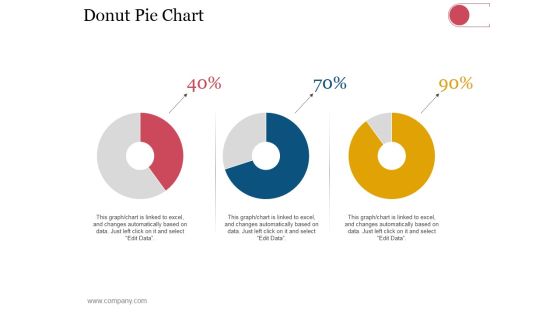
Donut Pie Chart Ppt PowerPoint Presentation Infographics Outfit
This is a donut pie chart ppt powerpoint presentation infographics outfit. This is a three stage process. The stages in this process are business, strategy, analysis, planning, dashboard, finance.

Product Roadmap Layout 2 Ppt PowerPoint Presentation Portfolio File Formats
This is a product roadmap layout 2 ppt powerpoint presentation portfolio file formats. This is a eight stage process. The stages in this process are bar, finance, analysis, planning, percentage.

Comparison Ppt PowerPoint Presentation File Templates
This is a comparison ppt powerpoint presentation file templates. This is a two stage process. The stages in this process are male, female.

Companies Budgeting And Cost Management Ppt PowerPoint Presentation Portfolio Slide
This is a companies budgeting and cost management ppt powerpoint presentation portfolio slide. This is a five stage process. The stages in this process are cost control, money control, price control.

Company Annual Report Table With Percentages Ppt PowerPoint Presentation Slides
This is a company annual report table with percentages ppt powerpoint presentation slides. This is ten stage process. The stages in this process are send date time, email name, recipients, delivered, spam, opt out, open, transactions, revenue.
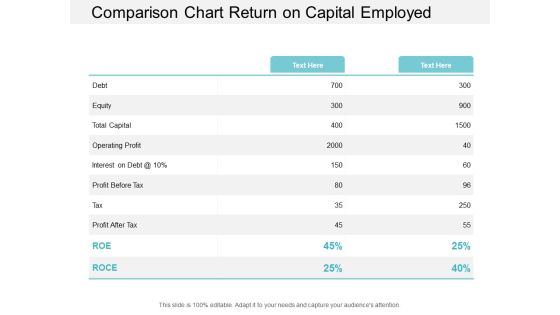
Comparison Chart Return On Capital Employed Ppt PowerPoint Presentation Portfolio Templates
This is a comparison chart return on capital employed ppt powerpoint presentation portfolio templates. This is a two stage process. The stages in this process are accounting ratio, roce, return on capital employed.

Business Performance Comparison Ppt PowerPoint Presentation Examples
This is a business performance comparison ppt powerpoint presentation examples. This is a two stage process. The stages in this process are business, performance, comparison, strategy, marketing.

Comparison Ppt PowerPoint Presentation Infographics Images
This is a comparison ppt powerpoint presentation infographics images. This is a two stage process. The stages in this process are business, strategy, marketing, planning, finance, comparison.

 Home
Home