AI PPT Maker
Templates
PPT Bundles
Design Services
Business PPTs
Business Plan
Management
Strategy
Introduction PPT
Roadmap
Self Introduction
Timelines
Process
Marketing
Agenda
Technology
Medical
Startup Business Plan
Cyber Security
Dashboards
SWOT
Proposals
Education
Pitch Deck
Digital Marketing
KPIs
Project Management
Product Management
Artificial Intelligence
Target Market
Communication
Supply Chain
Google Slides
Research Services
 One Pagers
All Categories
-
Home
- Customer Favorites
- Financial Business Plan
Financial Business Plan
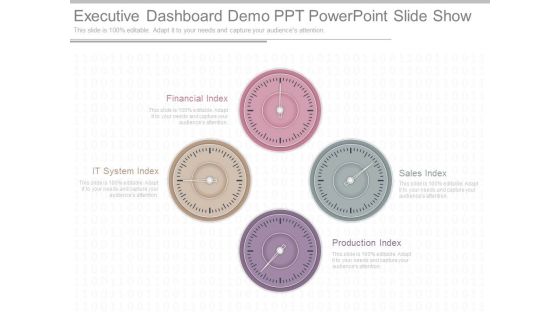
Executive Dashboard Demo Ppt Powerpoint Slide Show
This is a executive dashboard demo ppt powerpoint slide show. This is a four stage process. The stages in this process are financial index, it system index, production index, sales index.
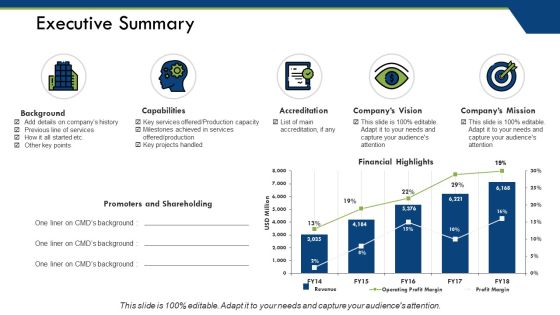
Executive Summary Ppt PowerPoint Presentation Show Grid
This is a executive summary ppt powerpoint presentation show grid. This is a five stage process. The stages in this process are background, capabilities, accreditation, financial highlights, promoters and shareholding.

Culture Success Factors Illustration Presentation Powerpoint
This is a culture success factors illustration presentation powerpoint. This is a six stage process. The stages in this process are merger success, changing client expectation, people power and politics, public policy, financial sustainability, cultural change, strategic positioning.

Analysis And Valuation Of Equity Securities Ppt PowerPoint Presentation Outline Example Topics
This is a analysis and valuation of equity securities ppt powerpoint presentation outline example topics. This is a three stage process. The stages in this process are industry analysis, valuation of equity securities, financial statement analysis.

Corporate Structuring Diagram Presentation Backgrounds
This is a corporate structuring diagram presentation backgrounds. This is a three stage process. The stages in this process are shareholders, board of directors, chief executive officer, chairman, chief operating officer, chief financial officer.
Types Of Audit Procedure Ppt PowerPoint Presentation Pictures
This is a types of audit procedure ppt powerpoint presentation pictures. This is a five stage process. The stages in this process are financial statements audit, operational audits, forensic audits, compliance audits, comprehensive audits.
Types Of Audit Procedure Ppt PowerPoint Presentation Portfolio Example
This is a types of audit procedure ppt powerpoint presentation portfolio example. This is a five stage process. The stages in this process are comprehensive audits, compliance audits, forensic audits, operational audis, financial statements audit.
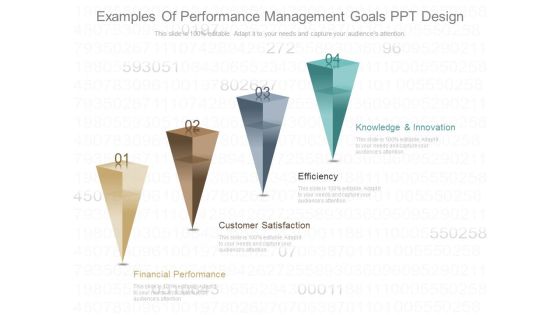
Examples Of Performance Management Goals Ppt Design
This is an examples of performance management goals ppt design. This is a four stage process. The stages in this process are financial performance, customer satisfaction, efficiency, knowledge and innovation.
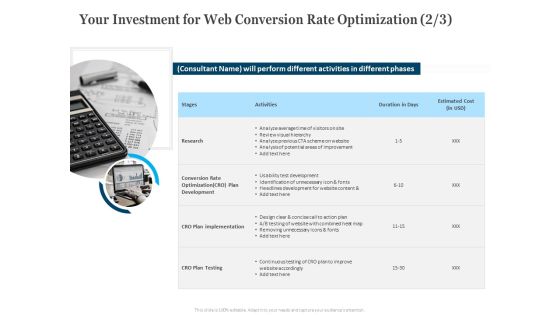
Your Investment For Web Conversion Rate Optimization Activities Ppt Layouts Demonstration PDF
Presenting your investment for web conversion rate optimization activities ppt layouts demonstration pdf to provide visual cues and insights. Share and navigate important information on one stages that need your due attention. This template can be used to pitch topics like research, conversion rate optimization cro, plan development, cro plan implementation, cro plan testing. In addition, this PPT design contains high-resolution images, graphics, etc, that are easily editable and available for immediate download.

Your Investment For Web Conversion Rate Optimization Ppt Inspiration Smartart PDF
Presenting your investment for web conversion rate optimization ppt inspiration smartart pdf to provide visual cues and insights. Share and navigate important information on one stages that need your due attention. This template can be used to pitch topics like research, cro plan testing, cro plan implementation, conversion rate optimization cro, plan development. In addition, this PPT design contains high-resolution images, graphics, etc, that are easily editable and available for immediate download.

Area Chart Ppt PowerPoint Presentation Layouts Vector
This is a area chart ppt powerpoint presentation layouts vector. This is a two stage process. The stages in this process are area chart, product, sales in percentage, financial year.

Column Chart Ppt PowerPoint Presentation Ideas Vector
This is a column chart ppt powerpoint presentation ideas vector. This is a two stage process. The stages in this process are column chart, product, financial years, sales in percentage, growth.

Line Chart Ppt PowerPoint Presentation Professional Grid
This is a line chart ppt powerpoint presentation professional grid. This is a two stage process. The stages in this process are sales in percentage, financial years, product, line chart.

Area Chart Ppt PowerPoint Presentation Icon Summary
This is a area chart ppt powerpoint presentation icon summary. This is a two stage process. The stages in this process are financial year, area chart, in percentage, product.

Bar Chart Ppt PowerPoint Presentation Icon Information
This is a bar chart ppt powerpoint presentation icon information. This is a one stage process. The stages in this process are product, sales in percentage, financial years, bar graph, growth.

Column Chart Ppt PowerPoint Presentation Layouts Tips
This is a column chart ppt powerpoint presentation layouts tips. This is a six stage process. The stages in this process are sales in percentage, financial year, bar graph, growth, success.

Line Chart Ppt PowerPoint Presentation Infographics Infographics
This is a line chart ppt powerpoint presentation infographics infographics. This is a two stage process. The stages in this process are product, sales in percentage, financial year, line chart, finance.

Line Chart Ppt PowerPoint Presentation Gallery Templates
This is a line chart ppt powerpoint presentation gallery templates. This is a two stage process. The stages in this process are product, financial years, sales in percentage, line chart.

Area Chart Ppt PowerPoint Presentation Icon Show
This is a area chart ppt powerpoint presentation icon show. This is a two stage process. The stages in this process are product, financial year, in percentage, area chart.

Column Chart Ppt PowerPoint Presentation Slides Show
This is a column chart ppt powerpoint presentation slides show. This is a two stage process. The stages in this process are column chart, product, sales in percentage, financial year, growth.

Area Chart Ppt PowerPoint Presentation Gallery Icons
This is a area chart ppt powerpoint presentation gallery icons. This is a two stage process. The stages in this process are financial year, sales in percentage, product, finance, graph.

Line Chart Ppt PowerPoint Presentation Layouts Example
This is a line chart ppt powerpoint presentation layouts example. This is a two stage process. The stages in this process are sales in percentage, product, financial years, growth, success.

Line Chart Ppt PowerPoint Presentation Show Guide
This is a line chart ppt powerpoint presentation show guide. This is a two stage process. The stages in this process are product, sales in percentage, financial years, growth, success.

Affinity Marketing And Partnership Ppt Slide
This is a affinity marketing and partnership ppt slide. This is a four stage process. The stages in this process are financial communication, affinity marketing and partnership, advertising strategy, management and organization.
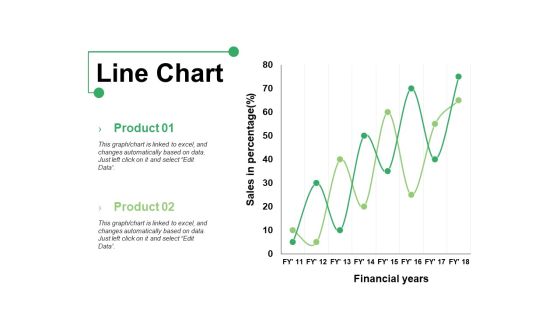
Line Chart Ppt PowerPoint Presentation Show Graphics Example
This is a line chart ppt powerpoint presentation show graphics example. This is a two stage process. The stages in this process are product, line chart, financial years, sales in percentage.

Column Chart Ppt PowerPoint Presentation Portfolio Example Topics
This is a column chart ppt powerpoint presentation portfolio example topics. This is a two stage process. The stages in this process are product, financial year, sales in percentage, column chart.

Column Chart Ppt PowerPoint Presentation Slides Visual Aids
This is a column chart ppt powerpoint presentation slides visual aids. This is a six stage process. The stages in this process are bar graph, growth, success, sales in percentage, financial year.

Line Chart Ppt PowerPoint Presentation Infographic Template Master Slide
This is a line chart ppt powerpoint presentation infographic template master slide. This is a two stage process. The stages in this process are product, financial years, sales in percentage.
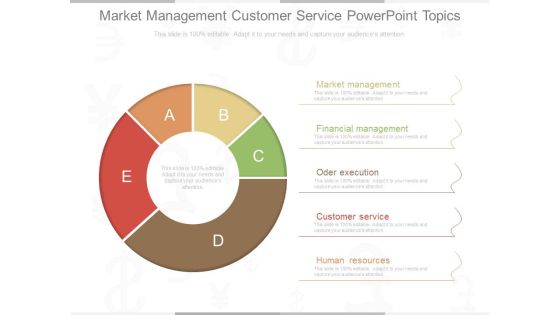
Market Management Customer Service Powerpoint Topics
This is a market management customer service powerpoint topics. This is a five stage process. The stages in this process are market management, financial management, oder execution, customer service, human resources.
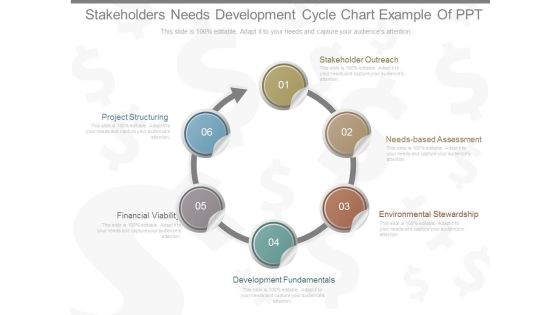
Stakeholders Needs Development Cycle Chart Example Of Ppt
This is a stakeholders needs development cycle chart example of ppt. This is a six stage process. The stages in this process are stakeholder outreach, needs based assessment, environmental stewardship,, development fundamentals, financial viability, project structuring.

Cycle Chart Of Mutual Funds Sample Diagram Ppt Images
This is a cycle chart of mutual funds sample diagram ppt images. This is a five stage process. The stages in this process are reinvestment, returns, investors, fund manager, financial securities.

Area Chart Ppt PowerPoint Presentation Show Layout Ideas
This is a area chart ppt powerpoint presentation show layout ideas. This is a two stage process. The stages in this process are product, in percentage, financial year, growth.

Scatter Bubble Chart Ppt PowerPoint Presentation Summary Files
This is a scatter bubble chart ppt powerpoint presentation summary files. This is a six stage process. The stages in this process are product, financial year, profit, highest profit.
Scatter Bubble Chart Ppt PowerPoint Presentation Icon Elements
This is a scatter bubble chart ppt powerpoint presentation icon elements. This is a six stage process. The stages in this process are highest profit, profit, financial year, product.
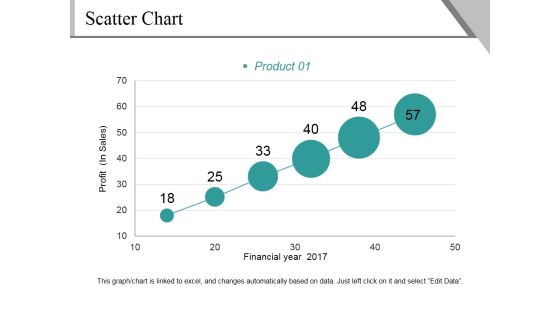
Scatter Chart Ppt PowerPoint Presentation File Background Image
This is a scatter chart ppt powerpoint presentation file background image. This is a six stage process. The stages in this process are profit, financial year, product, growth, success.

Column Chart Ppt PowerPoint Presentation Gallery Slide Portrait
This is a column chart ppt powerpoint presentation gallery slide portrait. This is a two stage process. The stages in this process are sales in percentage, financial year, product, bar graph, growth.

Bar Chart Ppt PowerPoint Presentation Infographics Format Ideas
This is a bar chart ppt powerpoint presentation infographics format ideas. This is a two stage process. The stages in this process are bar graph, product, financial year, sales in percentage.

Distribution Considerations Powerpoint Slide Designs
This is a distribution considerations powerpoint slide designs. This is a five stage process. The stages in this process are distribution considerations, financial strategies, market opportunities, resource identification, near term needs.

Potential Target Acquisitions Diagram Powerpoint Slides
This is a potential target acquisitions diagram powerpoint slides. This is a six stage process. The stages in this process are acquisition rationale, financial resources, strategy, sectors, scale, stage of development, ability.
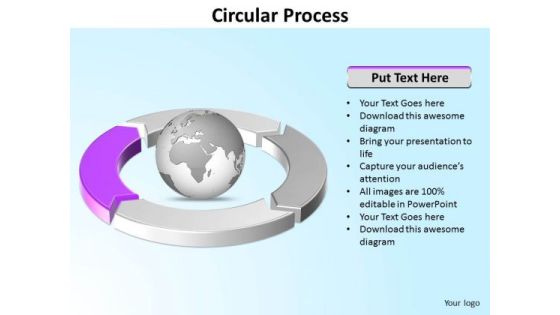
Ppt Four Segments Around Microsoft PowerPoint Backgrounds Circle Purple Templates
PPT four segments around microsoft powerpoint backgrounds circle purple Templates-This PowerPoint Diagram can be used to represent worldwide business issues such as financial data, stock market Exchange, increase in sales, corporate presentations and more. It illustrates the purple component. This Diagram will fit for Business Presentations.-Can be used for presentations on abstract, achievement, aim, arrow, background, business, chart, communication, company, competition, concept, design, development, diagram, direction, finance, financial, forecast, forward, goal, graph, graphic, growth, icon, illustration, increase, investment, leader, leadership, marketing, motion, moving, path, price, process, profit, progress, progress bar, shape, sign, success, symbol, target, team, teamwork, turquoise blue, up, upward-PPT four segments around microsoft powerpoint backgrounds circle purple Templates
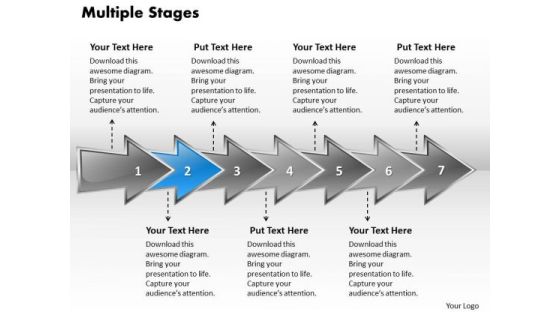
Ppt Colorful Arrows PowerPoint Slide Text Explaining Seven Aspects Templates
PPT colorful arrows powerpoint slide text explaining seven aspects Templates-Arrows PowerPoint Diagram is nice for financial PowerPoint Diagram presentations as well as other analysis or business PowerPoint diagram needs. Use this graphical approach to represent global business issues such as financial data, stock market Exchange, increase in sales, corporate presentations and more.-PPT colorful arrows powerpoint slide text explaining seven aspects Templates-analysis, arrow, background, business, chart, communication, concept, construction, delivery, design, development, engineering, fabrication, feasibiliti, generated, growth, idea, industry, making, production, products, science, sequence, shape

Current Marketing Situation Ppt Samples Download
This is a current marketing situation ppt samples download. This is a four stage process. The stages in this process are current marketing situation, action programs, opportunity and issue analysis, financial projections.

Bar Diagram Ppt PowerPoint Presentation Gallery Structure
This is a bar diagram ppt powerpoint presentation gallery structure. This is a three stage process. The stages in this process are financial in years, sales in percentage, bar graph, growth, success.

Bar Diagram Ppt PowerPoint Presentation Pictures Background Image
This is a bar diagram ppt powerpoint presentation pictures background image. This is a three stage process. The stages in this process are financial in years, sales in percentage, bar graph, growth, success.

Area Stacked Ppt PowerPoint Presentation Infographics Shapes
This is a area stacked ppt powerpoint presentation infographics shapes. This is a two stage process. The stages in this process are product, area stacked, sales in percentage, financial year.

Stacked Area Clustered Column Ppt PowerPoint Presentation Summary Slides
This is a stacked area clustered column ppt powerpoint presentation summary slides. This is a three stage process. The stages in this process are product, in percentage, financial year, bar graph.

Analysing Characteristics Of Broad Technique For Differentiation Diagrams PDF
The slide showcases the major characteristics of a company or business that adopted broad differentiation strategy which helps businesses create unique products and set company apart from businesses. It covers features like strategic target, basic competitive advantage, product line, product emphasis, marketing emphasis and keys to sustaining the strategy. Presenting Analysing Characteristics Of Broad Technique For Differentiation Diagrams PDF to dispense important information. This template comprises six stages. It also presents valuable insights into the topics including Strategic Target, Product Line, Production Emphasis. This is a completely customizable PowerPoint theme that can be put to use immediately. So, download it and address the topic impactfully.
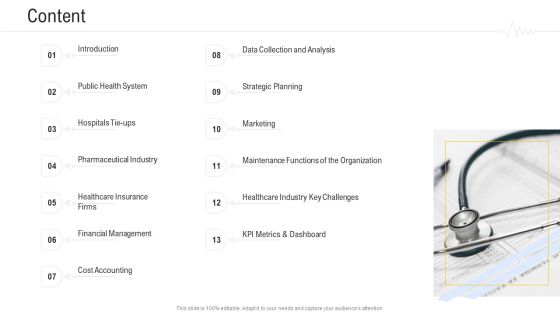
Hospital Management System Content Summary PDF
Deliver an awe inspiring pitch with this creative hospital management system content summary pdf bundle. Topics like strategic planning marketing, financial management, cost accounting, kpi metrics and dashboard can be discussed with this completely editable template. It is available for immediate download depending on the needs and requirements of the user.
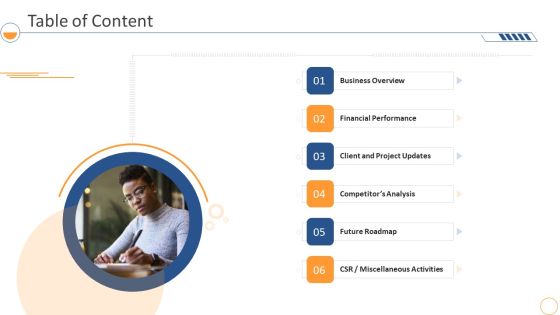
Monthly Company Performance Analysistable Of Content Demonstration PDF
This is a monthly company performance analysistable of content demonstration pdf template with various stages. Focus and dispense information on six stages using this creative set, that comes with editable features. It contains large content boxes to add your information on topics like financial, performance, business overview, analysis, project. You can also showcase facts, figures, and other relevant content using this PPT layout. Grab it now.

Monthly Gantt Chart For Construction Project With Waterfall Approach Ppt Infographics Clipart Images PDF
This slide showcases the monthly timeline to develop a construction project by using waterfall model. It includes pre planning, outline planning, in depth planning, financial plan etc. From laying roadmaps to briefing everything in detail, our templates are perfect for you. You can set the stage with your presentation slides. All you have to do is download these easy to edit and customizable templates. Monthly Gantt Chart For Construction Project With Waterfall Approach Ppt Infographics Clipart Images PDF will help you deliver an outstanding performance that everyone would remember and praise you for. Do download this presentation today.

Target Chart For Strategic Management Process Powerpoint Slides
This PowerPoint template has been designed with four steps target chart. The PowerPoint template may be used to display strategic management process. You can download this PowerPoint slide for corporate presentations or annual meeting and business plans.
Four Linear Steps And Icons Powerpoint Slides
This PPT slide has been designed with four linear text boxes with icons. This PowerPoint template helps to exhibit process of business planning. Use this diagram slide to build an exclusive presentation.

How To Administer Accounts To Increase Sales Revenue How To Nurture Lead Account Themes PDF
The purpose of this slide is to provide information regarding account nurturing process initiated by ABM representative. Key initiatives such as email follow up, promotional calls, etc. are to be made for three months in order to maintain or improve accounts interest in firms offerings. Presenting how to administer accounts to increase sales revenue how to nurture lead account themes pdf to provide visual cues and insights. Share and navigate important information on ten stages that need your due attention. This template can be used to pitch topics like customized, product, sales. In addtion, this PPT design contains high resolution images, graphics, etc, that are easily editable and available for immediate download.

Exit Strategy For The Investors Ppt Infographics Good PDF
This slide Provides the Exit Strategy which includes Acquisition, Financial Buyer and Liquidation.Presenting exit strategy for the investors ppt infographics good pdf. to provide visual cues and insights. Share and navigate important information on three stages that need your due attention. This template can be used to pitch topics like most likely exit options for companies, financial buyer, liquidation. In addtion, this PPT design contains high resolution images, graphics, etc, that are easily editable and available for immediate download.

Exit Strategy For The Investors Ppt Inspiration Show PDF
This slide Provides the Exit Strategy which includes Acquisition, Financial Buyer and Liquidation. Presenting exit strategy for the investors ppt inspiration show pdf to provide visual cues and insights. Share and navigate important information on three stages that need your due attention. This template can be used to pitch topics like acquisition, financial buyer, liquidation. In addition, this PPT design contains high-resolution images, graphics, etc, that are easily editable and available for immediate download.

Challenges Faced By Partnership Organizations In Project Administration Elements PDF
This slide covers challenges faced by partnership organizations in project management. These challenges are management style, financial issues and disparities in skills and roles. Presenting Challenges Faced By Partnership Organizations In Project Administration Elements PDF to dispense important information. This template comprises Four stages. It also presents valuable insights into the topics including Management Style, Financial Issues, Disparities In Skills. This is a completely customizable PowerPoint theme that can be put to use immediately. So, download it and address the topic impactfully.

Developing Learning Model To Increase Shareholder Value Ppt Gallery Images PDF
This slide exhibits various prospective to increase shareholder value for longer period using productivity and growth strategy. It includes elements such as financial, customer, internal processes, learning and growth prospective. Showcasing this set of slides titled Developing Learning Model To Increase Shareholder Value Ppt Gallery Images PDF. The topics addressed in these templates are Productivity Strategy, Growth Strategy, Financial Prospective. All the content presented in this PPT design is completely editable. Download it and make adjustments in color, background, font etc. as per your unique business setting.

Cost Allotment Technique New Costing System Flow Portrait PDF
This slide covers the new financial costing system flow after allocation and implementation of cost allocation methods.This is a Cost Allotment Technique New Costing System Flow Portrait PDF template with various stages. Focus and dispense information on one stage using this creative set, that comes with editable features. It contains large content boxes to add your information on topics like Financial System, Statutory Reporting, Allocated Overheads. You can also showcase facts, figures, and other relevant content using this PPT layout. Grab it now.

Artificial Intelligence Applications Technology By Industry Icons PDF
This slide defines the use of artificial intelligence AI technology by different industries. It includes information related to financial, healthcare and life sciences, manufacturing, retail and government or public sector. Presenting Artificial Intelligence Applications Technology By Industry Icons PDF to dispense important information. This template comprises five stages. It also presents valuable insights into the topics including Financial Services, Retail, Manufacturing. This is a completely customizable PowerPoint theme that can be put to use immediately. So, download it and address the topic impactfully.
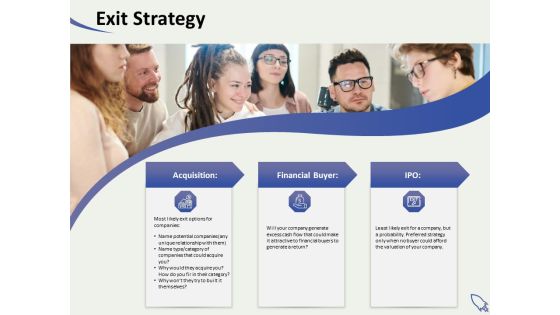
Social Enterprise Funding Exit Strategy Ppt PowerPoint Presentation Infographics Vector PDF
Presenting this set of slides with name social enterprise funding exit strategy ppt powerpoint presentation infographics vector pdf. This is a three stage process. The stages in this process are acquisition, financial buyer, ipo, exit options, potential companies, unique relationship, excess cash flow, financial buyers, preferred strategy. This is a completely editable PowerPoint presentation and is available for immediate download. Download now and impress your audience.
