AI PPT Maker
Templates
PPT Bundles
Design Services
Business PPTs
Business Plan
Management
Strategy
Introduction PPT
Roadmap
Self Introduction
Timelines
Process
Marketing
Agenda
Technology
Medical
Startup Business Plan
Cyber Security
Dashboards
SWOT
Proposals
Education
Pitch Deck
Digital Marketing
KPIs
Project Management
Product Management
Artificial Intelligence
Target Market
Communication
Supply Chain
Google Slides
Research Services
 One Pagers
All Categories
-
Home
- Customer Favorites
- Financial Budget
Financial Budget

Competitor Analysis Ppt PowerPoint Presentation File Graphics Example
This is a competitor analysis ppt powerpoint presentation file graphics example. This is a four stage process. The stages in this process are revenue, sales development of industry, own company, placeholder, competitor.
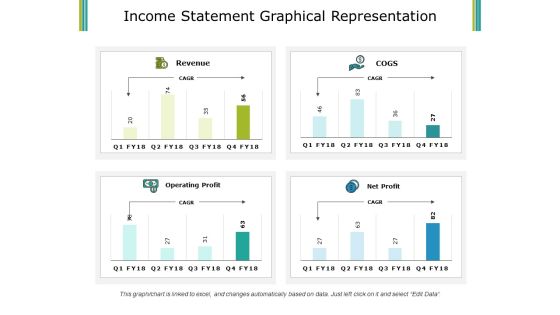
Income Statement Graphical Representation Ppt PowerPoint Presentation Summary Inspiration
This is a income statement graphical representation ppt powerpoint presentation summary inspiration. This is a four stage process. The stages in this process are revenue, cogs, operating profit, net profit.

Sales Performance Dashboard Top Opportunities Ppt PowerPoint Presentation Layouts Template
This is a sales performance dashboard top opportunities ppt powerpoint presentation layouts template. This is a eight stage process. The stages in this process are revenue, new customer, gross profit, customer satisfaction, brand profitability.
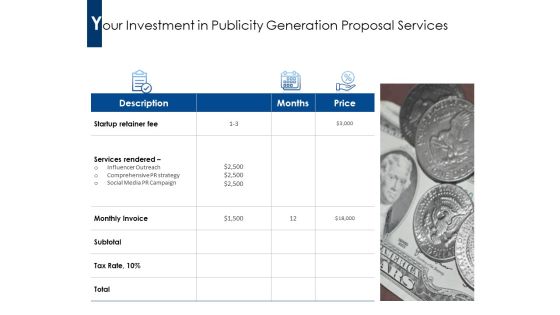
Your Investment In Publicity Generation Proposal Services Ppt PowerPoint Presentation Professional Outline
Presenting this set of slides with name your investment in publicity generation proposal services ppt powerpoint presentation professional outline. This is a one stage process. The stages in this process are startup retainer fee, services rendered, monthly invoice, price . This is a completely editable PowerPoint presentation and is available for immediate download. Download now and impress your audience.
Income Cash Inflow Vector Icon Ppt Powerpoint Presentation Professional Vector
This is a income cash inflow vector icon ppt powerpoint presentation professional vector. This is a two stage process. The stages in this process are earn money, earn cash, earn funds.
Man With Dollar Sign Vector Icon Ppt Powerpoint Presentation Summary Example Introduction
This is a man with dollar sign vector icon ppt powerpoint presentation summary example introduction. This is a two stage process. The stages in this process are earn money, earn cash, earn funds.

Stock Chart Finance Analysis Ppt Powerpoint Presentation Ideas Portrait
This is a stock chart finance analysis ppt powerpoint presentation ideas portrait. This is a three stage process. The stages in this process are finance, marketing, management, investment, strategy.

Pie Chart Finance Ppt PowerPoint Presentation Infographics Mockup
This is a pie chart finance ppt powerpoint presentation infographics mockup . This is a four stage process. The stages in this process are finance, marketing, management, investment, analysis.

Financing Ppt PowerPoint Presentation Infographic Template Example Topics
This is a financing ppt powerpoint presentation infographic template example topics. This is a two stage process. The stages in this process are investment terms, valuation of the company.
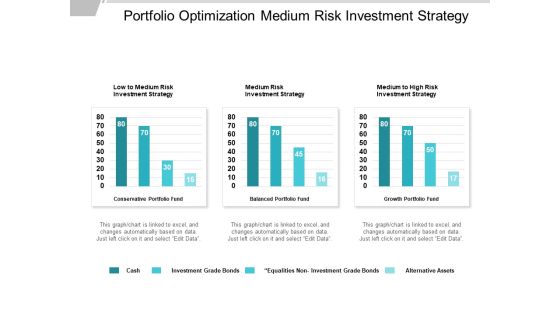
Portfolio Optimization Medium Risk Investment Strategy Ppt PowerPoint Presentation Model Good
This is a portfolio optimization medium risk investment strategy ppt powerpoint presentation model good. This is a four stage process. The stages in this process are portfolio strategies, portfolio plans, business.

Business Framework Economic Value Add PowerPoint Presentation
This image slide displays business framework for economic value added diagram. This image slide may be used in your presentations to depict firms economic profits and business financial reports. You may change color, size and orientation of any icon to your liking. Create professional presentations using this image slide.
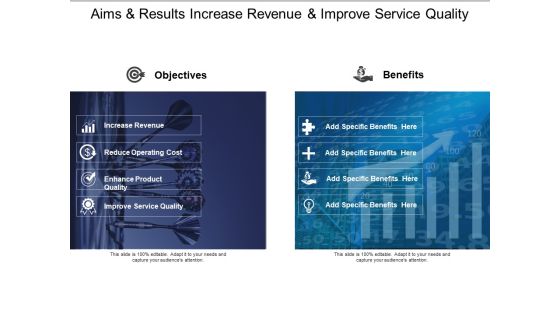
Aims And Results Increase Revenue And Improve Service Quality Ppt PowerPoint Presentation Gallery Design Inspiration
This is a aims and results increase revenue and improve service quality ppt powerpoint presentation gallery design inspiration. This is a two stage process. The stages in this process are objective and benefit, goal and benefit, plan and benefit.
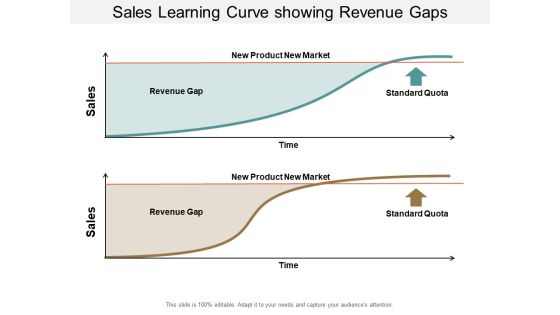
Sales Learning Curve Showing Revenue Gaps Ppt PowerPoint Presentation Infographic Template Master Slide
This is a sales learning curve showing revenue gaps ppt powerpoint presentation infographic template master slide. This is a two stage process. The stages in this process are experience curve, learning curve.
Happy Woman With Dollars In Hand Ppt PowerPoint Presentation Icon Visuals
This is a happy woman with dollars in hand ppt powerpoint presentation icon visuals. This is a one stage process. The stages in this process are mutual funds, funds to buy, investment slide.
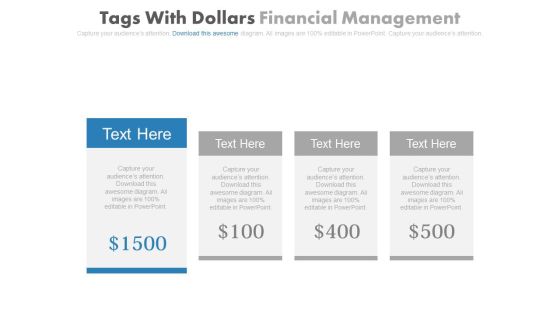
Four Dollar Tags For Corporate Entrepreneurship Powerpoint Slides
This PowerPoint template has been designed with diagram of four text tags with dollar price. This PPT slide can be used to prepare presentations for personal finances and tax planning. You can download finance PowerPoint template to prepare awesome presentations.

Promotion Techniques To Grow Small Businesses Economically Formats PDF
This slide represents marketing approaches utilized by small businesses industries to secure and build customer base along with brand image. Elements included in this slide are marketing strategies, action plan, estimated budget and impact. Pitch your topic with ease and precision using this Promotion Techniques To Grow Small Businesses Economically Formats PDF. This layout presents information on Techniques, Action Steps, Budget, Impact. It is also available for immediate download and adjustment. So, changes can be made in the color, design, graphics or any other component to create a unique layout.

Cost Of Quality Four Cost Categories Ppt PowerPoint Presentation Portfolio Background Designs
This is a cost of quality four cost categories ppt powerpoint presentation portfolio background designs. This is a three stage process. The stages in this process are finance, business, analysis, marketing, strategy.

Strategic Brand Promotion For Enhanced Recognition And Revenue Growth Detailed Product Launch Marketing Download PDF
This slide shows a quarterly Product Launch Marketing Budget with marketing activities related to public relations, web marketing, advertising and collateral along with budget allocated for each activity and total budget. Crafting an eye catching presentation has never been more straightforward. Let your presentation shine with this tasteful yet straightforward Strategic Brand Promotion For Enhanced Recognition And Revenue Growth Detailed Product Launch Marketing Download PDF template. It offers a minimalistic and classy look that is great for making a statement. The colors have been employed intelligently to add a bit of playfulness while still remaining professional. Construct the ideal Strategic Brand Promotion For Enhanced Recognition And Revenue Growth Detailed Product Launch Marketing Download PDF that effortlessly grabs the attention of your audience. Begin now and be certain to wow your customers.
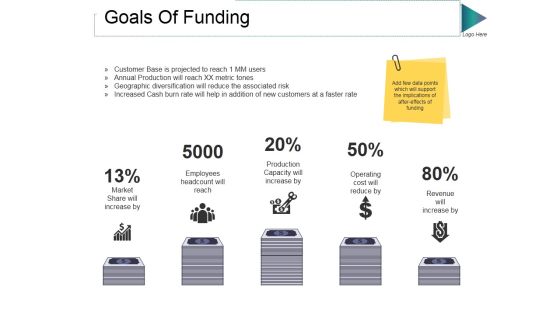
Goals Of Funding Ppt PowerPoint Presentation Summary Background Designs
This is a goals of funding ppt powerpoint presentation summary background designs. This is a five stage process. The stages in this process are finance, business, percentage, marketing, currency.

Customer Acquisition Cost Template 2 Ppt PowerPoint Presentation Professional Backgrounds
This is a customer acquisition cost template 2 ppt powerpoint presentation professional backgrounds. This is a three stage process. The stages in this process are team composition, salary cost, on target earnings, total team cost.

Hourglass With Money And Currency Notes PowerPoint Templates
Create dynamic presentations with this professional slide containing a graphic of hour glass with dollar currency notes and gears. This template is designed to portray the concepts of financial management. Add this slide in your presentations to visually support your content
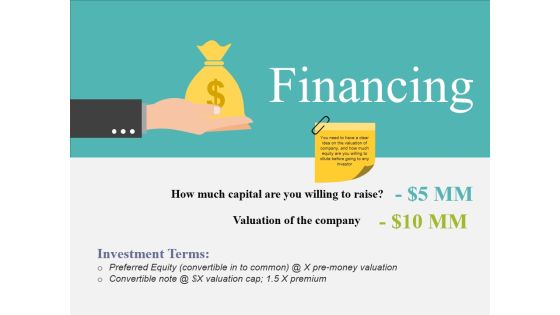
Financing Ppt PowerPoint Presentation Summary Good
This is a financing ppt powerpoint presentation summary good. This is a two stage process. The stages in this process are dollar, business, finance, marketing, symbol.
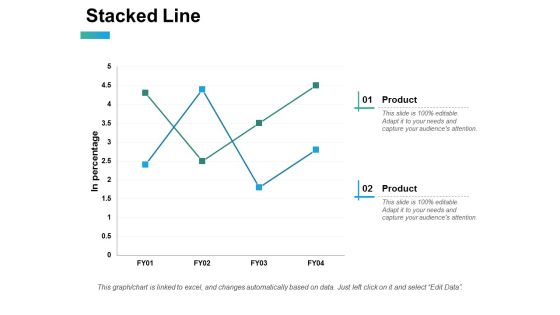
Stacked Line Ppt PowerPoint Presentation Professional Layouts
This is a stacked line ppt powerpoint presentation professional layouts. This is a two stage process. The stages in this process are finance, business, marketing, planning, investment.

Area Chart Ppt PowerPoint Presentation Summary Model
This is a area chart ppt powerpoint presentation summary model. This is a two stage process. The stages in this process are analysis, finance, marketing, management, investment.

Dashboard Marketing Planning Ppt PowerPoint Presentation Slides Slideshow
This is a dashboard marketing planning ppt powerpoint presentation slides slideshow. This is a three stage process. The stages in this process are dashboard, finance, analysis, business, investment.

Stock Photo Piggy Bank On Up Arrow PowerPoint Slide
This image slide displays piggy banks on arrow. This image slide has been crafted with graphic of piggy banks riding on black growth arrow. Use this image slide, in your presentations to express views on financial growth and business success. This image slide will enhance the quality of your presentations.
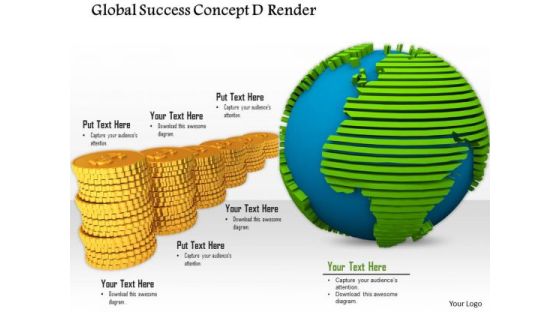
Stock Photo Globe With Gold Coins For Global Success PowerPoint Slide
This image slide displays globe with gold coins. This image slide depicts financial and economic growth and success. Use this image slide, in your presentation to express social and business views related to world. This image slide will enhance the quality of your presentations.

Stock Photo Globe With Red Textured Map Gold Coins PowerPoint Slide
This image slide displays red textured globe with gold coins. This image slide depicts financial and economic growth and success. Use this image slide, in your presentation to express social and business views related to world. This image slide will enhance the quality of your presentations.
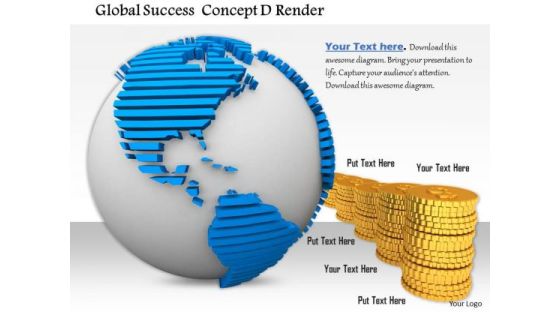
Stock Photo White Colored Globe Textured Map Gold Coins PowerPoint Slide
This image slide displays white colored textured globe with gold coins. This image slide depicts financial and economic growth. Use this image slide, in your presentation to express social and business views related to world. This image slide will enhance the quality of your presentations.

Customer Acquisition Cost Template 2 Ppt PowerPoint Presentation Show Format Ideas
This is a customer acquisition cost template 2 ppt powerpoint presentation show format ideas. This is a four stage process. The stages in this process are team composition, on target earnings, salary cost, total team cost, average cost per person.

Cost Reduction With Downward Arrow And Dollar Sign Ppt Powerpoint Presentation Infographics Templates
This is a cost reduction with downward arrow and dollar sign ppt powerpoint presentation infographics templates. This is a three stage process. The stages in this process are data analysis, data science, information science.

Modes Of Finance Ppt PowerPoint Presentation Gallery Designs
This is a modes of finance ppt powerpoint presentation gallery designs. This is a four stage process. The stages in this process are business, finance, marketing, icons, strategy.

Introduction To Mobile Money In Developing Countries Customer Journey Map For Banks Sample PDF
Deliver and pitch your topic in the best possible manner with this introduction to mobile money in developing countries customer journey map for banks sample pdf Use them to share invaluable insights on client on boarding, account opening, financial planning and impress your audience. This template can be altered and modified as per your expectations. So, grab it now.

Finance Talent Mapping Ppt PowerPoint Presentation Portfolio Template
This is a finance talent mapping ppt powerpoint presentation portfolio template. This is a three stage process. The stages in this process are business, management, strategy, finance, icons.

Cash Flow Statement Graphical Representation Ppt PowerPoint Presentation Ideas Graphic Tips
This is a cash flow statement graphical representation ppt powerpoint presentation ideas graphic tips. This is a four stage process. The stages in this process are operations, financing activities, investing activities, net increase in cash.
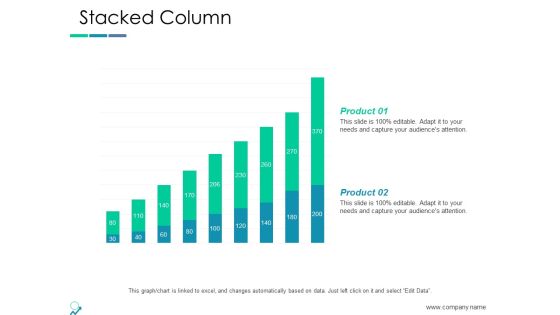
Stacked Column Ppt PowerPoint Presentation Infographics File Formats
This is a stacked column ppt powerpoint presentation infographics file for. This is a two stage process. The stages in this process are stacked column, management, marketing, business, investment.
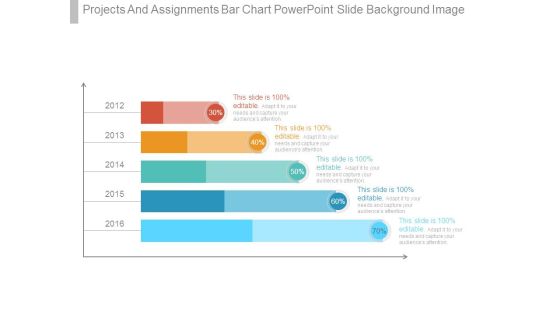
Projects And Assignments Bar Chart Powerpoint Slide Background Image
This is a projects and assignments bar chart powerpoint slide background image. This is a five stage process. The stages in this process are finance, presentation, business, strategy, marketing.
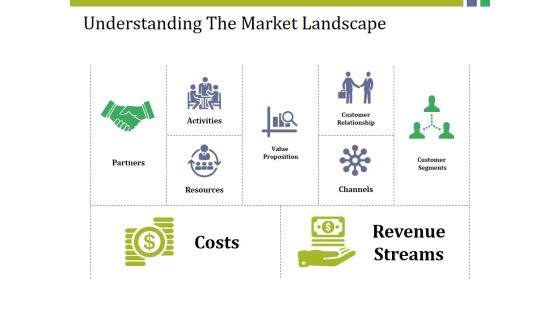
Understanding The Market Landscape Ppt PowerPoint Presentation Model Skills
This is a understanding the market landscape ppt powerpoint presentation model skills. This is a two stage process. The stages in this process are costs, resources, channels, partners, activities.
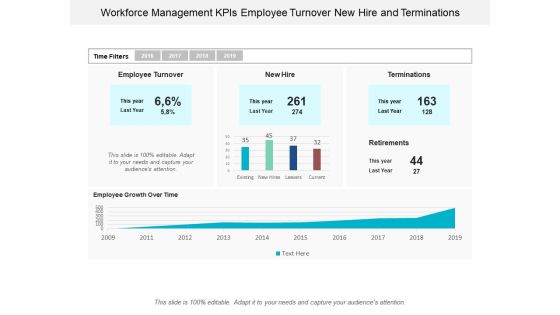
Workforce Management Kpis Employee Turnover New Hire And Terminations Ppt Powerpoint Presentation Portfolio Display
This is a workforce management kpis employee turnover new hire and terminations ppt powerpoint presentation portfolio display. This is a five stage process. The stages in this process are resource management, wealth management, capital management.

Business Framework Economic Value Add 2 PowerPoint Presentation
This image slide displays business framework for economic value added diagram. This image slide may be used in your presentations to depict firms economic profits and business financial reports. You may change color, size and orientation of any icon to your liking. Create professional presentations using this image slide.

Business Growth Kpis Ppt PowerPoint Presentation File Good
This is a business growth kpis ppt powerpoint presentation file good. This is a five stage process. The stages in this process are cost reduction strategies.

Business Growth Ratio Analysis Ppt PowerPoint Presentation Gallery Design Templates
This is a business growth ratio analysis ppt powerpoint presentation gallery design templates. This is a three stage process. The stages in this process are cost reduction strategies.

Business Performance Rating Scale Ppt PowerPoint Presentation Portfolio Designs Download
This is a business performance rating scale ppt powerpoint presentation portfolio designs download. This is a two stage process. The stages in this process are cost reduction strategies.

Business Performance Status Ppt PowerPoint Presentation Model Professional
This is a business performance status ppt powerpoint presentation model professional. This is a four stage process. The stages in this process are cost reduction strategies.
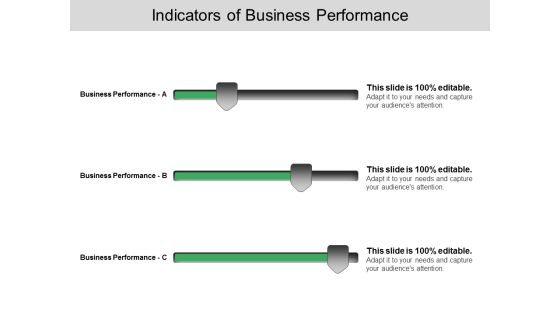
Indicators Of Busines Performance Ppt PowerPoint Presentation Infographics Influencers
This is a indicators of busines performance ppt powerpoint presentation infographics influencers. This is a three stage process. The stages in this process are cost reduction strategies.

Economic Capital And Solvency Compliance And Reporting Diagram Presentation Background Images
This is a economic capital and solvency compliance and reporting diagram presentation background images. This is a six stage process. The stages in this process are confidence level, standard report templates, expected loss, algo financial modeler, standard formula model, economic capital.

Banking Investment Management Chart Powerpoint Slides
This is a banking investment management chart powerpoint slides. This is a nine stage process. The stages in this process are tax planning, estate and trust planning, us banking and credit capabilities, us business owner planning, banking and cash management, financial literacy, credit strategies, philanthropy, investment management, private client, private client, team.

Stock Photo Piggy On Three Dimensional Arrow PowerPoint Slide
This image slide displays piggy banks on arrows. This image slide has been crafted with graphic of piggy banks riding on growth arrows. Use this image slide, in your presentations to express views on financial growth and business success. This image slide will enhance the quality of your presentations.
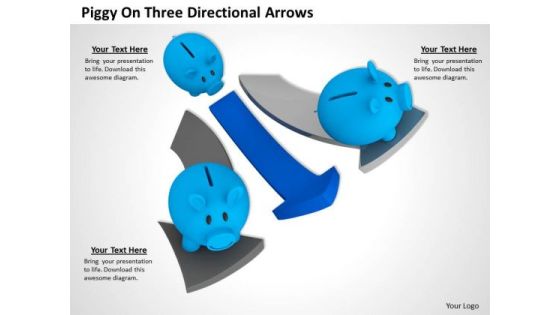
Stock Photo Piggy On Three Directional Arrows PowerPoint Slide
This image slide displays piggy banks on arrows. This image slide has been crafted with graphic of piggy banks riding on growth arrows. Use this image slide, in your presentations to express views on financial growth and business success. This image slide will enhance the quality of your presentations.

Private Capital Scorecard Quarterly Private Capital Scorecard With Revenue Structure PDF
Deliver and pitch your topic in the best possible manner with this Private Capital Scorecard Quarterly Private Capital Scorecard With Revenue Structure PDF Use them to share invaluable insights on Financial Results, Operating Margin, Other Income and impress your audience. This template can be altered and modified as per your expectations. So, grab it now.

Finland Map With Economic Data Analysis Powerpoint Slides
This PowerPoint template has been designed with Finland Map and areas highlighted. You may use this slide to display financial strategy analysis. This diagram provides an effective way of displaying information you can edit text, color, shade and style as per you need.

Strategy For Regional Economic Progress Outlining Regional Marketing Development Schedule Pictures PDF
This slide provides the glimpse about the regional market development schedule which focuses on what, who, objectives, budget and when in this time chart. Presenting strategy for regional economic progress outlining regional marketing development schedule pictures pdf to provide visual cues and insights. Share and navigate important information on five stages that need your due attention. This template can be used to pitch topics like sales research, management, marketing, social media campion, budget. In addtion, this PPT design contains high resolution images, graphics, etc, that are easily editable and available for immediate download.
Six Steps In Linear Flow With Icons Sales Strategies And Finacial Projections Ppt Powerpoint Presentation Inspiration Guide
This is a six steps in linear flow with icons sales strategies and finacial projections ppt powerpoint presentation inspiration guide. This is a six stage process. The stages in this process are 7 point infographic, 7 steps infographic, 7 stages infographic.
three steps in linear flow with icons sales strategies and finacial projections ppt powerpoint presentation layouts visual aids
This is a three steps in linear flow with icons sales strategies and finacial projections ppt powerpoint presentation layouts visual aids. This is a three stage process. The stages in this process are 7 point infographic, 7 steps infographic, 7 stages infographic.

Pareto Analysis With 80 20 Rule Ppt Slides
This is a pareto analysis with 80 20 rule ppt slides. This is a two stage process. The stages in this process are finance, business.\n\n
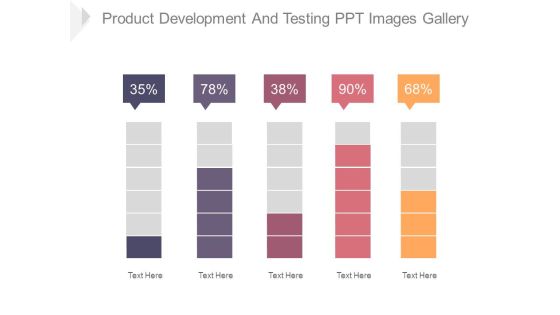
Product Development And Testing Ppt Images Gallery
This is a product development and testing ppt images gallery. This is a five stage process. The stages in this process are business, strategy, finance, management, analysis.

Competitive Analysis Ppt PowerPoint Presentation Graphics
This is a competitive analysis ppt powerpoint presentation graphics. This is a six stage process. The stages in this process are competitor, business, marketing, percentage, finance.

Stacked Line Ppt PowerPoint Presentation Infographics Tips
This is a stacked line ppt powerpoint presentation infographics tips. This is a three stage process. The stages in this process are product, business, percentage, finance.

Bar Graph Ppt PowerPoint Presentation Infographics Clipart
This is a bar graph ppt powerpoint presentation infographics clipart. This is a three stage process. The stages in this process are product, graph, finance, business, marketing.

Comparison Ppt PowerPoint Presentation Show Gridlines
This is a comparison ppt powerpoint presentation show gridlines. This is a two stage process. The stages in this process are male, female, percentage, finance, compare.
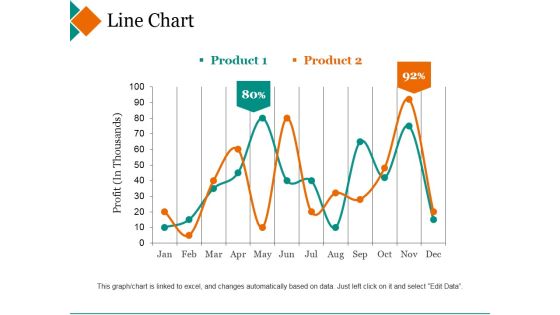
Line Chart Ppt PowerPoint Presentation Inspiration Deck
This is a line chart ppt powerpoint presentation inspiration deck. This is a two stage process. The stages in this process are product, profit, percentage, finance, line graph.

Channel Kpis Ppt PowerPoint Presentation Inspiration Aids
This is a channel kpis ppt powerpoint presentation inspiration aids. This is a four stage process. The stages in this process are business, marketing, graph, percentage, finance.

Channel Kpis Ppt PowerPoint Presentation Model Smartart
This is a channel kpis ppt powerpoint presentation model smartart. This is a four stage process. The stages in this process are business, marketing, finance, years, percentage.

Area Chart Ppt PowerPoint Presentation Gallery Information
This is a area chart ppt powerpoint presentation gallery information. This is a two stage process. The stages in this process are product, area chart, business, finance, marketing.

Radar Chart Ppt PowerPoint Presentation Inspiration Rules
This is a radar chart ppt powerpoint presentation inspiration rules. This is a two stage process. The stages in this process are radar chart, business, marketing, finance, management.

Comparison Ppt PowerPoint Presentation Infographics Rules
This is a comparison ppt powerpoint presentation infographics rules. This is a two stage process. The stages in this process are male, female, comparison, percentage, finance.

Filled Rader Ppt PowerPoint Presentation Pictures Format
This is a filled rader ppt powerpoint presentation pictures format. This is a two stage process. The stages in this process are product, radar, finance, business, management.

Radar Chart Ppt PowerPoint Presentation Background Designs
This is a radar chart ppt powerpoint presentation background designs. This is a two stage process. The stages in this process are radar chart, product, finance, business, shapes.

Radar Chart Ppt PowerPoint Presentation Infographics Portfolio
This is a radar chart ppt powerpoint presentation infographics portfolio. This is a two stage process. The stages in this process are product, finance, shapes, business, marketing.

Radar Chart Ppt PowerPoint Presentation Ideas Portrait
This is a radar chart ppt powerpoint presentation ideas portrait. This is a two stage process. The stages in this process are product, radar chart, finance, business, marketing.

Radar Chart Ppt PowerPoint Presentation Pictures Themes
This is a radar chart ppt powerpoint presentation pictures themes. This is a two stage process. The stages in this process are product, radar chart, finance, business.
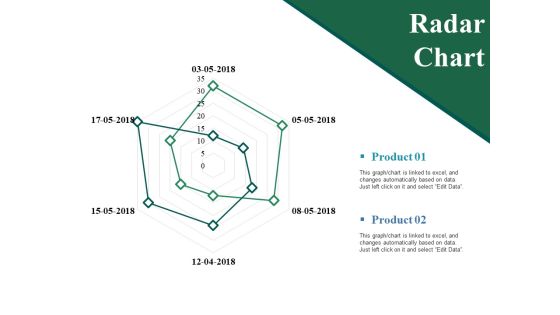
Radar Chart Ppt PowerPoint Presentation Show Guidelines
This is a radar chart ppt powerpoint presentation show guidelines. This is a two stage process. The stages in this process are product, radar chart, business, finance, marketing.
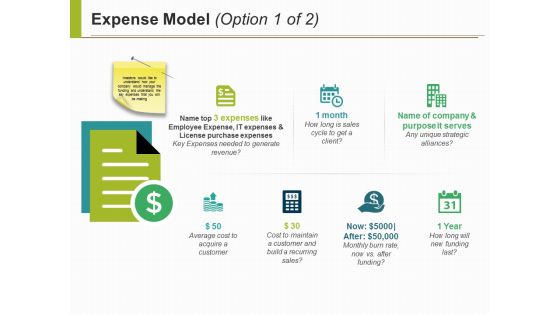
Expense Model Ppt PowerPoint Presentation Slides Ideas
This is a expense model ppt powerpoint presentation slides ideas. This is a seven stage process. The stages in this process are icons, marketing, strategy, finance, planning.

Radar Chart Ppt PowerPoint Presentation Styles Themes
This is a radar chart ppt powerpoint presentation styles themes. This is a two stage process. The stages in this process are product, finance, shape, radar chart, business.
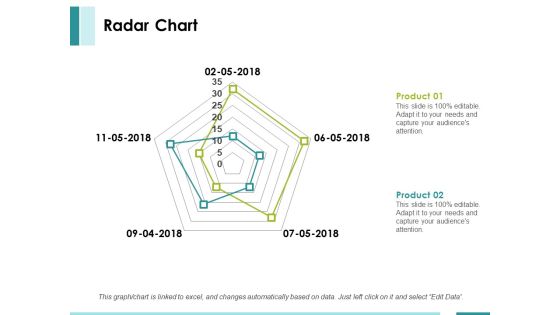
Radar Chart Ppt PowerPoint Presentation Summary Layout
This is a radar chart ppt powerpoint presentation summary layout. This is a two stage process. The stages in this process are product, finance, shape, radar chart, business.

Radar Chart Ppt PowerPoint Presentation File Rules
This is a radar chart ppt powerpoint presentation file rules. This is a two stage process. The stages in this process are product, radar chart, finance.

Template 2 Ppt PowerPoint Presentation Model Themes
This is a template 2 ppt powerpoint presentation model themes. This is a six stage process. The stages in this process are business, finance, marketing, icons, strategy.

Template 4 Ppt PowerPoint Presentation Infographic Template Images
This is a template 4 ppt powerpoint presentation infographic template images. This is a four stage process. The stages in this process are business, finance, marketing, icons, strategy.

Clustered Bar Ppt PowerPoint Presentation Summary Ideas
This is a clustered bar ppt powerpoint presentation summary ideas. This is a eight stage process. The stages in this process are clustered bar, finance, marketing, business, strategy.
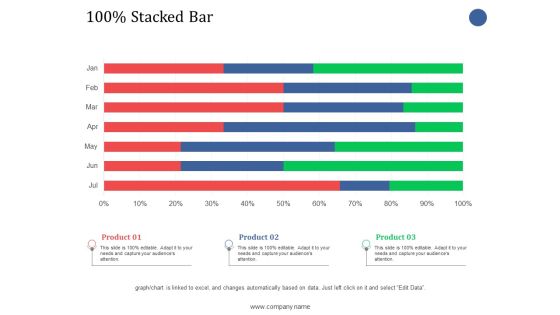
Stacked Bar Ppt PowerPoint Presentation Infographic Template Graphics
This is a stacked bar ppt powerpoint presentation infographic template graphics. This is a three stage process. The stages in this process are stacked bar, finance, product, business.

Stacked Bar Ppt PowerPoint Presentation Visual Aids Pictures
This is a stacked bar ppt powerpoint presentation visual aids pictures. This is a two stage process. The stages in this process are product, percentage, finance, business, marketing.

Break Point Chart For Quality Analysis Powerpoint Slide Show
This is a break point chart for quality analysis powerpoint slide show. This is a one stage process. The stages in this process are total variable costs, fixed costs, quality sold.
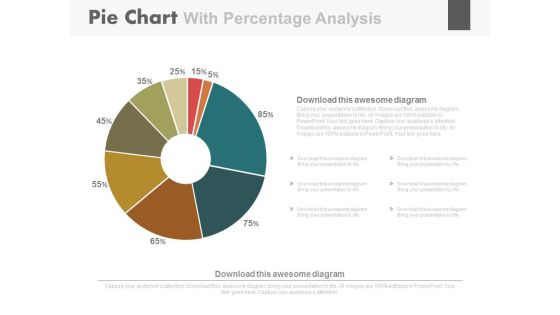
Pie Chart For Strategic Sales Plan Powerpoint Slides
This PowerPoint template has been designed with diagram of pie chart. This PPT slide can be used to prepare presentations on strategic sales plan. You can download finance PowerPoint template to prepare awesome presentations.
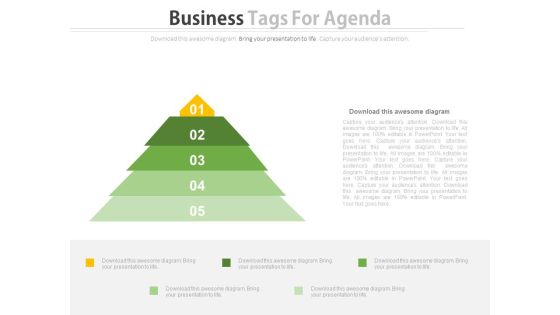
Triangle Of Five Business Steps Powerpoint Slides
This PowerPoint template has been designed with five steps triangle diagram. This PPT slide can be used to display five points of marketing agenda. You can download finance PowerPoint template to prepare awesome presentations.

Adjusted Roce Template 1 Ppt PowerPoint Presentation Styles Background Designs
This is a adjusted roce template 1 ppt powerpoint presentation styles background designs. This is a seven stage process. The stages in this process are bar graph, finance, year, business, marketing.

Volume High Low Close Chart Ppt PowerPoint Presentation Gallery Shapes
This is a volume high low close chart ppt powerpoint presentation gallery shapes. This is a five stage process. The stages in this process are high, volume, low, close, finance.

Clustered Column Line Ppt PowerPoint Presentation Slide
This is a clustered column line ppt powerpoint presentation slide. This is a three stage process. The stages in this process are bar graph, growth, finance, product, sales in percentage.

Clustered Column Line Ppt PowerPoint Presentation Inspiration Guidelines
This is a clustered column line ppt powerpoint presentation inspiration guidelines. This is a three stage process. The stages in this process are product, sales in percentage, graph, line, finance, business.
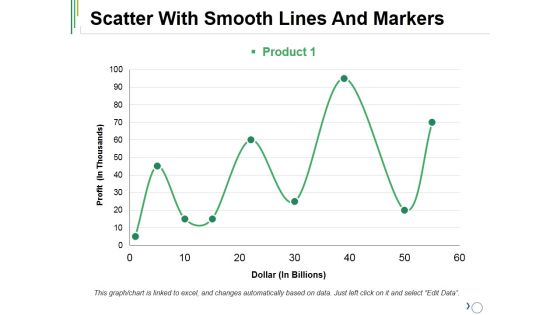
Scatter With Smooth Lines And Markers Ppt PowerPoint Presentation Outline Mockup
This is a scatter with smooth lines and markers ppt powerpoint presentation outline mockup. This is a one stage process. The stages in this process are product, finance, line graph, business, management.
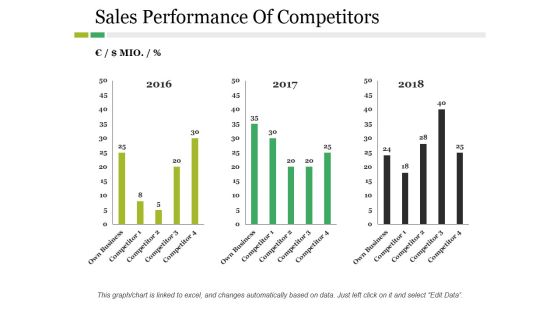
Sales Performance Of Competitors Ppt PowerPoint Presentation Inspiration Example
This is a sales performance of competitors ppt powerpoint presentation inspiration example. This is a three stage process. The stages in this process are business, marketing, year, bar graph, finance.

Competitors Average Price Product Ppt PowerPoint Presentation Icon Layout
This is a competitors average price product ppt powerpoint presentation icon layout. This is a five stage process. The stages in this process are company, bar graph, finance, business, marketing.

Radar Chart Ppt PowerPoint Presentation Inspiration Infographic Template
This is a radar chart ppt powerpoint presentation inspiration infographic template. This is a two stage process. The stages in this process are radar chart, product, business, finance, marketing.
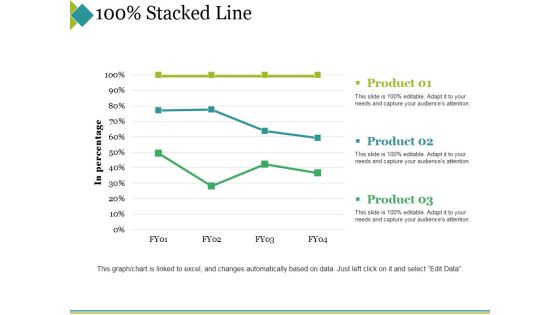
Stacked Line Ppt PowerPoint Presentation Professional Background Designs
This is a stacked line ppt powerpoint presentation professional background designs. This is a three stage process. The stages in this process are product, in percentage, stacked line, finance, business.

Radar Chart Ppt PowerPoint Presentation Infographics Visual Aids
This is a radar chart ppt powerpoint presentation infographics visual aids. This is a two stage process. The stages in this process are radar chart, product, finance, business, marketing.

Radar Chart Ppt PowerPoint Presentation Portfolio Graphics Template
This is a radar chart ppt powerpoint presentation portfolio graphics template. This is a two stage process. The stages in this process are product, finance, shape, radar chart, business.

Radar Chart Ppt PowerPoint Presentation Professional Infographic Template
This is a radar chart ppt powerpoint presentation professional infographic template. This is a two stage process. The stages in this process are product, finance, shape, radar chart, business.

Open High Low Close Chart Ppt PowerPoint Presentation Professional Inspiration
This is a open high low close chart ppt powerpoint presentation professional inspiration. This is a five stage process. The stages in this process are high, low, close, business, finance.

Donut Pie Chart Ppt PowerPoint Presentation Show Graphics Download
This is a donut pie chart ppt powerpoint presentation show graphics download. This is a three stage process. The stages in this process are percentage, finance, donut, business, marketing.

Circular Steps For Market Entry Strategy Powerpoint Slides
This PowerPoint template contains graphics of circular steps. You may download this PPT slide design to display market entry strategy. You can easily customize this template to make it more unique as per your need.

Circle Chart For Value Analysis Powerpoint Slides
This PowerPoint template has been designed for business presentations and corporate slides. The PowerPoint template has a high quality design. You can download this PowerPoint slide for corporate presentations or annual meeting and business plans.

Target Chart For Strategic Management Process Powerpoint Slides
This PowerPoint template has been designed with four steps target chart. The PowerPoint template may be used to display strategic management process. You can download this PowerPoint slide for corporate presentations or annual meeting and business plans.

Bar Graph For Year Based Analysis Powerpoint Slides
This PowerPoint template has been designed with year based bar graph. This diagram may be used to display yearly statistical analysis. Use this PPT slide design to make impressive presentations.

Business Steps Diagram With Icons Powerpoint Slides
Visually support your presentation with our above template containing graphics of stairs diagram. It helps to portray directions of business actions. Etch your views in the brains of your audience with this diagram slide.
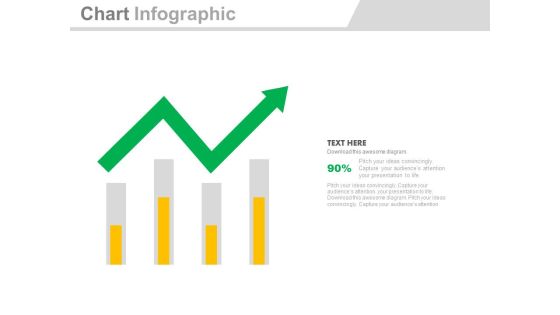
Four Bars With Green Growth Arrow Powerpoint Slides
Four bars with green arrow have been displayed in this business slide. This business diagram helps to exhibit process of business planning. Use this diagram to build an exclusive presentation.

Four Circles With Percentage Data Display Powerpoint Slides
This PowerPoint template has been designed with graphics of four circles. Download this PPT slide to display percentage data display. Use this professional template to build an exclusive presentation.
Four Colored Text Boxes With Icons Powerpoint Slides
This PowerPoint template has been designed with graphics of four text boxes. Download this PPT slide to display percentage data display. Use this professional template to build an exclusive presentation.
Four Linear Steps And Icons Powerpoint Slides
This PPT slide has been designed with four linear text boxes with icons. This PowerPoint template helps to exhibit process of business planning. Use this diagram slide to build an exclusive presentation.

Four Steps For Organizational Learning Methods Powerpoint Slides
Four text boxes have been displayed in this business slide. This PowerPoint template helps to exhibit organizational learning methods. Use this diagram slide to build an exclusive presentation.

Infographic Diagram For Business Process Analysis Powerpoint Slides
This PowerPoint slide contains business infographic diagram. This professional slide may be used to display business process analysis. Use this business template to make impressive presentations.
Mountain Chart With Social Media Icons Powerpoint Slides
The above PPT template displays mountain chart with social media icons. This PowerPoint template has been designed to exhibit users of social media. Download this PPT slide to attract the attention of your audience.
Process Flow Diagram With Business Icons Powerpoint Slides
Emphatically define your message with our above infographic template. This PowerPoint template may be used to display business process flow. Grab the attention of your listeners with this slide.
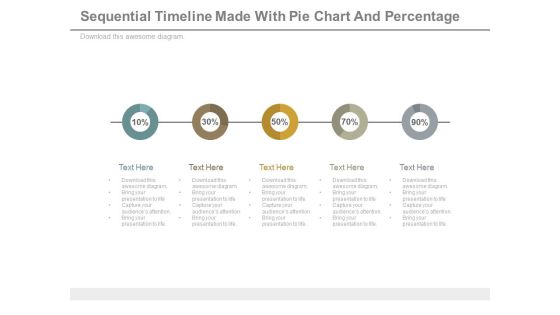
Sequential Timeline Diagram With Percentage Values Powerpoint Slides
This diagram contains graphics of linear circles timeline diagram. Download this diagram slide to display business planning and management. This diagram is editable you can edit text, color, shade and style as per you need.
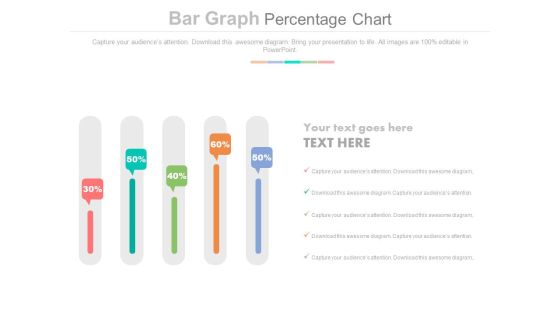
Sliders Percentage Data Chart Powerpoint Slides
This PowerPoint slide has been designed with slider chart and percentage data. This PPT diagram may be used to display business trends. This diagram slide can be used to make impressive presentations.
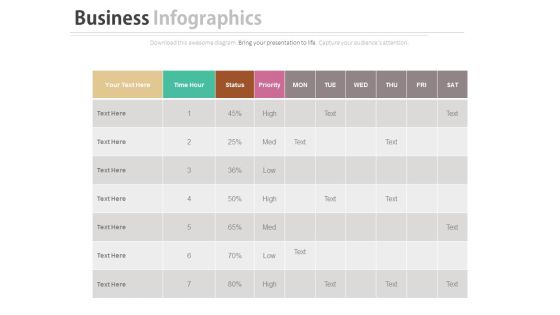
Work Sheet For Daily Activity Plan Schedule Powerpoint Slides
Our above business slide contains graphics of daily worksheet. This PowerPoint slide may be used to exhibit activity plan and schedule. Capture the attention of your audience with this slide.
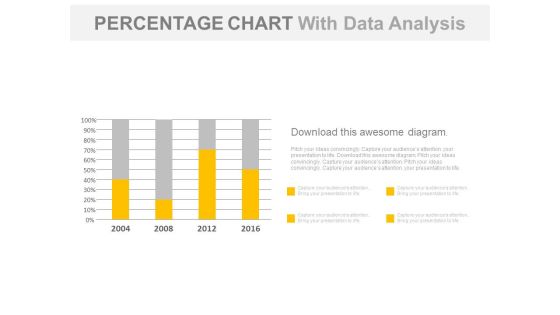
Year Based Chart With Percentage Data Analysis Powerpoint Slides
Our above business slide contains year based statistical chart. This PowerPoint template can be used to display percentage data analysis. Capture the attention of your audience with this slide.

Bar Graph For Profit Growth Analysis Powerpoint Slides
This PowerPoint template has been designed with bar graph with percentage values. This diagram is useful to exhibit profit growth analysis. This diagram slide can be used to make impressive presentations.

Bar Graph For Yearly Statistical Analysis Powerpoint Slides
This PowerPoint template has been designed with bar graph. This PowerPoint diagram is useful to exhibit yearly statistical analysis. This diagram slide can be used to make impressive presentations.

Circular Diagram For Percentage Analysis Powerpoint Slides
This PowerPoint slide has been designed with circular diagram with social media icons. This diagram slide may be used to display users of social media. Prove the viability of your ideas with this professional slide.

Data Driven Comparison Charts For Analysis Powerpoint Slides
You can download this PowerPoint template to display statistical data and analysis. This PPT slide contains data driven comparison charts. Draw an innovative business idea using this professional diagram.
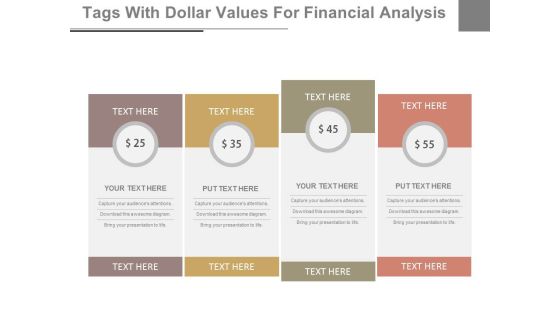
Dollar Value Pricing Table Powerpoint Slides
This PowerPoint template has been designed with dollar value pricing table chart. This PPT slide may be used for sample marketing proposal. Download this slide to build unique presentation.
