AI PPT Maker
Templates
PPT Bundles
Design Services
Business PPTs
Business Plan
Management
Strategy
Introduction PPT
Roadmap
Self Introduction
Timelines
Process
Marketing
Agenda
Technology
Medical
Startup Business Plan
Cyber Security
Dashboards
SWOT
Proposals
Education
Pitch Deck
Digital Marketing
KPIs
Project Management
Product Management
Artificial Intelligence
Target Market
Communication
Supply Chain
Google Slides
Research Services
 One Pagers
All Categories
-
Home
- Customer Favorites
- Financial Budget
Financial Budget

Bar Chart Ppt PowerPoint Presentation Outline Introduction
This is a bar chart ppt powerpoint presentation outline introduction. This is a one stage process. The stages in this process are sales in percentage, product, business, financial years, graph.

Clustered Column Ppt PowerPoint Presentation Ideas Graphic Tips
This is a clustered column ppt powerpoint presentation ideas graphic tips. This is a two stage process. The stages in this process are financial year, sales in percentage, product, graph, business.

Bar Chart Ppt PowerPoint Presentation Professional Graphics Download
This is a bar chart ppt powerpoint presentation professional graphics download. This is a seven stage process. The stages in this process are sales in percentage, financial years, chart, business.

Bar Chart Ppt PowerPoint Presentation Styles Outfit
This is a bar chart ppt powerpoint presentation styles outfit. This is a Seven stage process. The stages in this process are sales in percentage, financial years, graph, business.

Clustered Column Ppt PowerPoint Presentation Pictures Mockup
This is a clustered column ppt powerpoint presentation pictures mockup. This is a two stage process. The stages in this process are product, sales in percentage, financial year, graph, business.
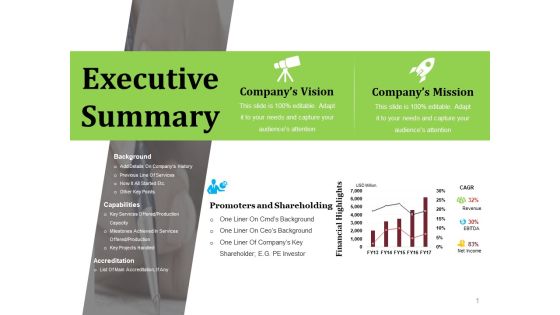
Executive Summary Ppt PowerPoint Presentation Ideas Professional
This is a executive summary ppt powerpoint presentation ideas professional. This is a two stage process. The stages in this process are company s vision, company s mission, promoters and shareholding, financial highlights.

Clustered Column Ppt PowerPoint Presentation File Slide
This is a clustered column ppt powerpoint presentation file slide. This is a two stage process. The stages in this process are product, financial year, sales in percentage, bar graph.

Executive Summary Ppt PowerPoint Presentation Professional Example
This is a executive summary ppt powerpoint presentation professional example. This is a four stage process. The stages in this process are background, capabilities, accreditation, promoters and shareholding, financial highlights.

Area Chart Ppt PowerPoint Presentation Layouts Maker
This is a area chart ppt powerpoint presentation layouts maker. This is a two stage process. The stages in this process are financial year, sales in percentage, graph, business, marketing.

Clustered Column Ppt PowerPoint Presentation Slides Smartart
This is a clustered column ppt powerpoint presentation slides smartart. This is a two stage process. The stages in this process are product, sales in percentage, financial year, bar graph.

Clustered Column Ppt PowerPoint Presentation File Graphics
This is a clustered column ppt powerpoint presentation file graphics. This is a two stage process. The stages in this process are product, financial year, sales in percentage, graph, growth.

area chart ppt powerpoint presentation professional elements
This is a area chart ppt powerpoint presentation professional elements. This is a two stage process. The stages in this process are financial year sales in percentage, business, marketing, graph.

Bar Chart Ppt PowerPoint Presentation File Slide
This is a bar chart ppt powerpoint presentation file slide. This is a one stage process. The stages in this process are sales in percentage financial years, business, marketing, strategy, graph.

Clustered Column Ppt PowerPoint Presentation Show Graphics
This is a clustered column ppt powerpoint presentation show graphics. This is a two stage process. The stages in this process are financial year, sales in percentage, business, marketing, graph.

Bar Chart Ppt PowerPoint Presentation Diagram Lists
This is a bar chart ppt powerpoint presentation diagram lists. This is a two stage process. The stages in this process are business, marketing, financial years, sales in percentage, graph.

Bar Chart Ppt PowerPoint Presentation Visual Aids Diagrams
This is a bar chart ppt powerpoint presentation visual aids diagrams. This is a two stage process. The stages in this process are business, marketing, financial years, sales in percentage, graph.

Clustered Column Ppt PowerPoint Presentation Gallery Format
This is a clustered column ppt powerpoint presentation gallery format. This is a two stage process. The stages in this process are business, marketing, graph, financial year, sales in percentage.
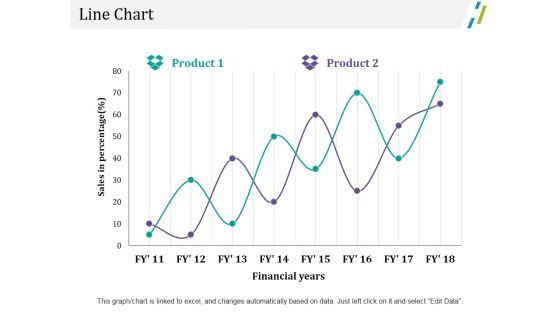
Line Chart Ppt PowerPoint Presentation Outline File Formats
This is a line chart ppt powerpoint presentation outline file formats. This is a two stage process. The stages in this process are business, marketing, sales in percentage, financial years, chart.

Line Chart Ppt PowerPoint Presentation Outline Ideas
This is a line chart ppt powerpoint presentation outline ideas. This is a two stage process. The stages in this process are business, marketing, financial years, sales in percentage, strategy.

Column Chart Ppt PowerPoint Presentation Infographic Template Icon
This is a column chart ppt powerpoint presentation infographic template icon. This is a two stage process. The stages in this process are business, marketing, sales in percentage, financial year, graph.

Column Chart Ppt PowerPoint Presentation Show Structure
This is a column chart ppt powerpoint presentation show structure. This is a two stage process. The stages in this process are business, financial year in, sales in percentage, marketing, graph.

Area Chart Ppt PowerPoint Presentation Icon Aids
This is a area chart ppt powerpoint presentation icon aids. This is a three stage process. The stages in this process are financial years, sales in percentage, business, marketing, graph.

Bar Chart Ppt PowerPoint Presentation Summary Themes
This is a bar chart ppt powerpoint presentation summary themes. This is a three stage process. The stages in this process are financial years, sales in percentage, business, marketing, graph.

Area Chart Ppt PowerPoint Presentation Model Demonstration
This is a area chart ppt powerpoint presentation model demonstration. This is a two stage process. The stages in this process are business, marketing, financial year, in percentage, graph.

Bar Graph Ppt PowerPoint Presentation Infographics Icon
This is a bar graph ppt powerpoint presentation infographics icon. This is a two stage process. The stages in this process are business, marketing, financial year, in percentage, graph.

Combo Chart Ppt PowerPoint Presentation Summary Background Images
This is a combo chart ppt powerpoint presentation summary background images. This is a two stage process. The stages in this process are business, marketing, financial year, in percentage, graph.

Clustered Column Ppt PowerPoint Presentation Infographic Template Backgrounds
This is a clustered column ppt powerpoint presentation infographic template backgrounds. This is a two stage process. The stages in this process are sales in percentage, financial year, product.

Area Chart Ppt PowerPoint Presentation Model Inspiration
This is a area chart ppt powerpoint presentation model inspiration. This is a two stage process. The stages in this process are financial year, in percentage, area chart, business, marketing.

Combo Chart Ppt PowerPoint Presentation Model Vector
This is a combo chart ppt powerpoint presentation model vector. This is a two stage process. The stages in this process are financial year, in percentage, business, marketing, combo chart.
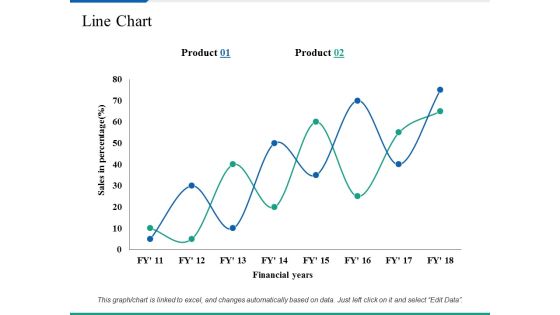
Line Chart Ppt PowerPoint Presentation Summary Clipart Images
This is a line chart ppt powerpoint presentation summary clipart images. This is a two stage process. The stages in this process are business, marketing, sales in percentage, financial years, strategy.
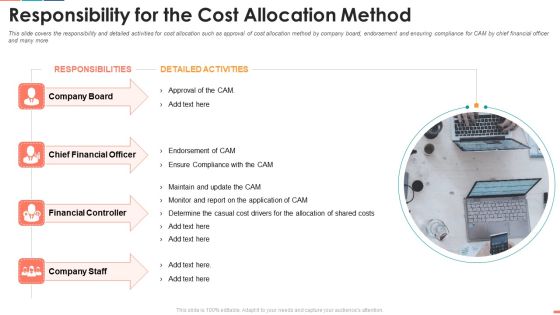
Summarize Techniques For Organization Cost Allocation Responsibility For The Cost Guidelines PDF
Presenting summarize techniques for organization cost allocation responsibility for the cost guidelines pdf to provide visual cues and insights. Share and navigate important information on four stages that need your due attention. This template can be used to pitch topics like chief financial officer, company board, financial controller, company staff. In addtion, this PPT design contains high resolution images, graphics, etc, that are easily editable and available for immediate download.

Semicircle With Five Circles Of Percentage Values Powerpoint Template
This PowerPoint template has been designed with graphics of semicircle with five percentage values. This business design can be used for financial ratio analysis. Capture the attention of your audience with this slide.

Balloons Steps With Percentage Growth Values Powerpoint Slides
This PowerPoint template contains graphics of balloons steps with percentage growth values. You may download this slide to display strategy steps for financial growth. You can easily customize this template to make it more unique as per your need.
Five Steps Diamond Infographic Diagram Powerpoint Slides
This PowerPoint template has been designed with alphabet steps with icons. This PPT slide may be used to display financial strategy analysis. Make outstanding business presentation with this template.

Strategic Planning Government Example Powerpoint Slides
This is a strategic planning government example powerpoint slides. This is a five stage process. The stages in this process are regularity compliance, business continuity, financial performance, risk management, operational improvement.

Quarterly Revenue And Loss Statement Comparison Dashboard Portrait PDF
This slide showcases a comprehensive P and L report for representing the financial outcomes. It also helps to take financial performance management decisions. It includes financial analysis KPIs such as p and l statements, p and l structure dynamics, sales or margin quality performance analysis, DUPONT ratio, etc. Showcasing this set of slides titled Quarterly Revenue And Loss Statement Comparison Dashboard Portrait PDF. The topics addressed in these templates are Profitability, Debt Coverage Ratios, Margin Quality Performa. All the content presented in this PPT design is completely editable. Download it and make adjustments in color, background, font etc. as per your unique business setting.

Circles With Percentage Values Powerpoint Templates
This PowerPoint template displays circles with percentage values. This business diagram is suitable for financial data analysis. Use this business diagram slide to highlight the key issues of your presentation.

Clustered Column Ppt PowerPoint Presentation Icon Design Inspiration
This is a clustered column ppt powerpoint presentation icon design inspiration. This is a two stage process. The stages in this process are product, financial year, sales in percentage, clustered column.

Bar Chart Ppt PowerPoint Presentation Professional Files
This is a bar chart ppt powerpoint presentation professional files. This is a seven stage process. The stages in this process are bar chart, product, sales in percentage, financial years.
Line Chart Ppt PowerPoint Presentation Infographic Template Introduction
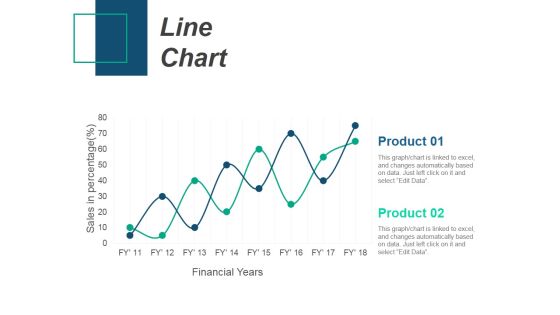
This is a line chart ppt powerpoint presentation infographic template introduction. This is a two stage process. The stages in this process are product, sales in percentage, financial years, line chart.
Line Chart Ppt PowerPoint Presentation Infographic Template Icons
This is a line chart ppt powerpoint presentation infographic template icons. This is a two stage process. The stages in this process are sales in percentage, financial years, product, line chart.

Clustered Column Line Ppt PowerPoint Presentation Model Rules
This is a clustered column line ppt powerpoint presentation model rules. This is a four stage process. The stages in this process are financial year, sales in percentage, business, marketing, growth, graph.
Essential Components Of Three Step Dupont Analysis Model Diagrams PDF
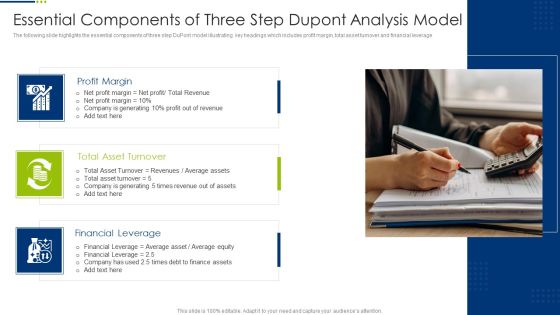
The following slide highlights the essential components of three step DuPont model illustrating key headings which includes profit margin, total asset turnover and financial leverage. Presenting Essential Components Of Three Step Dupont Analysis Model Diagrams PDF to dispense important information. This template comprises three stages. It also presents valuable insights into the topics including Profit Margin, Total Asset Turnover, Financial Leverage. This is a completely customizable PowerPoint theme that can be put to use immediately. So, download it and address the topic impactfully.
Why Use Integrated Marketing Communication Approach For Business Organization Elements PDF
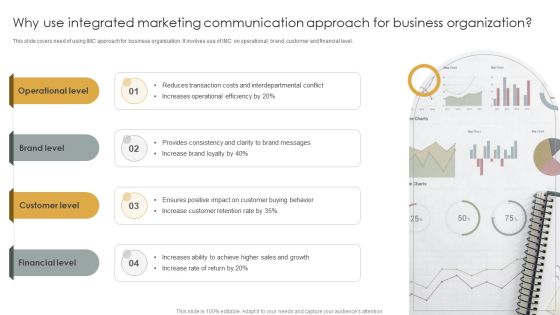
This slide covers need of using IMC approach for business organization. It involves use of IMC on operational, brand, customer and financial level. Presenting Why Use Integrated Marketing Communication Approach For Business Organization Elements PDF to dispense important information. This template comprises four stages. It also presents valuable insights into the topics including Operational Level, Brand Level, Customer Level, Financial Level. This is a completely customizable PowerPoint theme that can be put to use immediately. So, download it and address the topic impactfully.

3d Happy Man With Money PowerPoint Templates
Explain the concept of financial growth strategy and its requirement for success with this unique image. This contains the graphic of 3d man with money. This diagram slide is well designed for finance presentations to give better explanation of growth.

Column Chart Ppt PowerPoint Presentation Layouts Design Inspiration
This is a column chart ppt powerpoint presentation layouts design inspiration. This is a two stage process. The stages in this process are sales in percentage, financial year in, graph, business, finance, marketing.
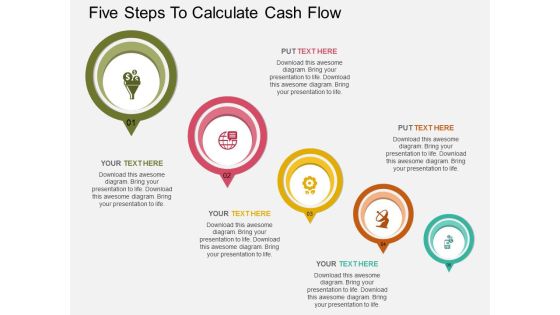
Five Steps To Calculate Cash Flow Powerpoint Template
This PPT slide has been designed with circles and financial icons. This template is designed to display finance and investment related topics. This professional slide helps in making an instant impact on viewers.

Blockchain Business Methodology Benefits To Empower Banking Business Ideas PDF
This slide covers the details related to the benefits of blockchain technology to the financial sector. The purpose of this template is to define different factors that are considered important in the financial services industry. It includes information related to raising funds, clearance system, etc. Showcasing this set of slides titled Blockchain Business Methodology Benefits To Empower Banking Business Ideas PDF. The topics addressed in these templates are Financial Services, Blockchain Benefits, Outcomes. All the content presented in this PPT design is completely editable. Download it and make adjustments in color, background, font etc. as per your unique business setting.

Business Planning And Strategy Playbook Company Overview Contd Ppt PowerPoint Presentation Infographic Template Rules PDF
The purpose of this slide is to provide glimpse about the key promoters and the financial highlights of the firm as an financial overview of firms performance. Deliver and pitch your topic in the best possible manner with this business planning and strategy playbook company overview contd ppt powerpoint presentation infographic template rules pdf. Use them to share invaluable insights on revenue, ebitda, net income, financial highlights and impress your audience. This template can be altered and modified as per your expectations. So, grab it now.
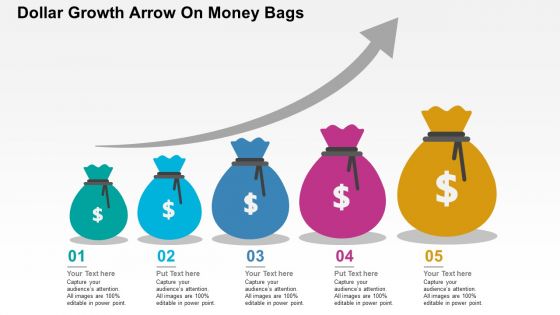
Dollar Growth Arrow On Money Bags PowerPoint Templates
This business slide has been designed with dollar growth arrow on money bags. You may download this business slide to display financial plans. You can easily customize this template to make it more unique as per your need.
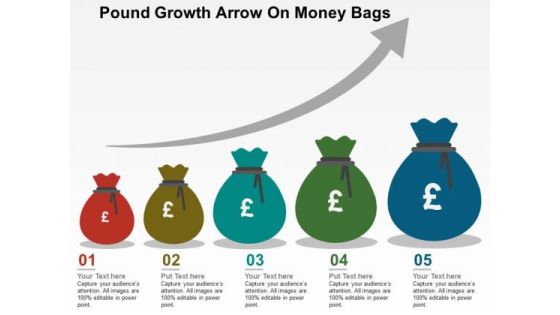
Pound Growth Arrow On Money Bags PowerPoint Templates
This business slide has been designed with Pound growth arrow on money bags. You may download this business slide to display financial plans. You can easily customize this template to make it more unique as per your need.

Rupee Growth Arrow On Money Bags PowerPoint Templates
This business slide has been designed with Rupee growth arrow on money bags. You may download this business slide to display financial plans. You can easily customize this template to make it more unique as per your need.

Yen Growth Arrow On Money Bags PowerPoint Templates
This business slide has been designed with Yen growth arrow on money bags. You may download this business slide to display financial plans. You can easily customize this template to make it more unique as per your need.

Man With Money Bags Pros And Cons Layout Powerpoint Templates
Create dynamic presentations with our professional template containing graphics of man with money bag in hands. This diagram is useful to display pros and cons of financial plan. Download this template to leave permanent impression on your audience.

Banking Solutions Company Overview Organization Structure Diagrams PDF
The slide highlights the company organization structure of financial bank. It showcases board of directors, audit committee of board, managing director, chief executive officer, assets laundering prevention committee, risk management committee, chief financial officer, HR director, etc. This is a Banking Solutions Company Overview Organization Structure Diagrams PDF template with various stages. Focus and dispense information on three stages using this creative set, that comes with editable features. It contains large content boxes to add your information on topics like Chief Financial Officer, Chief Executive Officer, Risk. You can also showcase facts, figures, and other relevant content using this PPT layout. Grab it now.

Human Resource Planning For Medical Care Organization Microsoft PDF
This slide covers the details related to different departments and posts offered in a healthcare organization. The purpose of this template is to define the administration specialist appointed in medical industry. It covers information about financial management, human resource, etc. Showcasing this set of slides titled Human Resource Planning For Medical Care Organization Microsoft PDF. The topics addressed in these templates are Financial Management, Human Resource, Financial. All the content presented in this PPT design is completely editable. Download it and make adjustments in color, background, font etc. as per your unique business setting.

Cost Distribution Accounting Techniques Responsibility For The Cost Allocation Method Mockup PDF
This slide covers the responsibility and detailed activities for cost allocation such as approval of cost allocation method by company board, endorsement and ensuring compliance for CAM by chief financial officer and many more. This is a Cost Distribution Accounting Techniques Responsibility For The Cost Allocation Method Mockup PDF template with various stages. Focus and dispense information on four stages using this creative set, that comes with editable features. It contains large content boxes to add your information on topics like Chief Financial Officer, Financial Controller, Company Staff. You can also showcase facts, figures, and other relevant content using this PPT layout. Grab it now.
Finance Department Employee Performance Assessment Survey Icons PDF
This slide depicts the comparative assessment of multiple employees in the financial department for developing better skills through appropriate training programs. The various skills include financial statement preparation, book keeping, taxation, and so on along with average score. Pitch your topic with ease and precision using this Finance Department Employee Performance Assessment Survey Icons PDF. This layout presents information on Taxation, Business Law, Financial Statement Preparation. It is also available for immediate download and adjustment. So, changes can be made in the color, design, graphics or any other component to create a unique layout.

Working Areas Of Telecom Cost Management Portrait PDF
This slide shows areas to deploy telecom expense management initiative that ensure financial and operational efficiency in business. It includes various disciplines such as design, optimization, inventory, financial , security management etc. Persuade your audience using this Working Areas Of Telecom Cost Management Portrait PDF. This PPT design covers five stages, thus making it a great tool to use. It also caters to a variety of topics including Security Management, Contract Management, Financial Management. Download this PPT design now to present a convincing pitch that not only emphasizes the topic but also showcases your presentation skills.

Accounting Operations Training Department Program Completion Status Report Rules PDF
This slide covers training status report for business financial operations. It includes training for accounts and financial statements, operational ratios and forecasting, invoice processing, etc. along with all assignments completion status. Showcasing this set of slides titled Accounting Operations Training Department Program Completion Status Report Rules PDF. The topics addressed in these templates are Accounts And Financial, Operational Ratios, Invoice Processing. All the content presented in this PPT design is completely editable. Download it and make adjustments in color, background, font etc. as per your unique business setting.
