AI PPT Maker
Templates
PPT Bundles
Design Services
Business PPTs
Business Plan
Management
Strategy
Introduction PPT
Roadmap
Self Introduction
Timelines
Process
Marketing
Agenda
Technology
Medical
Startup Business Plan
Cyber Security
Dashboards
SWOT
Proposals
Education
Pitch Deck
Digital Marketing
KPIs
Project Management
Product Management
Artificial Intelligence
Target Market
Communication
Supply Chain
Google Slides
Research Services
 One Pagers
All Categories
-
Home
- Customer Favorites
- Financial Budget
Financial Budget

Business Diagram Colored Column Chart For Result Analysis PowerPoint Slide
This Power Point diagram has been designed with graphic of column chart. It contains diagram of bar char depicting annual business progress report. Use this diagram to build professional presentations for your viewers.
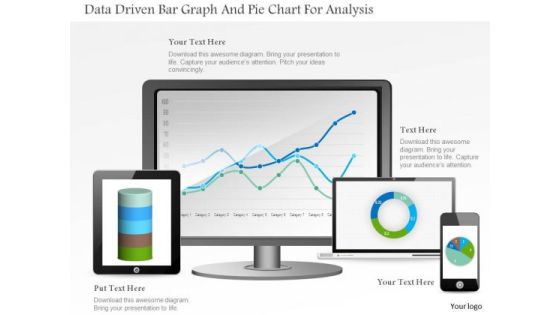
Business Diagram Data Driven Bar Graph And Pie Chart For Analysis PowerPoint Slide
This PowerPoint template displays technology gadgets with various business charts. Use this diagram slide, in your presentations to make business reports for statistical analysis. You may use this diagram to impart professional appearance to your presentations.

Business Diagram Data Driven Pie Chart Inside The Magnifier PowerPoint Slide
This business slide displays 3d colorful pie graph with magnifier. This diagram is a data visualization tool that gives you a simple way to present statistical information. This slide helps your audience examine and interpret the data you present.
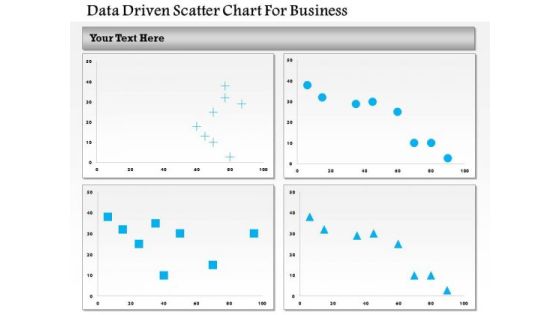
Business Diagram Data Driven Scatter Chart For Business PowerPoint Slide
This business diagram has been designed with four comparative charts. This slide suitable for data representation. You can also use this slide to present business analysis and reports. Use this diagram to present your views in a wonderful manner.
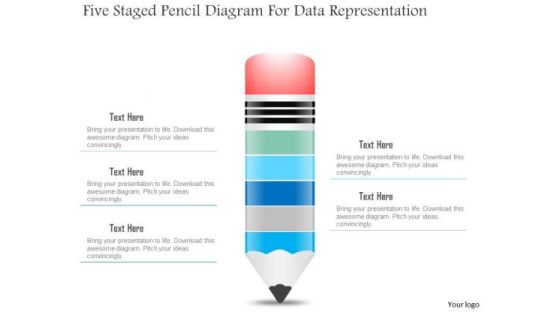
Business Diagram Five Staged Pencil Diagram For Data Representation PowerPoint Slide
This business slide displays five staged pencil diagram. It contains pencil graphic divided into five parts. This diagram slide depicts processes, stages, steps, points, options and education information display. Use this diagram, in your presentations to express your views innovatively.

Business Diagram Five Staged Timeline Diagram For Business PowerPoint Slide
This PowerPoint template displays five points timeline diagram. This business diagram has been designed with graphic of timeline with five points, text space and start, end points. Use this diagram, in your presentations to display process steps, stages, timelines and business management. Make wonderful presentations using this business slide.
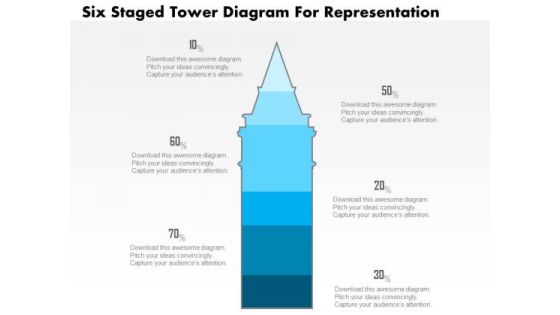
Business Diagram Five Staged Tower Diagram For Representation PowerPoint Slide
This business slide displays five staged tower diagram. It contains blue tower graphic divided into five parts. This diagram slide depicts processes, stages, steps, points, options information display. Use this diagram, in your presentations to express your views innovatively.
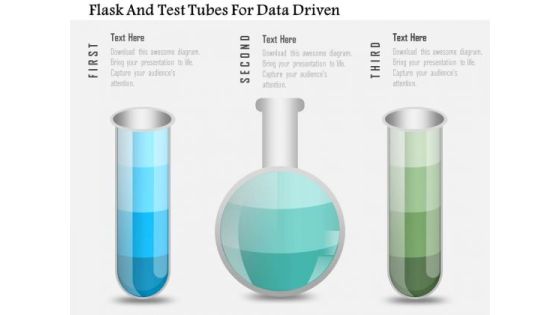
Business Diagram Flask And Test Tubes For Data Driven PowerPoint Slide
This data driven diagram has been designed with flask and test tubes. Download this diagram to give your presentations more effective look. It helps in clearly conveying your message to clients and audience.

Business Diagram Flask With Data Driven Chart PowerPoint Slide
This data driven diagram has been designed with flask graphics. Download this diagram to give your presentations more effective look. It helps in clearly conveying your message to clients and audience.
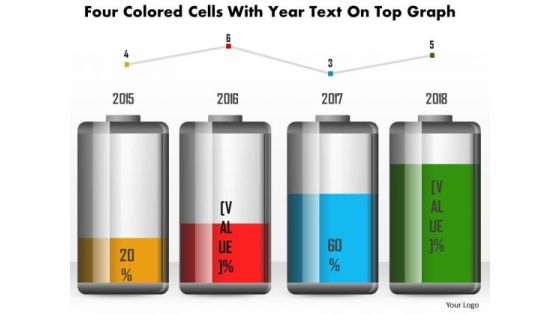
Business Diagram Four Colored Cells With Year Text On Top Graph PowerPoint Slide
This business diagram has been designed with battery cell graphic for business timeline. This slide can be used for business planning and management. Use this diagram for your business and success milestones related presentations.
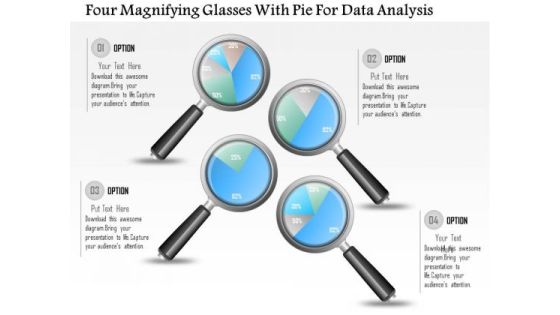
Business Diagram Four Magnifying Glasses With Pie For Data Analysis PowerPoint Slide
This business diagram displays graphic of pie charts in shape of magnifying glasses This business slide is suitable to present and compare business data. Use this diagram to build professional presentations for your viewers.
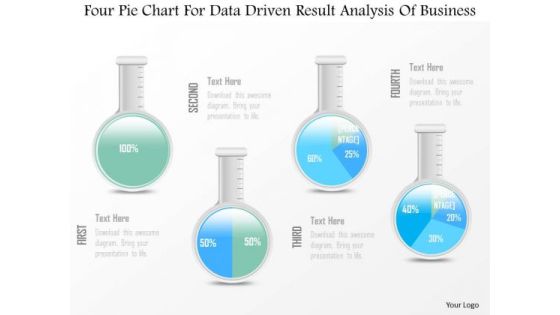
Business Diagram Four Pie Chart For Data Driven Result Analysis Of Business PowerPoint Slide
This business diagram displays graphic of pie charts in shape of flasks. This business slide is suitable to present and compare business data. Use this diagram to build professional presentations for your viewers.
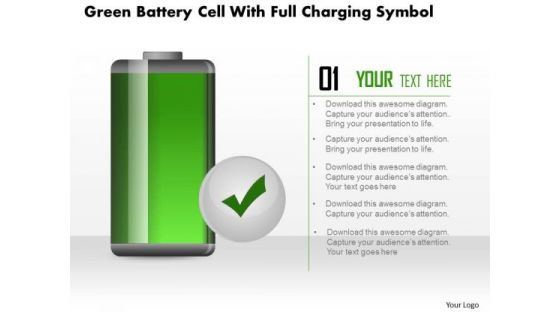
Business Diagram Green Battery Cell With Full Charging Symbol PowerPoint Slide
This business diagram displays full battery charge icon. Use this diagram, in your presentations to display energy saving, battery and technology. Create professional presentations using this diagram slide.
Business Diagram Hour Glass With 3d Man And Icons PowerPoint Slide
This diagram displays 3d man with hour glass and icons. This diagram contains concept of communication and technology. Use this diagram to display business process workflows in any presentations.
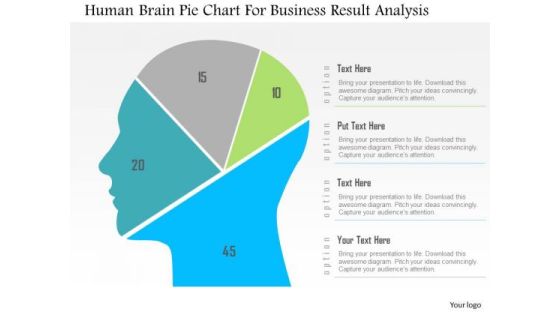
Business Diagram Human Brain Pie Chart For Business Result Analysis PowerPoint Slide
This diagram displays human face graphic divided into sections. This section can be used for data display. Use this diagram to build professional presentations for your viewers.
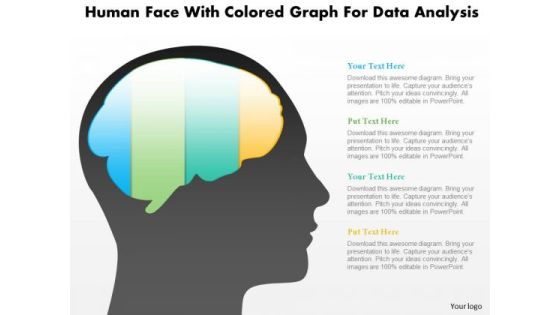
Business Diagram Human Face With Colored Graph For Data Analysis PowerPoint Slide
This diagram displays human face graphic with colored graph. This diagram can be used to represent strategy, planning, thinking of business plan. Display business options in your presentations by using this creative diagram.
Business Diagram Human Icons With Bubbles And Different Icons Inside PowerPoint Slide
This diagram displays graph with percentage value growth. This business slide is suitable to present and compare business data. Use this diagram to build professional presentations for your viewers.

Business Diagram Human Mind Diagram With Pie Graph For Representation PowerPoint Slide
This diagram displays human face graphic divided into sections. This section can be used for data display. Use this diagram to build professional presentations for your viewers.

Business Diagram Laptop With Data Driven Area Chart PowerPoint Slide
This diagram has been designed with laptop and data driven area chart. Download this diagram to give your presentations more effective look. It helps in clearly conveying your message to clients and audience.
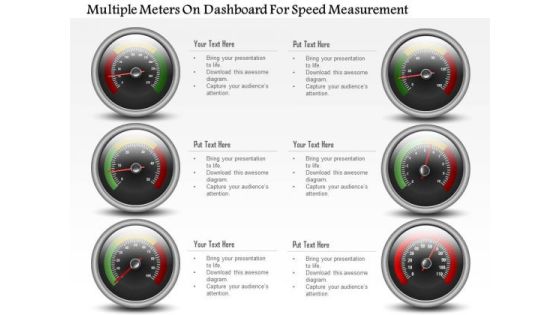
Business Diagram Multiple Meters On Dashboard For Speed Measurement PowerPoint Slide
This business diagram has been designed with multiple meters on dashboard. This slide can be used for business planning and progress. Use this diagram for your business and success milestones related presentations.

Business Diagram Six Staged Pie Charts For Text Representation PowerPoint Slide
This slide displays graphic six staged pie charts. Download this diagram to present and compare business data. Use this diagram to display business process workflows in any presentation.

Business Diagram Tablet With Pie And Business Bar Graph For Result Analysis PowerPoint Slide
This PowerPoint template displays technology gadgets with various business charts. Use this diagram slide, in your presentations to make business reports for statistical analysis. You may use this diagram to impart professional appearance to your presentations.
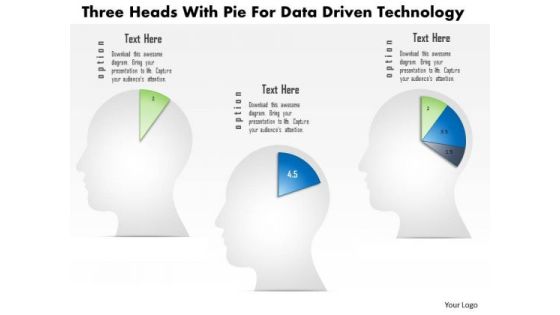
Business Diagram Three Heads With Pie For Data Driven Technology PowerPoint Slide
This business diagram displays three human faces with pie charts. This Power Point template has been designed to compare and present business data. You may use this diagram to impart professional appearance to your presentations.

Business Diagram Three Staged Pencil Diagram For Graph Formation PowerPoint Slide
This business diagram displays set of pencils. This Power Point template has been designed to compare and present business data. Download this diagram to represent stages of business growth.

Business Diagram Four Steps With 3d Business Person Standing Over It PowerPoint Slide
This business diagram displays bar graph with business person standing on it. This Power Point template has been designed to display personal growth. You may use this diagram to impart professional appearance to your presentations.
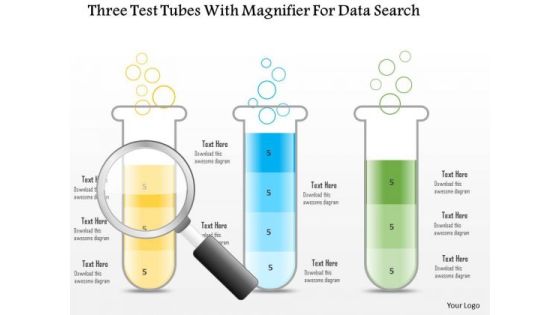
Business Diagram Three Test Tubes With Magnifier For Data Search PowerPoint Slide
This business diagram displays three test tubes with magnifying glass. This diagram is suitable to depict flow of business activities or steps. Download this professional slide to present information in an attractive manner.
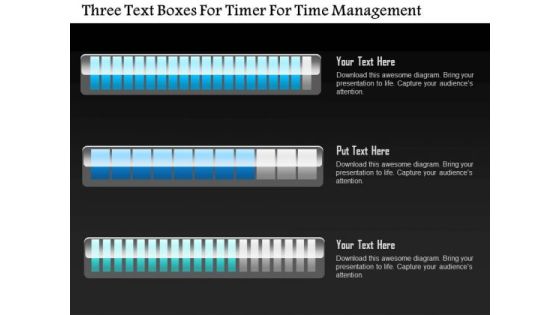
Business Diagram Three Text Boxes For Timer For Time Management PowerPoint Slide
This business diagram displays three text boxes. This diagram contains text boxes for data representation. Use this diagram to display business process workflows in any presentations.

Business Diagram Three Trucks For Data Representation For Business PowerPoint Slide
This business diagram displays three trucks graphic. This diagram contains trucks for percentage value growth. Use this diagram to display business growth over a period of time.

Business Diagram Two Tablets With Growth Bar Graph Data Driven PowerPoint Slide
This business diagram has been designed with comparative charts on tablets. This slide suitable for data representation. You can also use this slide to present business reports and information. Use this diagram to present your views in a wonderful manner.

World Map With Different Company Locations Ppt PowerPoint Presentation Templates
This is a world map with different company locations ppt powerpoint presentation templates. This is a four stage process. The stages in this process are business, strategy, location, map, geography, icons, analysis.

Bpm Market Analysis Timeline Ppt PowerPoint Presentation Tips
This is a bpm market analysis timeline ppt powerpoint presentation tips. This is a five stage process. The stages in this process are growth, analysis, strategy, market, timeline.

Business Performance Comparison Ppt PowerPoint Presentation Summary
This is a business performance comparison ppt powerpoint presentation summary. This is a two stage process. The stages in this process are business, performance, comparison, presentation, design, diagram.

Attribute Listing Technique Ppt PowerPoint Presentation Microsoft
This is a attribute listing technique ppt powerpoint presentation microsoft. This is a three stage process. The stages in this process are features, attributes, alternatives, material used, lead material, shape, special features.
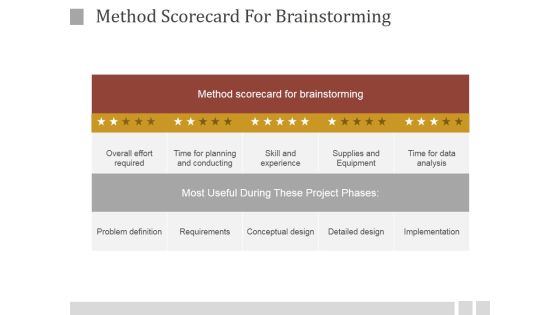
Method Scorecard For Brainstorming Ppt PowerPoint Presentation Visuals
This is a method scorecard for brainstorming ppt powerpoint presentation visuals. This is a five stage process. The stages in this process are method scorecard for brainstorming, overall effort required, time for planning and conducting, skill and experience, supplies and equipment, time for data analysis.

Operational Highlights Ppt PowerPoint Presentation Diagrams
This is a operational highlights ppt powerpoint presentation diagrams. This is a four stage process. The stages in this process are business, process, growth, analysis, strategy, success.

Principles For Judging The Alternatives Ppt PowerPoint Presentation Background Image
This is a principles for judging the alternatives ppt powerpoint presentation background image. This is a two stage process. The stages in this process are business, marketing, analysis, success, process.

News Paper Ppt PowerPoint Presentation Graphics
This is a news paper ppt powerpoint presentation graphics. This is a one stage process. The stages in this process are business, marketing, newspaper, planning, management.

Organization Structure Ppt PowerPoint Presentation Inspiration
This is a organization structure ppt powerpoint presentation inspiration. This is a three stage process. The stages in this process are business, marketing, management, organization structure, analysis.
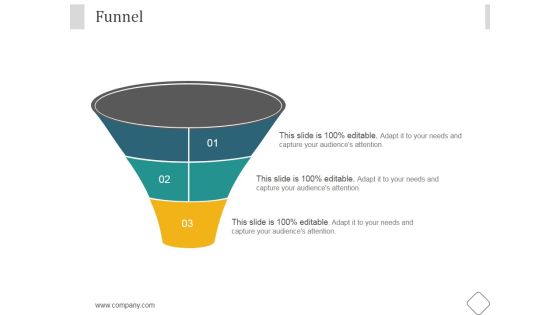
Funnel Ppt PowerPoint Presentation Backgrounds
This is a funnel ppt powerpoint presentation backgrounds. This is a three stage process. The stages in this process are business, marketing, management, funnel, planning.

Bar Graph Ppt PowerPoint Presentation Templates
This is a bar graph ppt powerpoint presentation templates. This is a four stage process. The stages in this process are arrows, business, marketing, strategy, growth, graphic.

Brand-Product Matrix Ppt PowerPoint Presentation Shapes
This is a brand-product matrix ppt powerpoint presentation shapes. This is a four stage process. The stages in this process are product, matrix, business, marketing, strategy, tables.

Bar Graph Ppt PowerPoint Presentation Layout
This is a bar graph ppt powerpoint presentation layout. This is a three stage process. The stages in this process are business, marketing, management, analysis, growth.

Customer Traction Ppt PowerPoint Presentation Information
This is a customer traction ppt powerpoint presentation information. This is a four stage process. The stages in this process are signed up, visited signup page, traffic, impressions, funnel.
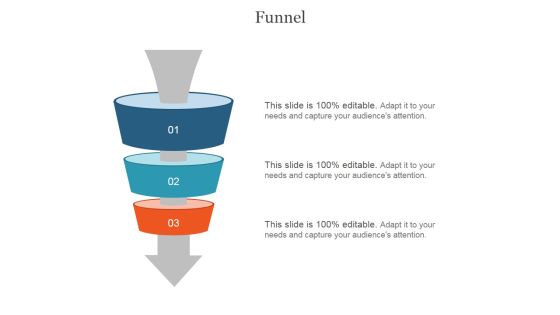
Funnel Ppt PowerPoint Presentation Slides
This is a funnel ppt powerpoint presentation slides. This is a three stage process. The stages in this process are business, marketing, management, funnel, process.
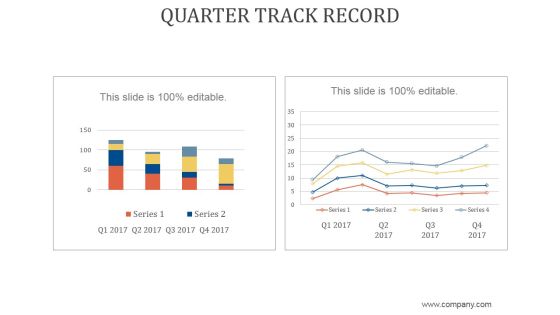
Quarter Track Record Ppt PowerPoint Presentation Samples
This is a quarter track record ppt powerpoint presentation samples. This is a two stage process. The stages in this process are business, strategy, marketing, analysis, growth strategy, bar graph.

Dashboard Ppt PowerPoint Presentation Shapes
This is a dashboard ppt powerpoint presentation shapes. This is a five stage process. The stages in this process are very poor, poor, fair, good, excllent.

Next Quarter Deals Ppt PowerPoint Presentation Design Templates
This is a next quarter deals ppt powerpoint presentation design templates. This is a four stage process. The stages in this process are business, strategy, marketing, analysis, lead name, value quality.

Bar Graph Ppt PowerPoint Presentation Good
This is a bar graph ppt powerpoint presentation good. This is a four stage process. The stages in this process are bar graph, growth, business, marketing, management, percentage.

Pareto Chart Ppt PowerPoint Presentation Shapes
This is a pareto chart ppt powerpoint presentation shapes. This is a eight stage process. The stages in this process are business, strategy, marketing, success, growth strategy.
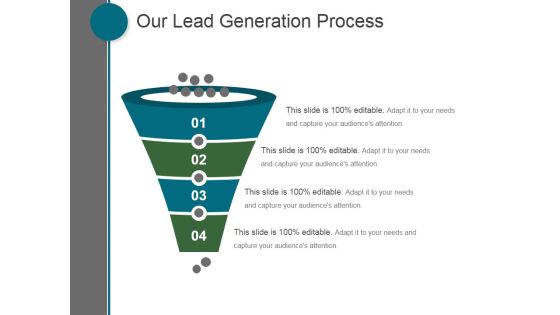
Our Lead Generation Process Ppt PowerPoint Presentation Microsoft
This is a our lead generation process ppt powerpoint presentation microsoft. This is a four stage process. The stages in this process are business, marketing, management, process, funnel.
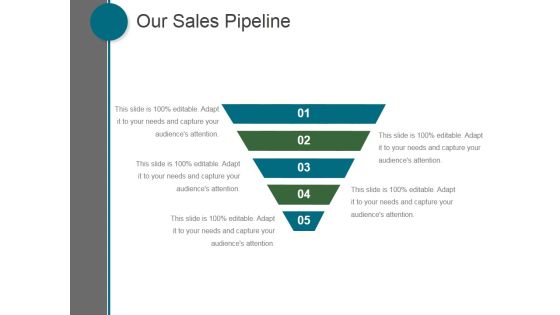
Our Sales Pipeline Ppt PowerPoint Presentation Picture
This is a our sales pipeline ppt powerpoint presentation picture. This is a five stage process. The stages in this process are business, marketing, management, process, funnel.

Risk Return Plot Ppt PowerPoint Presentation Background Images
This is a risk return plot ppt powerpoint presentation background images. This is a nine stage process. The stages in this process are annualized return, annualized standard deviation.

Cash Flow Optimization Ppt PowerPoint Presentation Deck
This is a cash flow optimization ppt powerpoint presentation deck. This is a three stage process. The stages in this process are gears, technology, management, business, process.

Competitor Analysis 2 X 2 Matrix Ppt PowerPoint Presentation Deck
This is a competitor analysis 2 x 2 matrix ppt powerpoint presentation deck. This is a four stage process. The stages in this process are business, marketing, management, matrix, analysis.
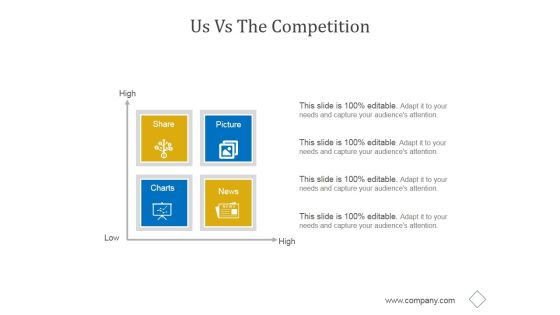
Us Vs The Competition Ppt PowerPoint Presentation Influencers
This is a us vs the competition ppt powerpoint presentation influencers. This is a four stage process. The stages in this process are business, marketing, management, competition, matrix.
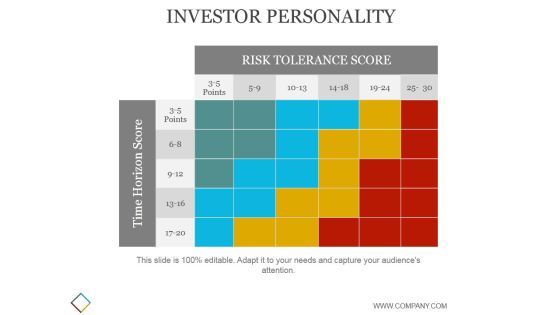
Investor Personality Template 2 Ppt PowerPoint Presentation Themes
This is a investor personality template 2 ppt powerpoint presentation themes. This is a four stage process. The stages in this process are risk tolerance score, time horizon score.

Portfolio Management Process Ppt PowerPoint Presentation Layout
This is a portfolio management process ppt powerpoint presentation layout. This is a five stage process. The stages in this process are define, analyze, control, measure, improve.

Pareto Optimal Portfolio Ppt PowerPoint Presentation Deck
This is a pareto optimal portfolio ppt powerpoint presentation deck. This is a two stage process. The stages in this process are infeasible region, dominated solutions, attribute, utopia point.

Performance Attribution Ppt PowerPoint Presentation Styles
This is a performance attribution ppt powerpoint presentation styles. This is a three stage process. The stages in this process are performance, currency, success, analysis, business, marketing.

Dashboard Ppt PowerPoint Presentation Introduction Ppt PowerPoint Presentation Pictures
This is a dashboard ppt powerpoint presentation introduction ppt powerpoint presentation pictures. This is a three stage process. The stages in this process are business, strategy, marketing, success, dashboard.
