Financial Benchmarking
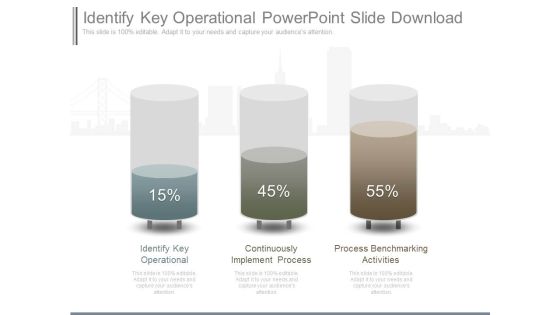
Identify Key Operational Powerpoint Slide Download
This is a identify key operational powerpoint slide download. This is a three stage process. The stages in this process are identify key operational, continuously implement process, process benchmarking activities.\n\n\n\n\n
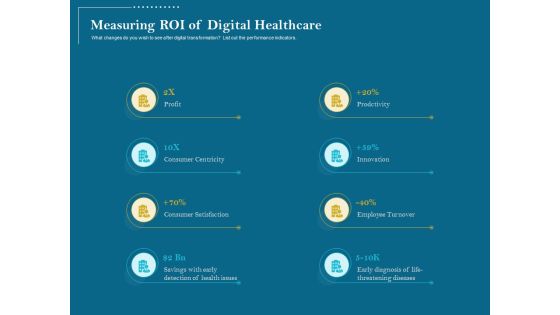
Utilizing Cyber Technology For Change Process Measuring ROI Of Digital Healthcare Formats PDF
What changes do you wish to see after digital transformation List out the performance indicators. This is a utilizing cyber technology for change process measuring roi of digital healthcare formats pdf template with various stages. Focus and dispense information on eight stages using this creative set, that comes with editable features. It contains large content boxes to add your information on topics like profit, consumer centricity, consumer satisfaction, savings with early detection of health issues, prodctivity, innovation, employee turnover, early diagnosis of life-threatening diseases. You can also showcase facts, figures, and other relevant content using this PPT layout. Grab it now.

Key Performance Indicators Template 2 Ppt PowerPoint Presentation Model Example
This is a key performance indicators template 2 ppt powerpoint presentation model example. This is a four stage process. The stages in this process are objective, measures, targets, invites, indicators.
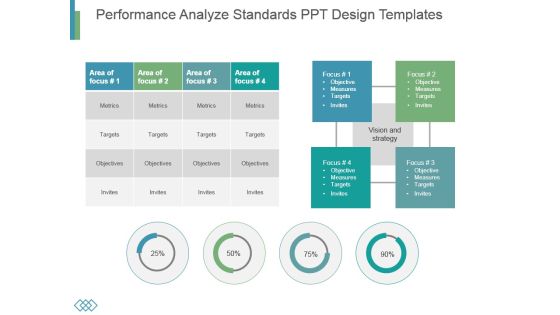
Performance Analyze Standards Ppt Design Templates
This is a performance analyze standards ppt design templates. This is a four stage process. The stages in this process are metrics, targets, objectives, invites.

Measurement Of Portfolio Analysis Ppt PowerPoint Presentation Inspiration
This is a measurement of portfolio analysis ppt powerpoint presentation inspiration. This is a seven stage process. The stages in this process are business, strategy, marketing, analysis, success, finance.
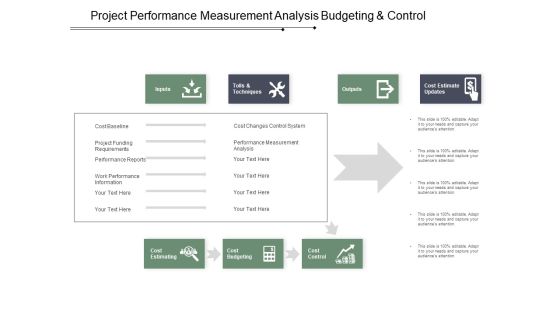
Project Performance Measurement Analysis Budgeting And Control Ppt PowerPoint Presentation Outline Format
This is a project performance measurement analysis budgeting and control ppt powerpoint presentation outline format. This is a three stage process. The stages in this process are cost control, money control, price control.
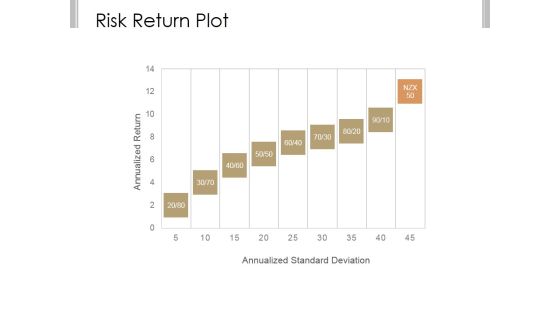
Risk Return Plot Ppt PowerPoint Presentation Styles
This is a risk return plot ppt powerpoint presentation styles. This is a nine stage process. The stages in this process are annualized return, annualized standard deviation.
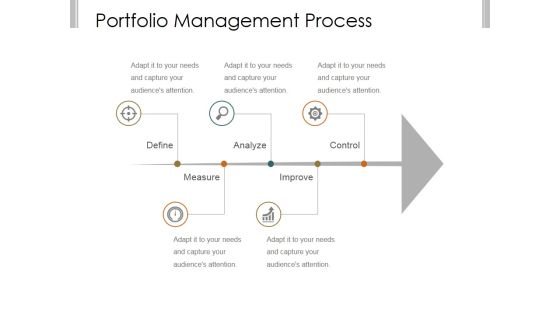
Portfolio Management Process Ppt PowerPoint Presentation Backgrounds
This is a portfolio management process ppt powerpoint presentation backgrounds. This is a five stage process. The stages in this process are define, analyze, control, improve, measure.

Comparison Ppt PowerPoint Presentation Inspiration Structure
This is a comparison ppt powerpoint presentation inspiration structure. This is a two stage process. The stages in this process are compare, measure, finance, percentage, business.
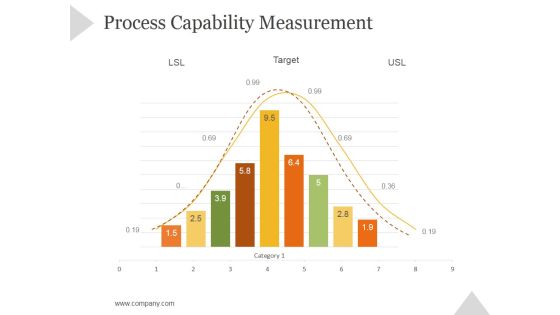
Process Capability Measurement Ppt PowerPoint Presentation Rules
This is a process capability measurement ppt powerpoint presentation rules. This is a nine stage process. The stages in this process are business, strategy, marketing, success, bar graph, growth strategy.

Measurement Of Portfolio Analysis Ppt PowerPoint Presentation Ideas
This is a measurement of portfolio analysis ppt powerpoint presentation ideas. This is a four stage process. The stages in this process are your current portfolio, holding, current weight, current value.
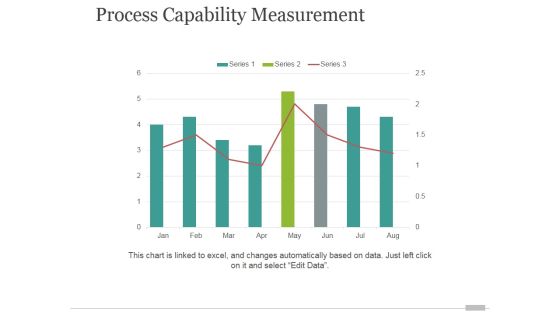
Process Capability Measurement Tamplate 2 Ppt PowerPoint Presentation Shapes
This is a process capability measurement tamplate 2 ppt powerpoint presentation shapes. This is a eight stage process. The stages in this process are too much variation, good, great, specification.

Key Performance Indicators Template 3 Ppt PowerPoint Presentation Samples
This is a key performance indicators template 3 ppt powerpoint presentation samples. This is a four stage process. The stages in this process are objective, measures, targets, invites.
Portfolio Evaluation Template 1 Ppt PowerPoint Presentation Backgrounds
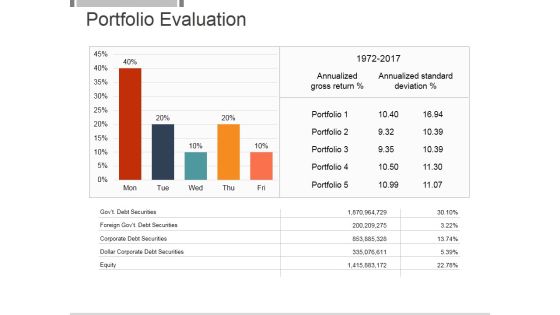
This is a portfolio evaluation template 1 ppt powerpoint presentation backgrounds. This is a five stage process. The stages in this process are annualized gross return, annualized standard deviation, portfolio, equity, dollar corporate debt securities, corporate debt securities.

Key Performance Indicators Template 2 Ppt PowerPoint Presentation Layouts Portfolio
This is a key performance indicators template 2 ppt powerpoint presentation layouts portfolio. This is a four stage process. The stages in this process are objective, measures, targets, invites.
Business Diagram Multiple Meters On Dashboard For Speed Measurement PowerPoint Slide
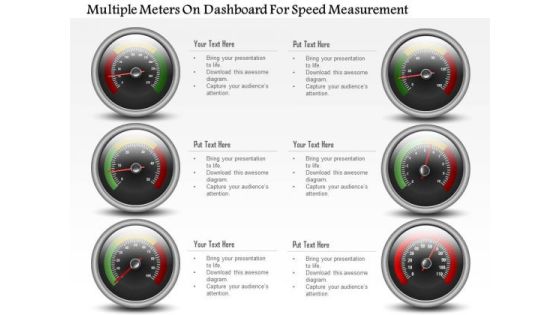
This business diagram has been designed with multiple meters on dashboard. This slide can be used for business planning and progress. Use this diagram for your business and success milestones related presentations.

Risk Return Plot Ppt PowerPoint Presentation Background Images
This is a risk return plot ppt powerpoint presentation background images. This is a nine stage process. The stages in this process are annualized return, annualized standard deviation.

Portfolio Management Process Ppt PowerPoint Presentation Layout
This is a portfolio management process ppt powerpoint presentation layout. This is a five stage process. The stages in this process are define, analyze, control, measure, improve.

Strategy To Enhance Supply Chain Operations Best Practices Of Logistics And Supply Chain Management Elements PDF
This slide covers key initiatives to optimize logistics and supply chain management. It involves practices such as use external benchmarking tools, integrate cloud based software and outsource logistics procurement process. Make sure to capture your audiences attention in your business displays with our gratis customizable Strategy To Enhance Supply Chain Operations Best Practices Of Logistics And Supply Chain Management Elements PDF. These are great for business strategies, office conferences, capital raising or task suggestions. If you desire to acquire more customers for your tech business and ensure they stay satisfied, create your own sales presentation with these plain slides.
Revenue Growth Assessment Example Powerpoint Slide Graphics
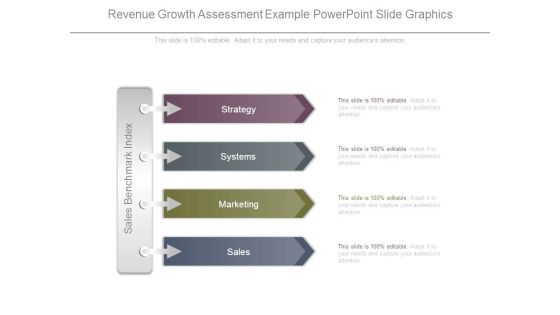
This is a revenue growth assessment example powerpoint slide graphics. This is a four stage process. The stages in this process are sales benchmark index, strategy, systems, marketing, sales.

Organisational Level Employee Key Performance Indicators Performance Indicators Rules PDF
The following slide highlights the organisational level staff key performance Indicators illustrating key headings KPI, description, benchmark and value. It also depicts revenue per employee, profit per FTE, human capital ROI, absenteeism rate and overtime per employee Showcasing this set of slides titled Organisational Level Employee Key Performance Indicators Performance Indicators Rules PDF The topics addressed in these templates are Revenue Compensation, Overtime Employee, Benchmark All the content presented in this PPT design is completely editable. Download it and make adjustments in color, background, font etc. as per your unique business setting.

Performance Measures Ppt PowerPoint Presentation Inspiration Skills
This is a performance measures ppt powerpoint presentation inspiration skills. This is a two stage process. The stages in this process are non financial measures, financial measures, growth, business, marketing.

Performance Measures Ppt PowerPoint Presentation Slides Sample
This is a performance measures ppt powerpoint presentation slides sample. This is a two stage process. The stages in this process are financial measures, non financial measures, business, strategy.
Performance Measures Ppt PowerPoint Presentation Layouts Clipart Images
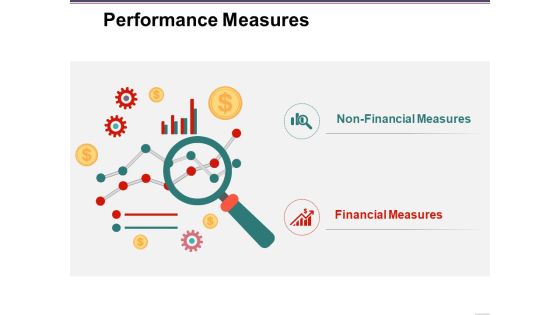
This is a performance measures ppt powerpoint presentation layouts clipart images. This is a two stage process. The stages in this process are non financial measures, financial measures, business, icons, marketing.
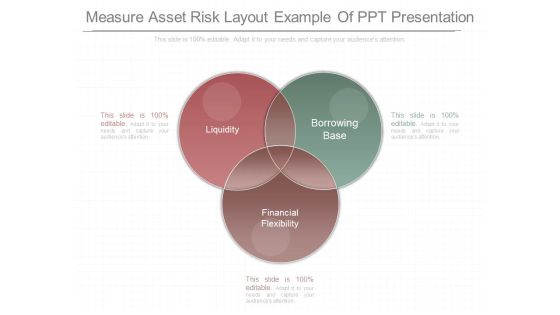
Measure Asset Risk Layout Example Of Ppt Presentation
This is a measure asset risk layout example of ppt presentation. This is a three stage process. The stages in this process are liquidity, borrowing base, financial flexibility.

Experian Company Outline Revenue And Dividend Per Share Demonstration PDF
This slide highlights the Experian revenue and dividend per share which includes revenue, benchmark EBIT and EBIT margin, Benchmark earning per share and divided per share. Here you can discover an assortment of the finest PowerPoint and Google Slides templates. With these templates, you can create presentations for a variety of purposes while simultaneously providing your audience with an eye catching visual experience. Download Experian Company Outline Revenue And Dividend Per Share Demonstration PDF to deliver an impeccable presentation. These templates will make your job of preparing presentations much quicker, yet still, maintain a high level of quality. Slidegeeks has experienced researchers who prepare these templates and write high quality content for you. Later on, you can personalize the content by editing the Experian Company Outline Revenue And Dividend Per Share Demonstration PDF.
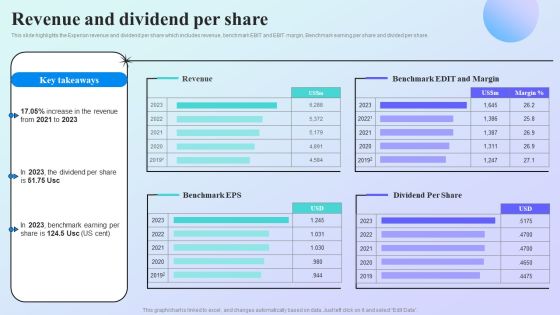
Information Analytics Company Outline Revenue And Dividend Per Share Guidelines PDF
This slide highlights the Experian revenue and dividend per share which includes revenue, benchmark EBIT and EBIT margin, Benchmark earning per share and divided per share. Presenting this PowerPoint presentation, titled Information Analytics Company Outline Revenue And Dividend Per Share Guidelines PDF, with topics curated by our researchers after extensive research. This editable presentation is available for immediate download and provides attractive features when used. Download now and captivate your audience. Presenting this Information Analytics Company Outline Revenue And Dividend Per Share Guidelines PDF. Our researchers have carefully researched and created these slides with all aspects taken into consideration. This is a completely customizable Information Analytics Company Outline Revenue And Dividend Per Share Guidelines PDF that is available for immediate downloading. Download now and make an impact on your audience. Highlight the attractive features available with our PPTs.

Customer Credit Reporting Company Outline Revenue And Dividend Per Share Pictures PDF
This slide highlights the Experian revenue and dividend per share which includes revenue, benchmark EBIT and EBIT margin, Benchmark earning per share and divided per share. This Customer Credit Reporting Company Outline Revenue And Dividend Per Share Pictures PDF is perfect for any presentation, be it in front of clients or colleagues. It is a versatile and stylish solution for organizing your meetings. The Customer Credit Reporting Company Outline Revenue And Dividend Per Share Pictures PDF features a modern design for your presentation meetings. The adjustable and customizable slides provide unlimited possibilities for acing up your presentation. Slidegeeks has done all the homework before launching the product for you. So, do not wait, grab the presentation templates today

Organizational Strategy Execution And Planning Map Sample PDF
The slide showcases a business strategy map measuring the financial and non-financial growth useful for keeping track of the success and execution of a strategy with traditional 4 layers of business strategy. It covers perspectives like financial performance, customer marketing growth, process excellence, people and learning. Persuade your audience using this Organizational Strategy Execution And Planning Map Sample PDF. This PPT design covers four stages, thus making it a great tool to use. It also caters to a variety of topics including Financial Performance, Customer Marketing Growth, Process Excellence. Download this PPT design now to present a convincing pitch that not only emphasizes the topic but also showcases your presentation skills.

Logistics Management Framework Performance Measures Sample PDF
Presenting logistics management framework performance measures sample pdf to provide visual cues and insights. Share and navigate important information on two stages that need your due attention. This template can be used to pitch topics like non financial measures, financial measures. In addtion, this PPT design contains high resolution images, graphics, etc, that are easily editable and available for immediate download.

Logistics Management Services Performance Measures Designs PDF
Presenting logistics management services performance measures designs pdf to provide visual cues and insights. Share and navigate important information on two stages that need your due attention. This template can be used to pitch topics like non financial measures, financial measures. In addtion, this PPT design contains high resolution images, graphics, etc, that are easily editable and available for immediate download.

SCM Growth Performance Measures Ppt Diagram Templates PDF
Presenting scm growth performance measures ppt diagram templates pdf to provide visual cues and insights. Share and navigate important information on two stages that need your due attention. This template can be used to pitch topics like non financial measures, financial measures. In addtion, this PPT design contains high resolution images, graphics, etc, that are easily editable and available for immediate download.
Power Management System And Technology Motivate Ppt PowerPoint Presentation Slides Icon PDF
Presenting this set of slides with name power management system and technology motivate ppt powerpoint presentation slides icon pdf. This is a six stage process. The stages in this process are internal competition, recognition, financial bonus and prizes, environmental responsibility, financial responsibility, performance standards. This is a completely editable PowerPoint presentation and is available for immediate download. Download now and impress your audience.

Industry Wise Email Marketing Performance Statistics Analysis Graphics PDF
This slide includes email marketing benchmarks and statistics for the year 2022 based on various industries. It includes email metrics such as open rate, CTR, unsubscribes rate in industries like automobile, finance, retail, food, legal services, etc. Pitch your topic with ease and precision using this Industry Wise Email Marketing Performance Statistics Analysis Graphics PDF. This layout presents information on Automobile, Financial Service, Legal Services. It is also available for immediate download and adjustment. So, changes can be made in the color, design, graphics or any other component to create a unique layout.
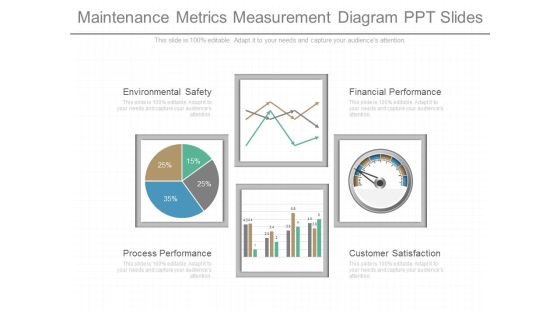
Maintenance Metrics Measurement Diagram Ppt Slides
This is a maintenance metrics measurement diagram ppt slides. This is a four stage process. The stages in this process are environmental safety, process performance, financial performance, customer satisfaction.

Strategical And Tactical Planning Evaluating And Measuring Strategic Objectives Progress Infographics PDF
This template covers perspective objectives and measures for monitoring strategic progress. It includes perspective such as social impact mission, constituent customer, internal operations internal perspective, financial financial perspective, and organizational capacity learning and growth. Deliver and pitch your topic in the best possible manner with this Strategical And Tactical Planning Evaluating And Measuring Strategic Objectives Progress Infographics PDF. Use them to share invaluable insights on Social Impact Mission, Constituent Customer, Financial Perspective and impress your audience. This template can be altered and modified as per your expectations. So, grab it now.

Four Layer Learning Strategy Model Ppt Show Slides PDF
This slide illustrate strategy map framework to measures financial and non-financial growth and useful in monitoring company performance. It includes elements such as financial performance, customer and marketing growth, process excellence, people and learning. Pitch your topic with ease and precision using this Four Layer Learning Strategy Model Ppt Show Slides PDF. This layout presents information on Revenue Growth, Productivity Improvement, Human Capital. It is also available for immediate download and adjustment. So, changes can be made in the color, design, graphics or any other component to create a unique layout.
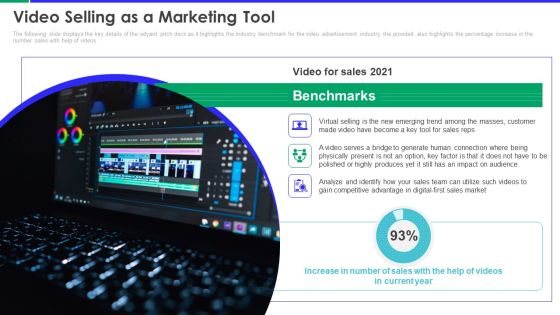
Vidyard Investor Capital Funding Elevator Pitch Deck Video Selling As A Marketing Tool Summary PDF Template PDF
The following slide displays the key details of the vidyard pitch deck as it highlights the Industry benchmark for the video advertisement industry, the provided also highlights the percentage increase in the number sales with help of videos. Deliver and pitch your topic in the best possible manner with this vidyard investor capital funding elevator pitch deck video selling as a marketing tool summary pdf template pdf. Use them to share invaluable insights on video selling as a marketing tool and impress your audience. This template can be altered and modified as per your expectations. So, grab it now.
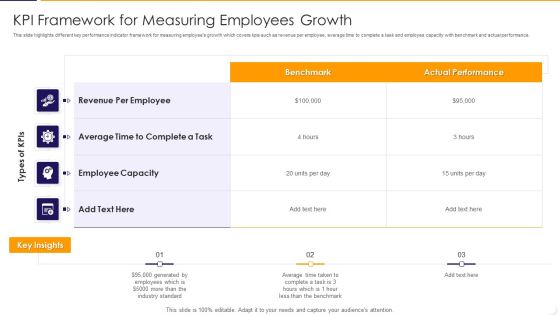
KPI Framework For Measuring Employees Growth Ppt PowerPoint Presentation File Files PDF
This slide highlights different key performance indicator framework for measuring employees growth which covers kpis such as revenue per employee, average time to complete a task and employee capacity with benchmark and actual performance. Showcasing this set of slides titled kpi framework for measuring employees growth ppt powerpoint presentation file files pdf The topics addressed in these templates are average, revenue, industry. All the content presented in this PPT design is completely editable. Download it and make adjustments in color, background, font etc. as per your unique business setting.

Defining The Weightage Scale For Evaluating Vendor Performance Infographics PDF
Mentioned slide defines the weightage scale that can be set by the firm to measure vendor performance. It covers information about vendors product delivery performance, and product quality benchmark that are used to evaluate performance.Make sure to capture your audiences attention in your business displays with our gratis customizable Defining The Weightage Scale For Evaluating Vendor Performance Infographics PDF. These are great for business strategies, office conferences, capital raising or task suggestions. If you desire to acquire more customers for your tech business and ensure they stay satisfied, create your own sales presentation with these plain slides.
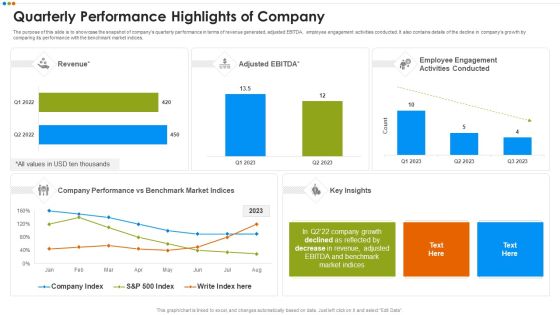
Quarterly Budget Analysis Of Business Organization Quarterly Performance Highlights Of Company Graphics PDF
The purpose of this slide is to showcase the snapshot of companys quarterly performance in terms of revenue generated, adjusted EBITDA, employee engagement activities conducted. It also contains details of the decline in companys growth by comparing its performance with the benchmark market indices.This is a Quarterly Budget Analysis Of Business Organization Quarterly Performance Highlights Of Company Graphics PDF template with various stages. Focus and dispense information on two stages using this creative set, that comes with editable features. It contains large content boxes to add your information on topics like Quarterly Performance Highlights Of Company You can also showcase facts, figures, and other relevant content using this PPT layout. Grab it now.

Brand Loyalty Measurement And Management Ppt Slides
This is a brand loyalty measurement and management ppt slides. This is a six stage process. The stages in this process are financial performance, brand value, brand strategy, benefits, profitability, imagery, attributes, attitudes.

Measure A Firms Market Risk Example Ppt Example File
This is a measure a firms market risk example ppt example file. This is a seven stage process. The stages in this process are foreign currency, interest rate, disputes, liquidity, default, business risks, financial risks.

Brief Description About Firm Uplift Food Production Company Quality Standards Infographics PDF
This slide provides information regarding the brief description about firm in terms of its history, financial highlights and firm offerings as food processing firm. Deliver and pitch your topic in the best possible manner with this brief description about firm uplift food production company quality standards infographics pdf. Use them to share invaluable insights on financial, lifestyle, health and wellness and impress your audience. This template can be altered and modified as per your expectations. So, grab it now.

Balanced Scorecard Approach Diagram Presentation Design
This is a balanced scorecard approach diagram presentation design. This is a five stage process. The stages in this process are measuring standards, discussing results, customer perspective, internal processes, financial perspective, balanced scorecard.

Supply Network Management Growth Performance Measures Rules PDF
This is a supply network management growth performance measures rules pdf template with various stages. Focus and dispense information on two stages using this creative set, that comes with editable features. It contains large content boxes to add your information on topics like non financial measures, financial measures. You can also showcase facts, figures, and other relevant content using this PPT layout. Grab it now.
Supply Chain Management Operational Metrics Performance Measures Designs PDF
This is a supply chain management operational metrics performance measures designs pdf. template with various stages. Focus and dispense information on two stages using this creative set, that comes with editable features. It contains large content boxes to add your information on topics like NON financial measures, financial measures. You can also showcase facts, figures, and other relevant content using this PPT layout. Grab it now.

Multiple Phases For Supply Chain Management Performance Measures Themes PDF
This is a multiple phases for supply chain management performance measures themes pdf template with various stages. Focus and dispense information on two stages using this creative set, that comes with editable features. It contains large content boxes to add your information on topics like non financial measures, financial measures. You can also showcase facts, figures, and other relevant content using this PPT layout. Grab it now.
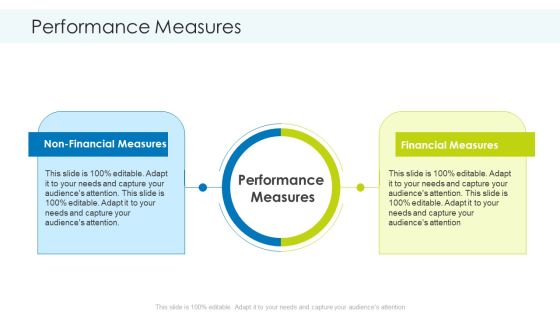
Planning And Predicting Of Logistics Management Performance Measures Professional PDF
This is a planning and predicting of logistics management performance measures professional pdf. template with various stages. Focus and dispense information on two stages using this creative set, that comes with editable features. It contains large content boxes to add your information on topics like non financial measures, financial measures. You can also showcase facts, figures, and other relevant content using this PPT layout. Grab it now.
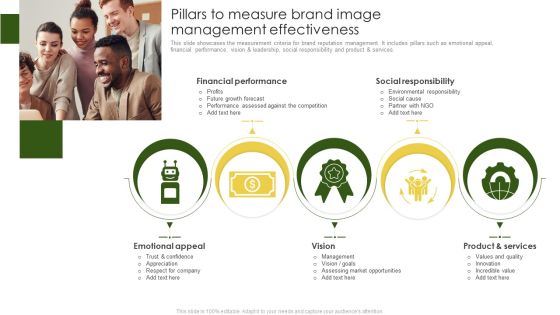
Pillars To Measure Brand Image Management Effectiveness Brochure PDF
This slide showcases the measurement criteria for brand reputation management. It includes pillars such as emotional appeal, financial performance, vision and leadership, social responsibility and product and services. Showcasing this set of slides titled Pillars To Measure Brand Image Management Effectiveness Brochure PDF. The topics addressed in these templates are Financial Performance, Social Responsibility, Emotional Appeal. All the content presented in this PPT design is completely editable. Download it and make adjustments in color, background, font etc. as per your unique business setting.

Goals And Measures For Effective Business Growth Template PDF
This slide signifies the measures and goals to enhance business growth. It includes types like financial, customer, internal business process and employee learning. Presenting Goals And Measures For Effective Business Growth Template PDF to dispense important information. This template comprises five stages. It also presents valuable insights into the topics including Financial Goals, Customer Goals, Internal Business Process. This is a completely customizable PowerPoint theme that can be put to use immediately. So, download it and address the topic impactfully.

Benefits Of Business Intelligence Layout Ppt Slide
This is a benefits of business intelligence layout ppt slide. This is a three stage process. The stages in this process are accounting and budgeting system, financial and standard reporting, operational and transactional system, business operations, business intelligence, finance, technology.
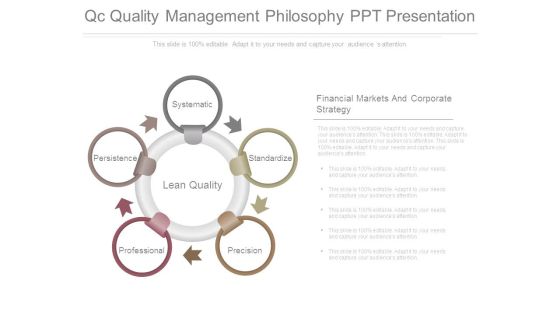
Qc Quality Management Philosophy Ppt Presentation
This is a qc quality management philosophy ppt presentation. This is a five stage process. The stages in this process are systematic, standardize, precision, professional, persistence, lean quality, financial markets and corporate strategy.

Customer Relationship Powerpoint Slide Background Designs
This is a customer relationship powerpoint slide background designs. This is a five stage process. The stages in this process are internal processes, financial measures, learning and growth, traditional strategic management, customer relationship.

Logistics Dashboard For XYZ Logistic Company Orders Slides PDF
The slide shows the logistic measurement dashboard for measuring order status, total orders, overdue shipments, global financial performance etc.Deliver and pitch your topic in the best possible manner with this logistics dashboard for xyz logistic company orders slides pdf. Use them to share invaluable insights on global financial performance, overdue shipments, late vendor shipments and impress your audience. This template can be altered and modified as per your expectations. So, grab it now.

Logistics Dashboard For XYZ Logistic Company Orders Ppt Infographic Template Diagrams PDF
The slide shows the logistic measurement dashboard for measuring order status, total orders, overdue shipments, global financial performance etc. Deliver and pitch your topic in the best possible manner with this logistics dashboard for xyz logistic company orders ppt infographic template diagrams pdf. Use them to share invaluable insights on global financial performance, orders, inventory and impress your audience. This template can be altered and modified as per your expectations. So, grab it now.

Logistics Dashboard For XYZ Logistic Company Inventory Ppt Infographic Template Background PDF
The slide shows the logistic measurement dashboard for measuring order status, total orders, overdue shipments, global financial performance etc.Deliver and pitch your topic in the best possible manner with this logistics dashboard for XYZ logistic company inventory ppt infographic template background pdf. Use them to share invaluable insights on global financial performance, orders, volume today and impress your audience. This template can be altered and modified as per your expectations. So, grab it now.
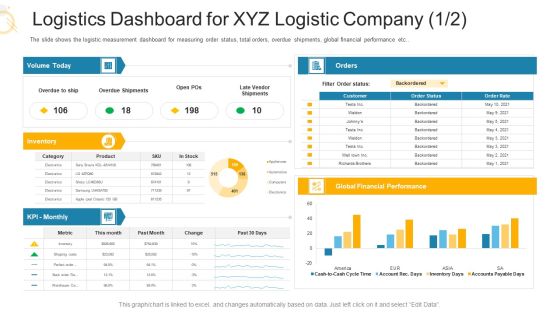
Logistics Dashboard For XYZ Logistic Company Performance Ppt Portfolio Slides PDF
The slide shows the logistic measurement dashboard for measuring order status, total orders, overdue shipments, global financial performance etc. Deliver an awe inspiring pitch with this creative logistics dashboard for XYZ logistic company performance ppt portfolio slides pdf bundle. Topics like financial performance, product, logistics dashboard for XYZ logistic company can be discussed with this completely editable template. It is available for immediate download depending on the needs and requirements of the user.
Energy Tracking Device Motivate Ppt PowerPoint Presentation Infographics Graphics Design PDF
Presenting energy tracking device motivate ppt powerpoint presentation infographics graphics design pdf to provide visual cues and insights. Share and navigate important information on six stages that need your due attention. This template can be used to pitch topics like internal competition, recognition, financial bonus and prizes, environmental responsibility, financial responsibility, performance standards. In addtion, this PPT design contains high-resolution images, graphics, etc, that are easily editable and available for immediate download.

Eco Friendly And Feasibility Management Motivate Mockup PDF
This is a eco friendly and feasibility management motivate mockup pdf. template with various stages. Focus and dispense information on six stages using this creative set, that comes with editable features. It contains large content boxes to add your information on topics like financial responsibility, performance standards, financial bonus and prizes, recognition, internal competition, environmental responsibility. You can also showcase facts, figures, and other relevant content using this PPT layout. Grab it now.

 Home
Home