AI PPT Maker
Templates
PPT Bundles
Design Services
Business PPTs
Business Plan
Management
Strategy
Introduction PPT
Roadmap
Self Introduction
Timelines
Process
Marketing
Agenda
Technology
Medical
Startup Business Plan
Cyber Security
Dashboards
SWOT
Proposals
Education
Pitch Deck
Digital Marketing
KPIs
Project Management
Product Management
Artificial Intelligence
Target Market
Communication
Supply Chain
Google Slides
Research Services
 One Pagers
All Categories
-
Home
- Customer Favorites
- Financial Analysis
Financial Analysis

Doughnut Chart Ppt PowerPoint Presentation Visual Aids Files
This is a doughnut chart ppt powerpoint presentation visual aids files. This is a three stage process. The stages in this process are finance, donut, percentage, business, marketing.
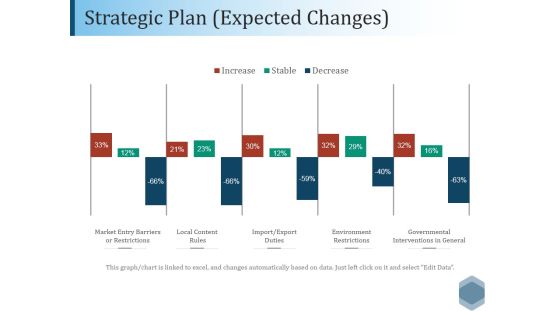
Strategic Plan Expected Changes Ppt PowerPoint Presentation Pictures Outline
This is a strategic plan expected changes ppt powerpoint presentation pictures outline. This is a five stage process. The stages in this process are market entry barriers or restrictions, local content, rules, import export, duties, environment restrictions, governmental interventions in general.

Clustered Column Line Ppt PowerPoint Presentation File Shapes
This is a clustered column line ppt powerpoint presentation file shapes. This is a four stage process. The stages in this process are business, marketing, strategy, bar, success.
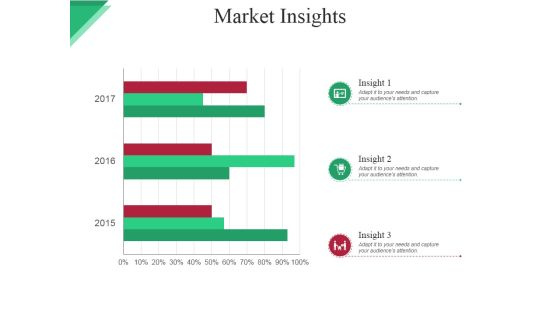
Market Insights Ppt PowerPoint Presentation Infographics Graphics
This is a market insights ppt powerpoint presentation infographics graphics. This is a three stage process. The stages in this process are icons, business, bar, marketing, strategy.

Bar Graph Ppt PowerPoint Presentation Professional Gridlines
This is a bar graph ppt powerpoint presentation professional gridlines. This is a three stage process. The stages in this process are bar, marketing, strategy, planning, growth.

Brand Tracking Info Graphics Ppt PowerPoint Presentation Model Example
This is a brand tracking info graphics ppt powerpoint presentation model example. This is a four stage process. The stages in this process are finance, marketing, percentage, business, icons.

Value Addition Due To Branding Template 1 Ppt PowerPoint Presentation Pictures Inspiration
This is a value addition due to branding template 1 ppt powerpoint presentation pictures inspiration. This is a three stage process. The stages in this process are business, marketing, strategy, finance, planning.

Value Addition Due To Branding Template Ppt PowerPoint Presentation Slide
This is a value addition due to branding template ppt powerpoint presentation slide. This is a three stage process. The stages in this process are business, marketing, strategy, finance, planning.
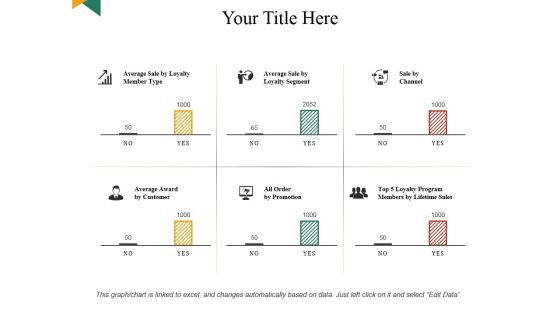
Your Title Here Ppt PowerPoint Presentation Professional File Formats
This is a your title here ppt powerpoint presentation professional file formats. This is a six stage process. The stages in this process are business, marketing, strategy, finance, planning.
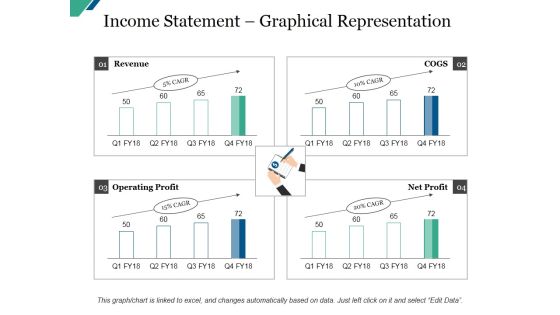
Income Statement Graphical Representation Ppt PowerPoint Presentation Summary Gallery
This is a income statement graphical representation ppt powerpoint presentation summary gallery. This is a four stage process. The stages in this process are current assets, current liabilities, total assets, total liabilities.

Eoq Cost Model Ppt PowerPoint Presentation Gallery Infographic Template
This is a eoq cost model ppt powerpoint presentation gallery infographic template. This is a two stage process. The stages in this process are ordering cost, holding cost, order quantity, total cost, order quantity.
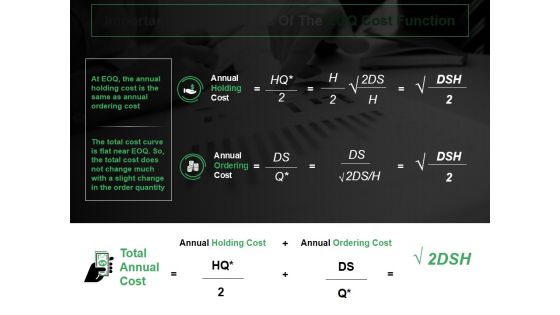
Important Characteristics Of The Eoq Cost Function Ppt PowerPoint Presentation Diagram Images
This is a important characteristics of the eoq cost function ppt powerpoint presentation diagram images. This is a two stage process. The stages in this process are annual holding cos, annual ordering cost, total annual cost.
Health Scorecard Ppt PowerPoint Presentation Layouts Icons
This is a health scorecard ppt powerpoint presentation layouts icons. This is a three stage process. The stages in this process are plan, marketing, finance, planning, strategy.
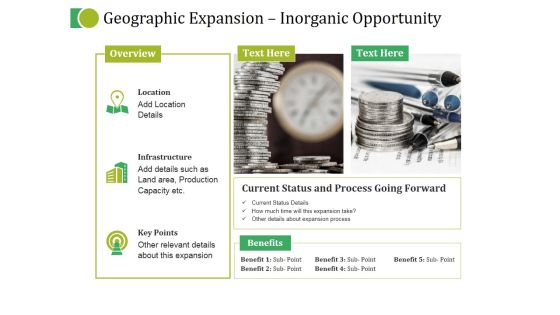
Geographic Expansion Inorganic Opportunity Ppt PowerPoint Presentation Summary
This is a geographic expansion inorganic opportunity ppt powerpoint presentation summary. This is a three stage process. The stages in this process are overview, benefits, current status and process going forward, location, infrastructure.

Line Chart Ppt PowerPoint Presentation Portfolio Inspiration
This is a line chart ppt powerpoint presentation portfolio inspiration. This is a two stage process. The stages in this process are business, marketing, strategy, planning, finance.
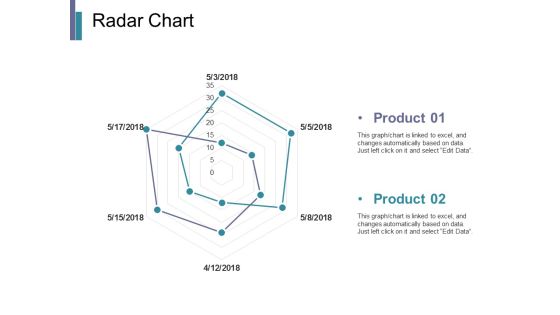
Radar Chart Ppt PowerPoint Presentation Infographics Pictures
This is a radar chart ppt powerpoint presentation infographics pictures. This is a two stage process. The stages in this process are business, marketing, strategy, planning, finance.

Stacked Line With Marker Ppt PowerPoint Presentation Layouts Summary
This is a stacked line with marker ppt powerpoint presentation layouts summary. This is a two stage process. The stages in this process are finance, marketing, strategy, planning, management.

Area Chart Ppt PowerPoint Presentation Infographic Template Portrait
This is a area chart ppt powerpoint presentation infographic template portrait. This is a two stage process. The stages in this process are business, marketing, strategy, planning, finance.

Balance Sheet Kpis Template 1 Ppt PowerPoint Presentation Professional Graphics Download
This is a balance sheet kpis template 1 ppt powerpoint presentation professional graphics download. This is a four stage process. The stages in this process are current assets, current liabilities, total assets, total liabilities.

Bubble Chart Ppt PowerPoint Presentation Portfolio Show
This is a bubble chart ppt powerpoint presentation portfolio show. This is a two stage process. The stages in this process are business, marketing, strategy, planning, finance.

Cash Flow Statement Kpis Template Ppt PowerPoint Presentation Pictures Diagrams
This is a cash flow statement kpis template ppt powerpoint presentation pictures diagrams. This is a four stage process. The stages in this process are operations, financing activities, investing activities, net increase in cash.

Customer Satisfaction Ppt PowerPoint Presentation Gallery Rules
This is a customer satisfaction ppt powerpoint presentation gallery rules. This is a three stage process. The stages in this process are business, marketing, strategy, planning, finance.

Taxation Ppt PowerPoint Presentation Infographics Graphics Example
This is a taxation ppt powerpoint presentation infographics graphics example. This is a one stage process. The stages in this process are finance, marketing, strategy, management, planning.

Template 4 Ppt PowerPoint Presentation Summary Demonstration
This is a template 4 ppt powerpoint presentation summary demonstration. This is a six stage process. The stages in this process are look to online review sites, read four to seven reviews before, no new reviews in 17, pointed out as fake.

Opportunity And Challenges Finance Ppt PowerPoint Presentation Layouts Format
This is a opportunity and challenges finance ppt powerpoint presentation layouts format. This is a two stage process. The stages in this process are challenges, opportunities, business, planning, marketing.

Cash Flow Green Drop With Dollar Symbol Ppt PowerPoint Presentation Professional Graphic Tips
This is a cash flow green drop with dollar symbol ppt powerpoint presentation professional graphic tips. This is a four stage process. The stages in this process are liquidity, cash assets, solvency.
Quality Audit Report Vector Icon Ppt PowerPoint Presentation Slides Graphics PDF
Presenting this set of slides with name quality audit report vector icon ppt powerpoint presentation slides graphics pdf. This is a three stage process. The stages in this process are quality audit report vector icon. This is a completely editable PowerPoint presentation and is available for immediate download. Download now and impress your audience.
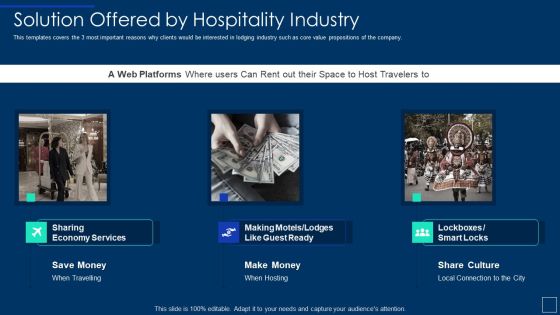
Solution Offered By Hospitality Industry Ppt Guidelines PDF
This templates covers the 3 most important reasons why clients would be interested in lodging industry such as core value propositions of the company. Presenting solution offered by hospitality industry ppt guidelines pdf to provide visual cues and insights. Share and navigate important information on three stages that need your due attention. This template can be used to pitch topics like solution offered by hospitality industry . In addtion, this PPT design contains high resolution images, graphics, etc, that are easily editable and available for immediate download.
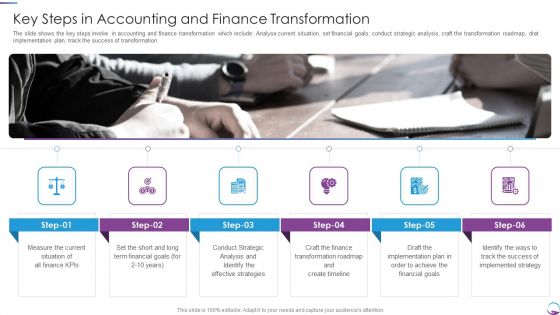
Key Steps In Accounting And Finance Transformation Formats PDF
The slide shows the key steps involve in accounting and finance transformation which include Analyse current situation, set financial goals, conduct strategic analysis, craft the transformation roadmap, drat implementation plan, track the success of transformation. This is a Key Steps In Accounting And Finance Transformation Formats PDF template with various stages. Focus and dispense information on six stages using this creative set, that comes with editable features. It contains large content boxes to add your information on topics like Measure, Finance, Analysis, Strategic, Plan. You can also showcase facts, figures, and other relevant content using this PPT layout. Grab it now.
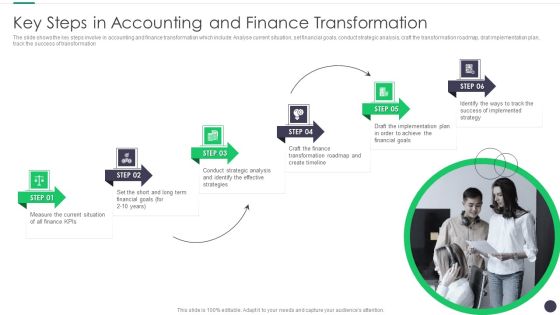
Finance And Accounting Online Conversion Plan Key Steps In Accounting And Finance Transformation Ideas PDF
The slide shows the key steps involve in accounting and finance transformation which include Analyse current situation, set financial goals, conduct strategic analysis, craft the transformation roadmap, drat implementation plan, track the success of transformation. This is a Finance And Accounting Online Conversion Plan Key Steps In Accounting And Finance Transformation Ideas PDF template with various stages. Focus and dispense information on six stages using this creative set, that comes with editable features. It contains large content boxes to add your information on topics like Finance Transformation, Strategic Analysis, Long Term. You can also showcase facts, figures, and other relevant content using this PPT layout. Grab it now.

Shareholder Value Management Ppt Slide Show
This is a shareholder value management ppt slide show. This is a nine stage process. The stages in this process are monitor individual results, reward results, strategic planning, performance measurement, analysis, business planning, forecasting, budgeting, reporting financial and operational, shareholder value.
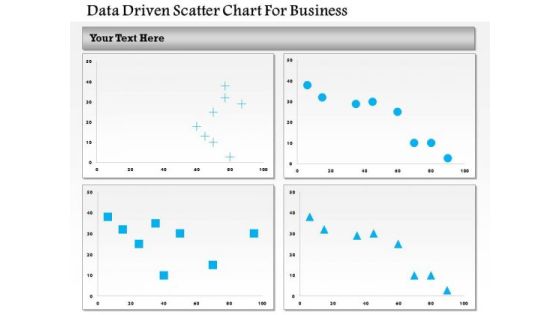
Business Diagram Data Driven Scatter Chart For Business PowerPoint Slide
This business diagram has been designed with four comparative charts. This slide suitable for data representation. You can also use this slide to present business analysis and reports. Use this diagram to present your views in a wonderful manner.
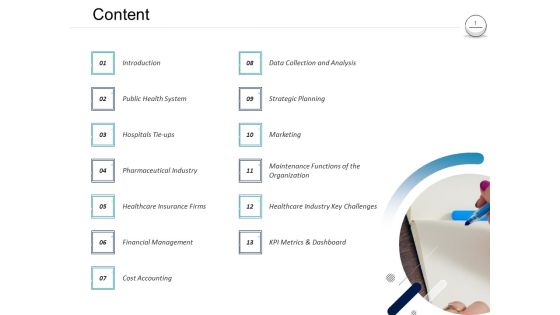
Pharmaceutical Management Content Ppt Diagram Images PDF
Presenting pharmaceutical management content ppt diagram images pdf to provide visual cues and insights. Share and navigate important information on thirteen stages that need your due attention. This template can be used to pitch topics like introduction, public health system, hospitals tie ups, pharmaceutical industry, healthcare insurance firms, financial management, cost accounting, collection and analysis, healthcare industry key challenges. In addition, this PPT design contains high-resolution images, graphics, etc, that are easily editable and available for immediate download.
Mode Of Finance Description Sample Ppt PowerPoint Presentation Example 2015
This is a mode of finance description sample ppt powerpoint presentation example 2015. This is a four stage process. The stages in this process are mode of finance, financial description, financial modes.

Company Cash Flow Statement Over Years Ppt PowerPoint Presentation Gallery
This is a company cash flow statement over years ppt powerpoint presentation gallery. This is ten stage process. The stages in this process are financial result, financial position, share capital, equity share data.

Business Evacuation Plan Table Of Contents Ppt PowerPoint Presentation File Background PDF
Presenting this set of slides with name business evacuation plan table of contents ppt powerpoint presentation file background pdf. The topics discussed in these slides are introduction, moving ahead towards exit stage, initial public offering, management buyout, projected financial performance, valuation, strategic acquisition third party, comparative analysis between exit options . This is a completely editable PowerPoint presentation and is available for immediate download. Download now and impress your audience.

Business Diagram Battery Connected With Bulb For Idea Generation PowerPoint Slide
This business slide displays battery icon connected with bulb. This diagram is a data visualization tool that gives you a simple way to present statistical information. This slide helps your audience examine and interpret the data you present.
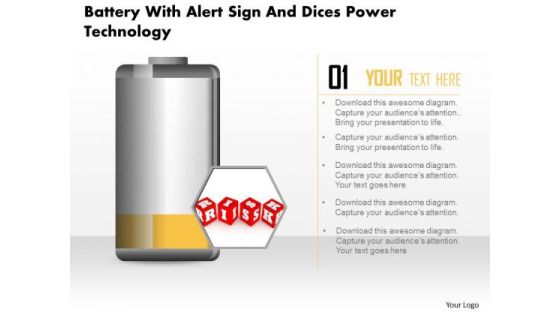
Business Diagram Battery With Alert Sign And Dices Power Technology PowerPoint Slide
This business diagram displays risk alert on battery icon. Use this diagram, in your presentations to display energy saving, battery and technology. Create professional presentations using this diagram slide.

Business Diagram 3d Colorful Pie Graph With Magnifier Data Search PowerPoint Slide
This business slide displays 3d colorful pie graph with magnifier. This diagram is a data visualization tool that gives you a simple way to present statistical information. This slide helps your audience examine and interpret the data you present.

Business Diagram Data Driven Pie Chart Inside The Magnifier PowerPoint Slide
This business slide displays 3d colorful pie graph with magnifier. This diagram is a data visualization tool that gives you a simple way to present statistical information. This slide helps your audience examine and interpret the data you present.
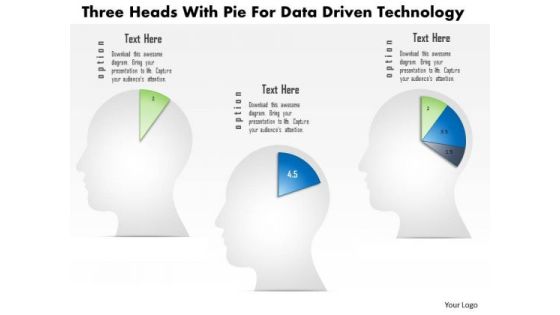
Business Diagram Three Heads With Pie For Data Driven Technology PowerPoint Slide
This business diagram displays three human faces with pie charts. This Power Point template has been designed to compare and present business data. You may use this diagram to impart professional appearance to your presentations.
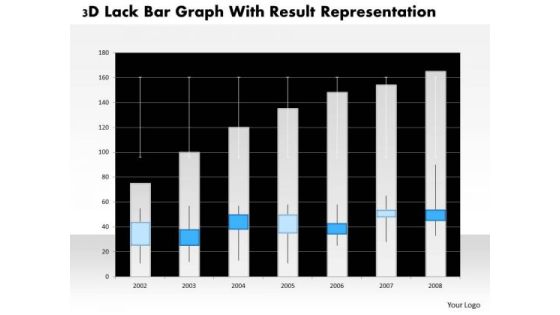
Business Diagram 3d Lack Bar Graph With Result Representation PowerPoint Slide
This business diagram has graphic of 3d lack bar graph. This diagram is a data visualization tool that gives you a simple way to present statistical information. This slide helps your audience examine and interpret the data you present.
Business Diagram Battery Icon With Power Icons Energy Technology PowerPoint Slide
This business diagram displays battery icon with power charging. Use this diagram, in your presentations to display energy saving, battery and technology. Create professional presentations using this diagram slide.
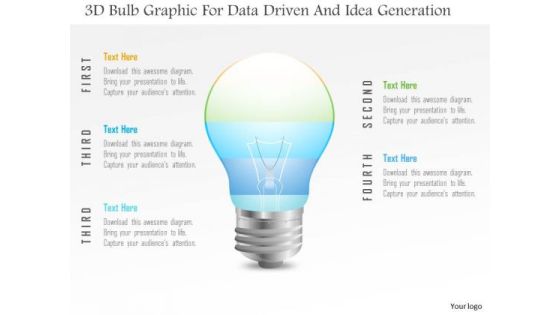
Business Diagram 3d Bulb Graphic For Data Driven And Idea Generation PowerPoint Slide
This Power Point template has been designed with 3d bulb graphic. Use this slide to represent technology idea and strategy concepts. Download this diagram for your business presentations and get exclusive comments on your efforts.
Business Diagram Green Battery Cell With Full Charging Symbol PowerPoint Slide
This business diagram displays full battery charge icon. Use this diagram, in your presentations to display energy saving, battery and technology. Create professional presentations using this diagram slide.
Business Diagram Battery With Empty Sign For Power Generation PowerPoint Slide
This business diagram displays empty sign alert on battery icon. Use this diagram, in your presentations to display energy saving, battery and technology. Create professional presentations using this diagram slide.
Business Diagram Hour Glass With 3d Man And Icons PowerPoint Slide
This diagram displays 3d man with hour glass and icons. This diagram contains concept of communication and technology. Use this diagram to display business process workflows in any presentations.

Business Diagram Flask With Data Driven Chart PowerPoint Slide
This data driven diagram has been designed with flask graphics. Download this diagram to give your presentations more effective look. It helps in clearly conveying your message to clients and audience.

Business Diagram Laptop With Data Driven Area Chart PowerPoint Slide
This diagram has been designed with laptop and data driven area chart. Download this diagram to give your presentations more effective look. It helps in clearly conveying your message to clients and audience.
Business Diagram 3d Capsule With Multiple Icons For Business Data Flow PowerPoint Slide
This diagram has been designed with 3d graphic of capsule with multiple icons. This data driven PowerPoint slide can be used to give your presentations more effective look. It helps in clearly conveying your message to clients and audience.

Business Diagram 3d Thumb Chart And Tablet For Data Representation PowerPoint Slide
This business diagram displays graphic of 3d thumb up chart with icons on computer screen. This business slide contains the concept of business data representation. Use this diagram to build professional presentations for your viewers.
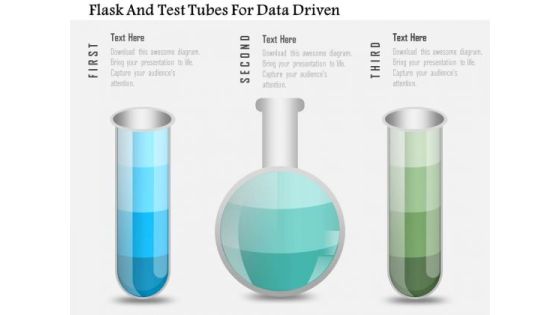
Business Diagram Flask And Test Tubes For Data Driven PowerPoint Slide
This data driven diagram has been designed with flask and test tubes. Download this diagram to give your presentations more effective look. It helps in clearly conveying your message to clients and audience.

Business Diagram Two Tablets With Growth Bar Graph Data Driven PowerPoint Slide
This business diagram has been designed with comparative charts on tablets. This slide suitable for data representation. You can also use this slide to present business reports and information. Use this diagram to present your views in a wonderful manner.
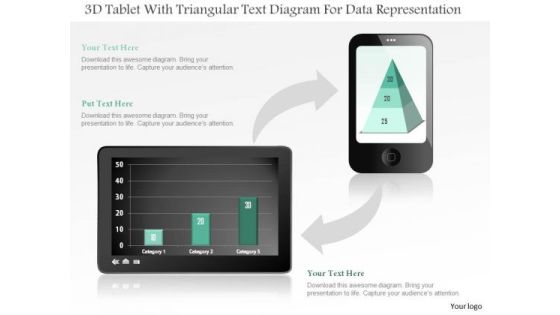
Business Diagram 3d Tablet With Triangular Text Diagram For Data Representation PowerPoint Slide
This business diagram displays bar graph on tablet and pyramid chart on mobile phone. Use this diagram, to make reports for interactive business presentations. Create professional presentations using this diagram.
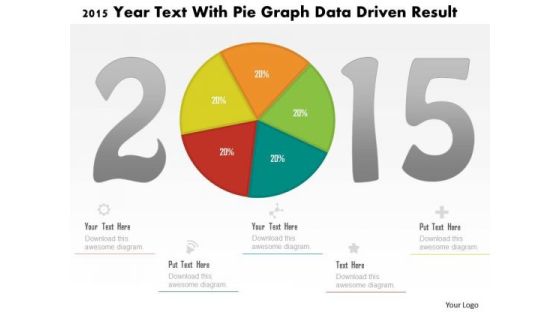
Business Diagram 2015 Year Text With Pie Graph Data Driven Result PowerPoint Slide
This business diagram displays 2015 year numbers with pie chart. This diagram is suitable to display business strategy for year 2015. Download this professional slide to present information in an attractive manner
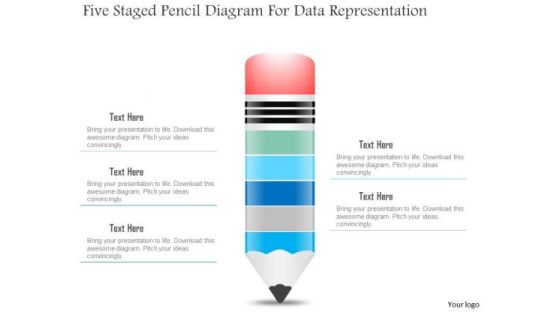
Business Diagram Five Staged Pencil Diagram For Data Representation PowerPoint Slide
This business slide displays five staged pencil diagram. It contains pencil graphic divided into five parts. This diagram slide depicts processes, stages, steps, points, options and education information display. Use this diagram, in your presentations to express your views innovatively.
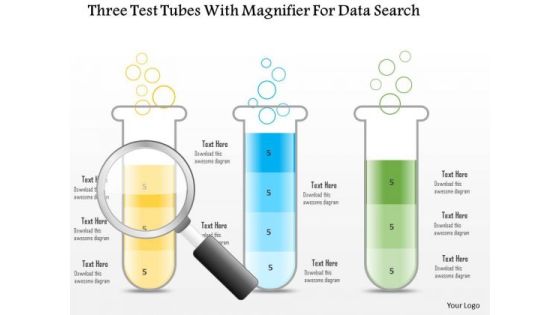
Business Diagram Three Test Tubes With Magnifier For Data Search PowerPoint Slide
This business diagram displays three test tubes with magnifying glass. This diagram is suitable to depict flow of business activities or steps. Download this professional slide to present information in an attractive manner.

Business Diagram Three Trucks For Data Representation For Business PowerPoint Slide
This business diagram displays three trucks graphic. This diagram contains trucks for percentage value growth. Use this diagram to display business growth over a period of time.

Business Diagram Human Mind Diagram With Pie Graph For Representation PowerPoint Slide
This diagram displays human face graphic divided into sections. This section can be used for data display. Use this diagram to build professional presentations for your viewers.

Business Diagram Six Staged Pie Charts For Text Representation PowerPoint Slide
This slide displays graphic six staged pie charts. Download this diagram to present and compare business data. Use this diagram to display business process workflows in any presentation.
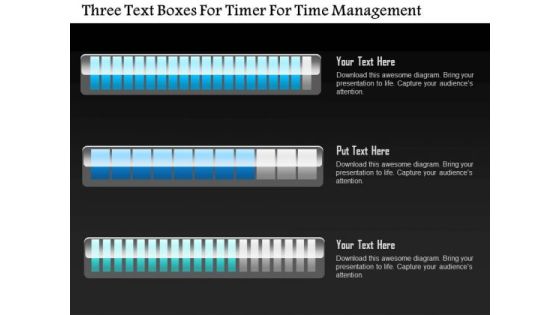
Business Diagram Three Text Boxes For Timer For Time Management PowerPoint Slide
This business diagram displays three text boxes. This diagram contains text boxes for data representation. Use this diagram to display business process workflows in any presentations.
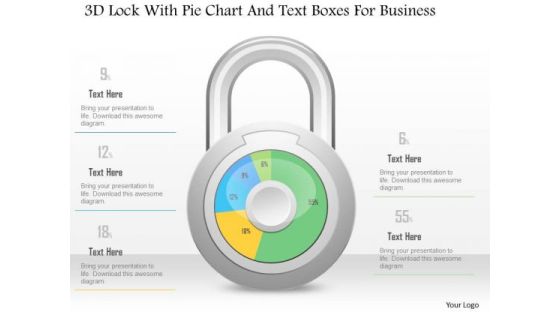
Business Diagram 3d Lock With Pie Chart And Text Boxes For Business PowerPoint Slide
This Power Point diagram has been crafted with pie chart in shape of lock. It contains diagram of lock pie chart to compare and present data in an effective manner. Use this diagram to build professional presentations for your viewers.

Business Diagram 3d Lock With Pie Graph For Result Representation PowerPoint Slide
This Power Point diagram has been crafted with pie chart in shape of lock. It contains diagram of lock pie chart to compare and present data in an effective manner. Use this diagram to build professional presentations for your viewers.

Business Diagram 3d Pencil With Text Boxes For Representation PowerPoint Slide
This Power Point diagram displays graphic of pencil with icons and text spaces. It contains diagram of colorful pencil for data display. Use this diagram to build professional presentations for your viewers.
Business Diagram Human Icons With Bubbles And Different Icons Inside PowerPoint Slide
This diagram displays graph with percentage value growth. This business slide is suitable to present and compare business data. Use this diagram to build professional presentations for your viewers.

Business Diagram Three Staged Pencil Diagram For Graph Formation PowerPoint Slide
This business diagram displays set of pencils. This Power Point template has been designed to compare and present business data. Download this diagram to represent stages of business growth.

Business Diagram Five Staged Timeline Diagram For Business PowerPoint Slide
This PowerPoint template displays five points timeline diagram. This business diagram has been designed with graphic of timeline with five points, text space and start, end points. Use this diagram, in your presentations to display process steps, stages, timelines and business management. Make wonderful presentations using this business slide.
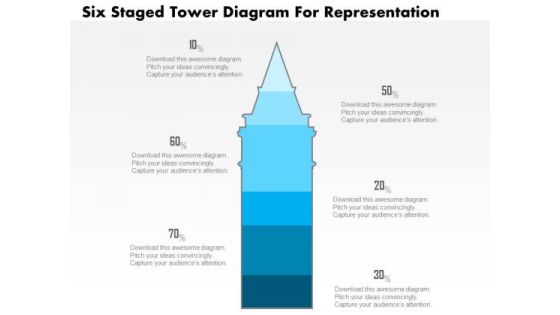
Business Diagram Five Staged Tower Diagram For Representation PowerPoint Slide
This business slide displays five staged tower diagram. It contains blue tower graphic divided into five parts. This diagram slide depicts processes, stages, steps, points, options information display. Use this diagram, in your presentations to express your views innovatively.
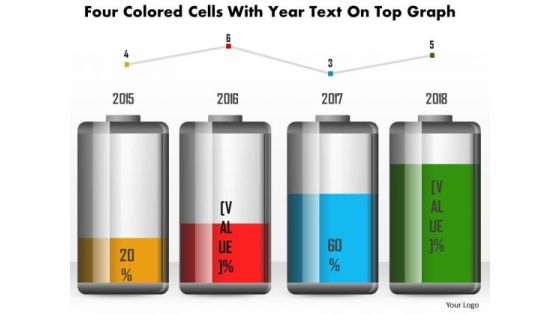
Business Diagram Four Colored Cells With Year Text On Top Graph PowerPoint Slide
This business diagram has been designed with battery cell graphic for business timeline. This slide can be used for business planning and management. Use this diagram for your business and success milestones related presentations.
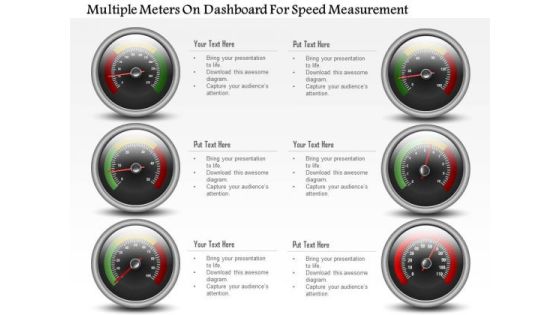
Business Diagram Multiple Meters On Dashboard For Speed Measurement PowerPoint Slide
This business diagram has been designed with multiple meters on dashboard. This slide can be used for business planning and progress. Use this diagram for your business and success milestones related presentations.

Business Diagram Four Steps With 3d Business Person Standing Over It PowerPoint Slide
This business diagram displays bar graph with business person standing on it. This Power Point template has been designed to display personal growth. You may use this diagram to impart professional appearance to your presentations.

Customer Traction Ppt PowerPoint Presentation Information
This is a customer traction ppt powerpoint presentation information. This is a four stage process. The stages in this process are signed up, visited signup page, traffic, impressions, funnel.
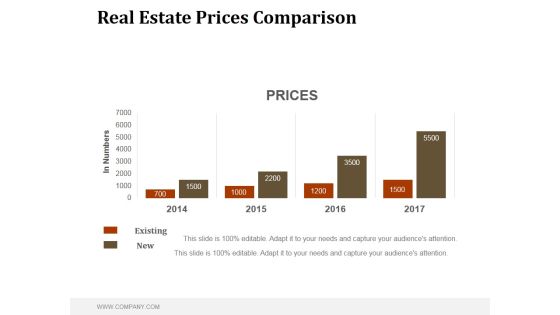
Real Estate Prices Comparison Ppt PowerPoint Presentation Example File
This is a real estate prices comparison ppt powerpoint presentation example file. This is a four stage process. The stages in this process are business, marketing, management, comparison, prices.
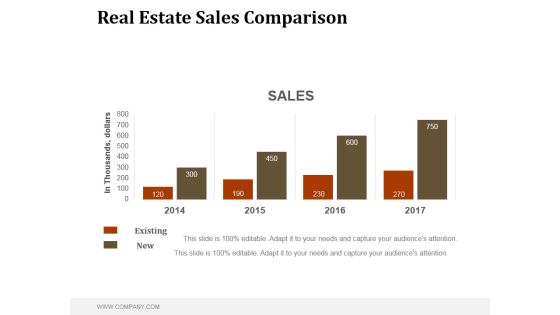
Real Estate Sales Comparison Ppt PowerPoint Presentation Good
This is a real estate sales comparison ppt powerpoint presentation good. This is a four stage process. The stages in this process are business, marketing, management, sales, comparison.
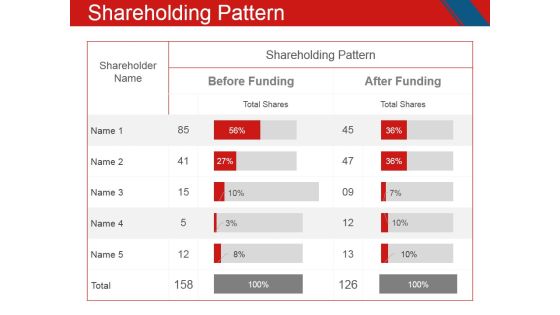
Shareholding Pattern Ppt PowerPoint Presentation Model Microsoft
This is a shareholding pattern ppt powerpoint presentation model microsoft. This is a two stage process. The stages in this process are shareholder name, shareholding pattern, before funding, after funding.

Dashboard Ppt PowerPoint Presentation Gallery Layouts
This is a dashboard ppt powerpoint presentation gallery layouts. This is a two stage process. The stages in this process are speed, meter, business, marketing, equipment.

Comparison Ppt PowerPoint Presentation Portfolio Inspiration
This is a comparison ppt powerpoint presentation portfolio inspiration. This is a two stage process. The stages in this process are business, marketing, comparison, finance, management.

COVID 19 Effect Management Strategies Sports Determine Critical Functions Performed Risk Managers Using ERM Topics PDF
Presenting this set of slides with name covid 19 effect management strategies sports determine critical functions performed risk managers using erm topics pdf. The topics discussed in these slides are analysis, management, business, insurance, financial. This is a completely editable PowerPoint presentation and is available for immediate download. Download now and impress your audience.

Automation Techniques And Solutions For Business Ppt PowerPoint Presentation Complete Deck With Slides
Presenting this set of slides with name automation techniques and solutions for business ppt powerpoint presentation complete deck with slides. The topics discussed in these slides are analysis, strategy, optimization, techniques, financial. This is a completely editable PowerPoint presentation and is available for immediate download. Download now and impress your audience.

Benefits Of Business Process Automation Ppt PowerPoint Presentation Complete Deck With Slides
Presenting this set of slides with name benefits of business process automation ppt powerpoint presentation complete deck with slides. The topics discussed in these slides are analysis, techniques, strategy, optimization, financial. This is a completely editable PowerPoint presentation and is available for immediate download. Download now and impress your audience.

4 Expected Source For Finance Ppt PowerPoint Presentation Tips
This is a 4 expected source for finance ppt powerpoint presentation tips. This is a four stage process. The stages in this process are financial modes, mode of finance.
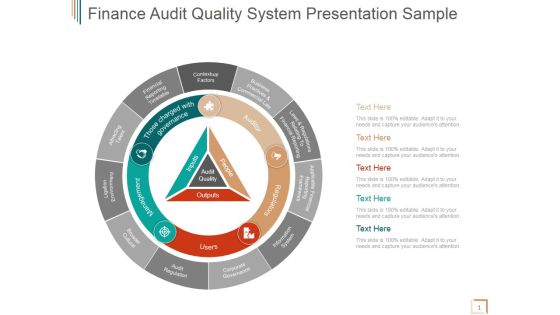
Finance Audit Quality System Ppt PowerPoint Presentation Slides
This is a finance audit quality system ppt powerpoint presentation slides. This is a six stage process. The stages in this process are contextual factors, financial reporting timetable, attracting talent, ligation environment, broader cultural, audit regulation.

Data Analytics Ppt PowerPoint Presentation Graphics
This is a data analytics ppt powerpoint presentation graphics. This is a five stage process. The stages in this process are data analysis, business, marketing, success, graph.
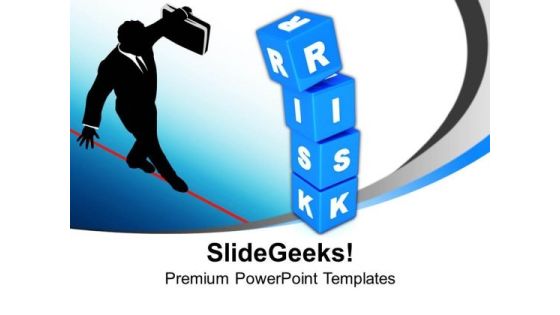
Risk Cubes Business PowerPoint Templates And PowerPoint Themes 1112
Risk Cubes Business PowerPoint Templates And PowerPoint Themes 1112-This PowerPoint template with colorful bricks with letters on it, designed in blue colors, will be a terrific choice for presentations on financial risks, risks management, risk analysis, risk assessment, mitigation of risk, market risk, credit risk, liquidity risk , etc. Also use this template for presentations on breaking limits, taking risks, risk management, uncertainty on objectives, realization of opportunities, uncertainty in financial markets, project credit risk etc.-Risk Cubes Business PowerPoint Templates And PowerPoint Themes 1112-This PowerPoint template can be used for presentations relating to-Render of risk cubes, Cubes, Business, People, Success, Competition

Monthly Run Revenue Ppt PowerPoint Presentation Deck
This is a monthly run revenue ppt powerpoint presentation deck. This is a four stage process. The stages in this process are Business, Marketing, Management, Revenue, Finance.

Revenue Dashboard Ppt PowerPoint Presentation Files
This is a revenue dashboard ppt powerpoint presentation files. This is a five stage process. The stages in this process are business, marketing, management, revenue, dashboard.
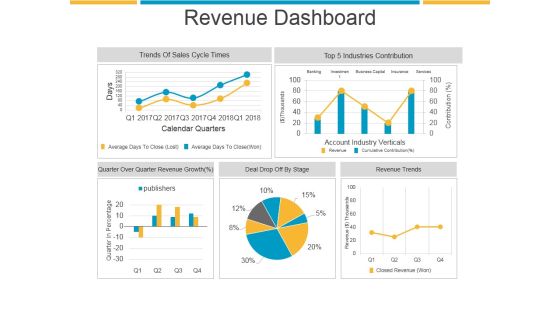
Revenue Dashboard Ppt PowerPoint Presentation Sample
This is a revenue dashboard ppt powerpoint presentation sample. This is a five stage process. The stages in this process are trends of sales cycle times, industries contribution, revenue trends, deal drop off by stage.

Revenue Model Ppt PowerPoint Presentation Visual Aids
This is a revenue model ppt powerpoint presentation visual aids. This is a five stage process. The stages in this process are business, marketing, management, finance, planning.

How Much Money We Need Ppt PowerPoint Presentation Outline
This is a how much money we need ppt powerpoint presentation outline. This is a three stage process. The stages in this process are business, marketing, management, production, sales.

Budgeting Planned Actual Comparison Ppt PowerPoint Presentation Infographic Template
This is a budgeting planned actual comparison ppt powerpoint presentation infographic template. This is a two stage process. The stages in this process are planned costs vs actual costs, deviation, actual costs, planned costs.
Production Costs Ppt PowerPoint Presentation Icon
This is a production costs ppt powerpoint presentation icon. This is a two stage process. The stages in this process are business, marketing, management, production, finance.

Sales Performance Dashboard Ppt PowerPoint Presentation Show
This is a sales performance dashboard ppt powerpoint presentation show. This is a four stage process. The stages in this process are lead sources revenue share, total sales by month, opportunities total sales by probability, win loss ratio.

Production Costs Template 1 Ppt PowerPoint Presentation Layout
This is a production costs template 1 ppt powerpoint presentation layout. This is a two stage process. The stages in this process are cots, product, business, marketing, strategy.

Data Analytics Ppt PowerPoint Presentation Themes
This is a data analytics ppt powerpoint presentation themes. This is a five stage process. The stages in this process are business, marketing, presentation, data analyst, management.

Acquisition Cost Per Customer Ppt PowerPoint Presentation Example 2015
This is a acquisition cost per customer ppt powerpoint presentation example 2015. This is a three stage process. The stages in this process are rising, steady, falling.
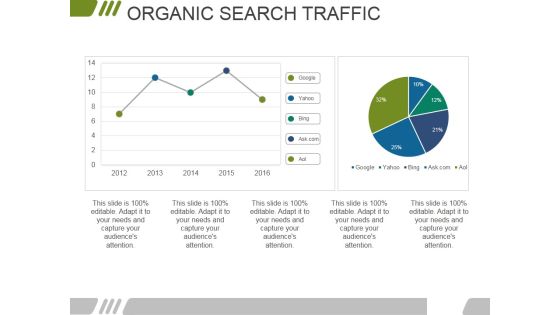
Organic Search Traffic Ppt PowerPoint Presentation Model Slideshow
This is a organic search traffic ppt powerpoint presentation model slideshow. This is a two stage process. The stages in this process are business, marketing, finance, management, organic.
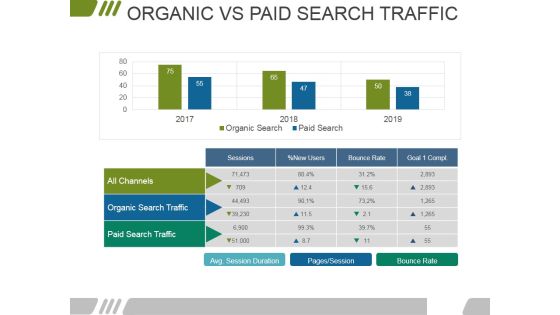
Organic Vs Paid Search Traffic Ppt PowerPoint Presentation Summary Visuals
This is a organic vs paid search traffic ppt powerpoint presentation summary visuals. This is a two stage process. The stages in this process are all channels, organic search traffic, paid search traffic, sessions, bounce rate.
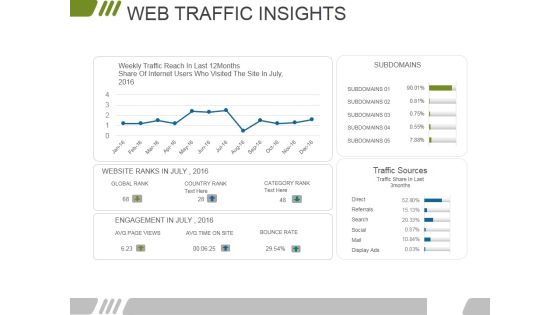
Web Traffic Insights Ppt PowerPoint Presentation Pictures Portrait
This is a web traffic insights ppt powerpoint presentation pictures portrait. This is a four stage process. The stages in this process are subdomains, traffic sources, category rank, country rank, global rank.
Website Performance Review Template 1 Ppt PowerPoint Presentation Slides Icons
This is a website performance review template 1 ppt powerpoint presentation slides icons. This is a three stage process. The stages in this process are online transaction, conversion rate, traffic source, site consumption time, organic branded.

Balance Sheet Kpis Template 1 Ppt PowerPoint Presentation Layouts Design Ideas
This is a balance sheet kpis template 1 ppt powerpoint presentation layouts design ideas. This is a four stage process. The stages in this process are current assets, current liabilities, total assets, total liabilities.

Analyze Results Ppt PowerPoint Presentation Guide
This is a analyze results ppt powerpoint presentation guide. This is a three stage process. The stages in this process are icon, percentage, finance, man, present.

Email Marketing Performance Ppt PowerPoint Presentation Layouts
This is a email marketing performance ppt powerpoint presentation layouts. This is a four stage process. The stages in this process are delivery rate, open rate, click rate, conversion rate.

Marketing Dashboard Ppt PowerPoint Presentation Templates
This is a marketing dashboard ppt powerpoint presentation templates. This is a two stage process. The stages in this process are business, marketing, management, finance, dashboard.

Operating Excellence Ppt PowerPoint Presentation Ideas
This is a operating excellence ppt powerpoint presentation ideas. This is a four stage process. The stages in this process are operating income, operating expenses, cash flow, capacity utilization.

Project Progress And Reasons For Delay Ppt PowerPoint Presentation Layout
This is a project progress and reasons for delay ppt powerpoint presentation layout. This is a two stage process. The stages in this process are business, marketing, management, progress, finance.

Our Channel Sales Numbers Ppt PowerPoint Presentation Pictures
This is a our channel sales numbers ppt powerpoint presentation pictures. This is a four stage process. The stages in this process are business, marketing, management, finance, planning.

Customer Trends Template 1 Ppt PowerPoint Presentation Diagrams
This is a customer trends template 1 ppt powerpoint presentation diagrams. This is a five stage process. The stages in this process are business, marketing, bar graph, finance, management.
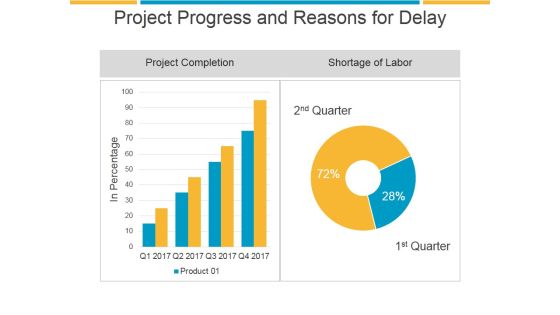
Project Progress And Reasons For Delay Ppt PowerPoint Presentation Gallery
This is a project progress and reasons for delay ppt powerpoint presentation gallery. This is a two stage process. The stages in this process are project completion, shortage of labor.

Area Stacked Ppt PowerPoint Presentation Show
This is a area stacked ppt powerpoint presentation show. This is a two stage process. The stages in this process are area, stacked, success, strategy, marketing, management.

Clustered Column Line Ppt PowerPoint Presentation Slides
This is a clustered column line ppt powerpoint presentation slides. This is a four stage process. The stages in this process are clustered, column, line, business, marketing.

Comparison Of Prices Ppt PowerPoint Presentation Tips
This is a comparison of prices ppt powerpoint presentation tips. This is a two stage process. The stages in this process are comparison, prices, brand, business, marketing.
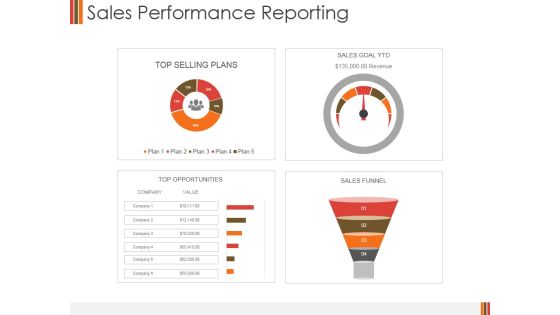
Sales Performance Reporting Ppt PowerPoint Presentation Slides Background Designs
This is a sales performance reporting ppt powerpoint presentation slides background designs. This is a four stage process. The stages in this process are top selling plans, sales goal ytd, top opportunities, sales funnel.

Key Performance Indicators Template 2 Ppt PowerPoint Presentation Layouts Portfolio
This is a key performance indicators template 2 ppt powerpoint presentation layouts portfolio. This is a four stage process. The stages in this process are objective, measures, targets, invites.
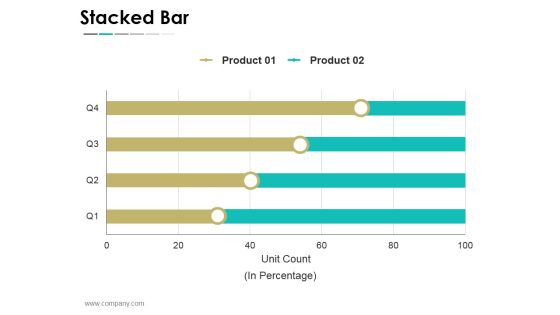
Stacked Bar Ppt PowerPoint Presentation Infographics Graphics
This is a stacked bar ppt powerpoint presentation infographics graphics. This is a four stage process. The stages in this process are business, strategy, marketing, success, unit count, in percentage.

Shareholder Value Management Ppt Powerpoint Images
This is a shareholder value management ppt powerpoint images. This is a nine stage process. The stages in this process are planning, budgeting and forecasting, strategic planning, business planning, budgeting, reporting and performance measurement, forecasting, reporting financial and operational, performance measurement, organizational alignment and accountability, analysis, monitor individual results, reward results.
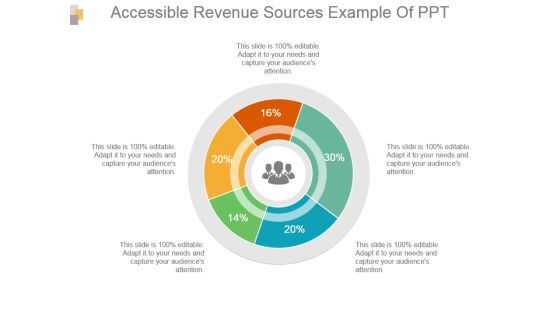
Accessible Revenue Sources Example Of Ppt
This is a accessible revenue sources example of ppt. This is a five stage process. The stages in this process are business, process, financial, percentage, revenue.
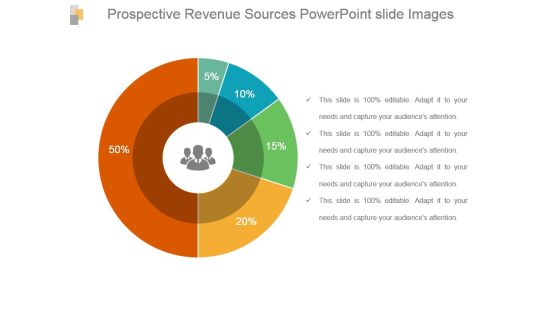
Prospective Revenue Sources Powerpoint Slide Images
This is a prospective revenue sources powerpoint slide images. This is a five stage process. The stages in this process are business, process, financial, percentage, revenue.
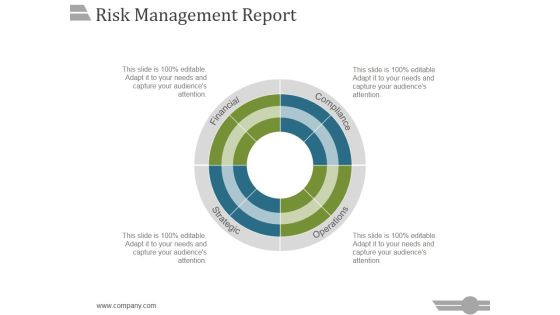
Risk Management Report Template 1 Ppt PowerPoint Presentation Inspiration
This is a risk management report template 1 ppt powerpoint presentation inspiration. This is a four stage process. The stages in this process are financial, compliance, strategic, operations.

Current Sources Of Revenue Ppt PowerPoint Presentation Gallery Information
This is a current sources of revenue ppt powerpoint presentation gallery information. This is a five stage process. The stages in this process are business, strategy, marketing, analysis, finance, icons.

Potential Sources Of Revenue Ppt PowerPoint Presentation Outline Display
This is a potential sources of revenue ppt powerpoint presentation outline display. This is a five stage process. The stages in this process are business, strategy, marketing, analysis, finance.
