AI PPT Maker
Templates
PPT Bundles
Design Services
Business PPTs
Business Plan
Management
Strategy
Introduction PPT
Roadmap
Self Introduction
Timelines
Process
Marketing
Agenda
Technology
Medical
Startup Business Plan
Cyber Security
Dashboards
SWOT
Proposals
Education
Pitch Deck
Digital Marketing
KPIs
Project Management
Product Management
Artificial Intelligence
Target Market
Communication
Supply Chain
Google Slides
Research Services
 One Pagers
All Categories
-
Home
- Customer Favorites
- Finance Kpi
Finance Kpi

Dashboards Key Metrics Of Performance Assessment Summary PDF
Deliver and pitch your topic in the best possible manner with this dashboards key metrics of performance assessment summary pdf. Use them to share invaluable insights on delivery adherence, customer complaints, returned volume and impress your audience. This template can be altered and modified as per your expectations. So, grab it now.

Impressive Performance Metrics Of Product Solution Rules PDF
Deliver and pitch your topic in the best possible manner with this impressive performance metrics of product solution rules pdf. Use them to share invaluable insights on revenue, growth, product and impress your audience. This template can be altered and modified as per your expectations. So, grab it now.

Various Key Metrics To Determine Customer Engagement Users Structure PDF
This slide provides information regarding questionnaire analysis on various parameters. Deliver an awe inspiring pitch with this creative various key metrics to determine customer engagement users structure pdf bundle. Topics like requirement, analysis, determining can be discussed with this completely editable template. It is available for immediate download depending on the needs and requirements of the user.
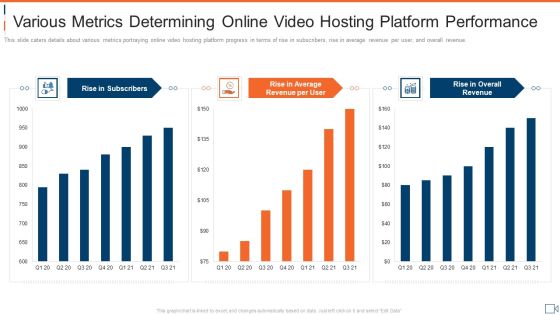
Various Metrics Determining Online Video Hosting Platform Performance Summary PDF
Deliver and pitch your topic in the best possible manner with this various metrics determining online video hosting platform performance summary pdf. Use them to share invaluable insights on rise in subscribers, rise in average, rise in overall revenue and impress your audience. This template can be altered and modified as per your expectations. So, grab it now.
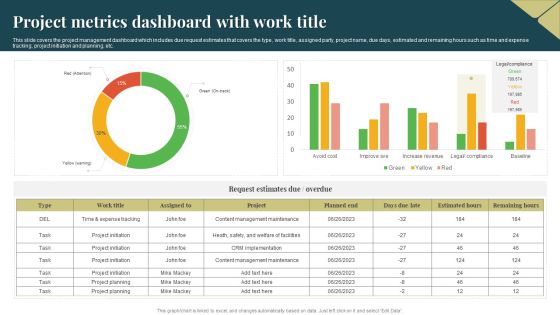
Project Metrics Dashboard With Work Title Sample PDF
Pitch your topic with ease and precision using this Project Metrics Dashboard With Work Title Sample PDF. This layout presents information on Implementation, Content Management, Project. It is also available for immediate download and adjustment. So, changes can be made in the color, design, graphics or any other component to create a unique layout.

Dashboard For Tracking Organizational OGSM Model Metrics Microsoft PDF
Pitch your topic with ease and precision using this Dashboard For Tracking Organizational OGSM Model Metrics Microsoft PDF. This layout presents information on Revenue, Market Share, Gross Margin. It is also available for immediate download and adjustment. So, changes can be made in the color, design, graphics or any other component to create a unique layout.

Defining Key Metrics To Analyse Current Sales Performance Rules PDF
The following slide showcases some metrics to evaluate existing sales performance due to execute effective risk management strategies. It includes elements such as opportunities, win rate, average time to win, average value per win, sales velocity etc. Do you know about Slidesgeeks Defining Key Metrics To Analyse Current Sales Performance Rules PDF These are perfect for delivering any kind od presentation. Using it, create PowerPoint presentations that communicate your ideas and engage audiences. Save time and effort by using our pre designed presentation templates that are perfect for a wide range of topic. Our vast selection of designs covers a range of styles, from creative to business, and are all highly customizable and easy to edit. Download as a PowerPoint template or use them as Google Slides themes.

Defining Key Metrics To Analyse Current Sales Performance Summary PDF
The following slide showcases some metrics to evaluate existing sales performance due to execute effective risk management strategies. It includes elements such as opportunities, win rate, average time to win, average value per win, sales velocity etc. Do you know about Slidesgeeks Defining Key Metrics To Analyse Current Sales Performance Summary PDF These are perfect for delivering any kind od presentation. Using it, create PowerPoint presentations that communicate your ideas and engage audiences. Save time and effort by using our pre designed presentation templates that are perfect for a wide range of topic. Our vast selection of designs covers a range of styles, from creative to business, and are all highly customizable and easy to edit. Download as a PowerPoint template or use them as Google Slides themes.

Project Metrics Dashboard With Overall Progress Brochure PDF
This slide covers the project management dashboard which includes risks, overdue tasks, employees over budget, workloads, planning, designing, development and testing with current target amount, launch date, usage of targeted amount, etc. Pitch your topic with ease and precision using this Project Metrics Dashboard With Overall Progress Brochure PDF. This layout presents information on Design, Planning, Development. It is also available for immediate download and adjustment. So, changes can be made in the color, design, graphics or any other component to create a unique layout.
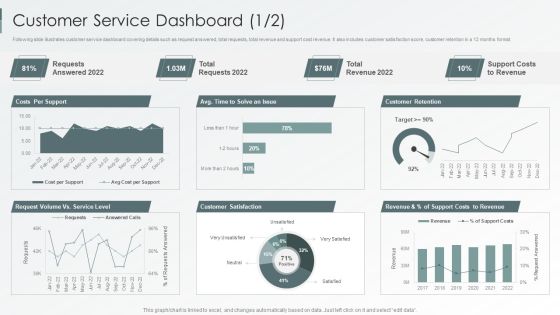
Enterprise Sustainability Performance Metrics Customer Service Dashboard Professional PDF
Following slide illustrates customer service dashboard covering details such as request answered, total requests, total revenue and support cost revenue. It also includes customer satisfaction score, customer retention in a 12 months format.Deliver and pitch your topic in the best possible manner with this Enterprise Sustainability Performance Metrics Customer Service Dashboard Professional PDF. Use them to share invaluable insights on Customer Satisfaction, Customer Retention, Support Revenue and impress your audience. This template can be altered and modified as per your expectations. So, grab it now.

Deploying Online Marketing Metric Dashboard Showcasing Brand Performance Microsoft PDF
This slide represents brand promotion dashboard highlighting performance post digital marketing. It includes sales quantity, return quantity, cost of goods, return amount etc. From laying roadmaps to briefing everything in detail, our templates are perfect for you. You can set the stage with your presentation slides. All you have to do is download these easy-to-edit and customizable templates. Deploying Online Marketing Metric Dashboard Showcasing Brand Performance Microsoft PDF will help you deliver an outstanding performance that everyone would remember and praise you for. Do download this presentation today.
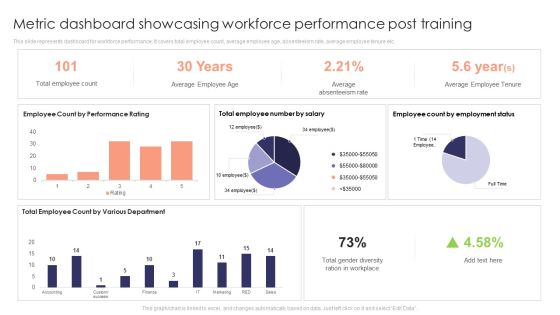
Metric Dashboard Showcasing Workforce Performance Post Training Ideas PDF
This slide represents dashboard for workforce performance. It covers total employee count, average employee age, absenteeism rate, average employee tenure etc. If you are looking for a format to display your unique thoughts, then the professionally designed Metric Dashboard Showcasing Workforce Performance Post Training Ideas PDF is the one for you. You can use it as a Google Slides template or a PowerPoint template. Incorporate impressive visuals, symbols, images, and other charts. Modify or reorganize the text boxes as you desire. Experiment with shade schemes and font pairings. Alter, share or cooperate with other people on your work. Download Metric Dashboard Showcasing Workforce Performance Post Training Ideas PDF and find out how to give a successful presentation. Present a perfect display to your team and make your presentation unforgettable.

Digital Marketing Toolkit Email Marketing Transformation Success Metrics Portrait PDF
This slide covers the metrics used to measure email marketing success rate such as click through rate, conversion rate, click to open rate, lead generation, unsubscribes rate, bounce rate and many more. Are you in need of a template that can accommodate all of your creative concepts This one is crafted professionally and can be altered to fit any style. Use it with Google Slides or PowerPoint. Include striking photographs, symbols, depictions, and other visuals. Fill, move around, or remove text boxes as desired. Test out color palettes and font mixtures. Edit and save your work, or work with colleagues. Download Digital Marketing Toolkit Email Marketing Transformation Success Metrics Portrait PDF and observe how to make your presentation outstanding. Give an impeccable presentation to your group and make your presentation unforgettable.

Measuring Influencer Marketing ROI Metric Brand Engagement Total Themes PDF
Analyze which posts drew the best engagement likes and comments. The feedback by customers help you gauge customers reactions to your products. Deliver an awe-inspiring pitch with this creative measuring influencer marketing roi metric brand engagement total themes pdf bundle. Topics like engagement over time, total engagement, engagement by content type can be discussed with this completely editable template. It is available for immediate download depending on the needs and requirements of the user.
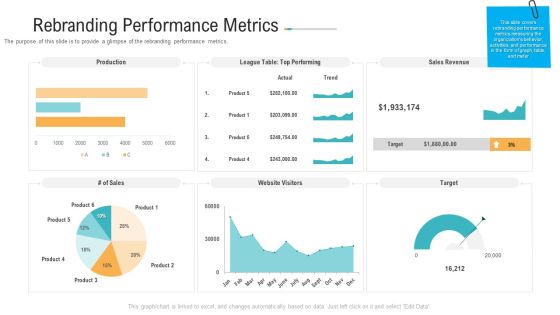
Rebranding Performance Metrics Ppt PowerPoint Presentation Pictures Shapes PDF
The purpose of this slide is to provide a glimpse of the sales projections and forecasting after rebranding.Deliver and pitch your topic in the best possible manner with this rebranding performance metrics ppt powerpoint presentation pictures shapes pdf. Use them to share invaluable insights on product, 2019 to 2021 and impress your audience. This template can be altered and modified as per your expectations. So, grab it now.

Dashboards Key Metrics Of Performance Assessment Ppt Model Skills PDF
This slide shows the various performance assessment parameters of the consultancy company which includes availability, performance, maintenance, delivery adherence and trends. Deliver and pitch your topic in the best possible manner with this dashboards key metrics of performance assessment ppt model skills pdf. Use them to share invaluable insights on customers groups, performance, customer complaints and impress your audience. This template can be altered and modified as per your expectations. So, grab it now.

Risk Metrics Dashboard And Mitigation Expenditure Dashboard Ideas PDF
This slide illustrates facts and figures of expenditure incurred on different risks. It includes financial risk, operational risks and competition risks. Pitch your topic with ease and precision using this Risk Metrics Dashboard And Mitigation Expenditure Dashboard Ideas PDF. This layout presents information on Management, Expenditure, Risk. It is also available for immediate download and adjustment. So, changes can be made in the color, design, graphics or any other component to create a unique layout.
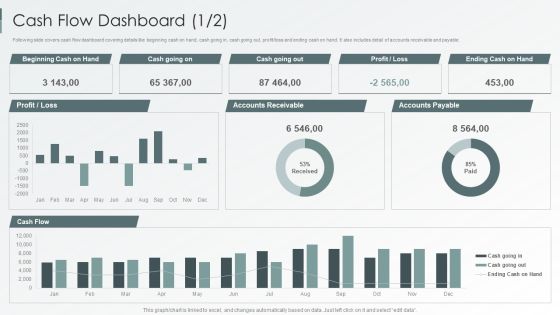
Enterprise Sustainability Performance Metrics Cash Flow Dashboard Inspiration PDF
Following slide covers cash flow dashboard covering details like beginning cash on hand, cash going in, cash going out, profit loss and ending cash on hand. It also includes detail of accounts receivable and payable.Deliver an awe inspiring pitch with this creative Enterprise Sustainability Performance Metrics Cash Flow Dashboard Inspiration PDF bundle. Topics like Accounts Receivable, Accounts Payable, Profit Loss can be discussed with this completely editable template. It is available for immediate download depending on the needs and requirements of the user.
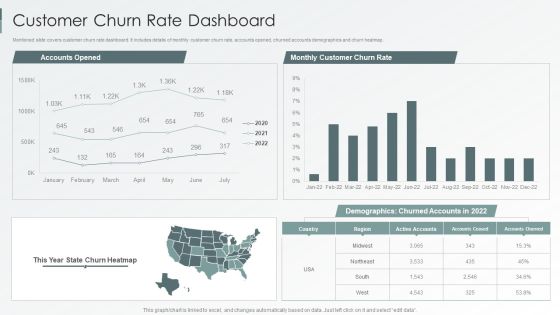
Enterprise Sustainability Performance Metrics Customer Churn Rate Dashboard Summary PDF
Mentioned slide covers customer churn rate dashboard. It includes details of monthly customer churn rate, accounts opened, churned accounts demographics and churn heatmap.Deliver an awe inspiring pitch with this creative Enterprise Sustainability Performance Metrics Customer Churn Rate Dashboard Summary PDF bundle. Topics like Accounts Opened, Demographics Churned, Monthly Customer can be discussed with this completely editable template. It is available for immediate download depending on the needs and requirements of the user.
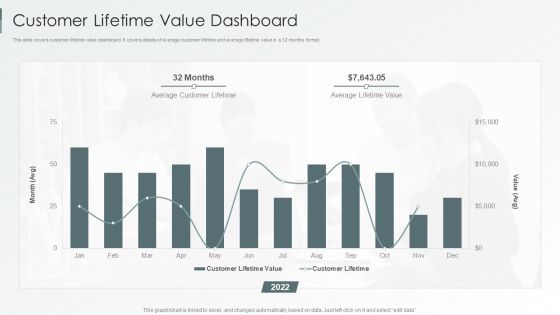
Enterprise Sustainability Performance Metrics Customer Lifetime Value Dashboard Graphics PDF
This slide covers customer lifetime value dashboard. It covers details of average customer lifetime and average lifetime value in a 12 months format.Deliver and pitch your topic in the best possible manner with this Enterprise Sustainability Performance Metrics Customer Lifetime Value Dashboard Graphics PDF. Use them to share invaluable insights on Average Customer, Lifetime Value, Customer Lifetime and impress your audience. This template can be altered and modified as per your expectations. So, grab it now.
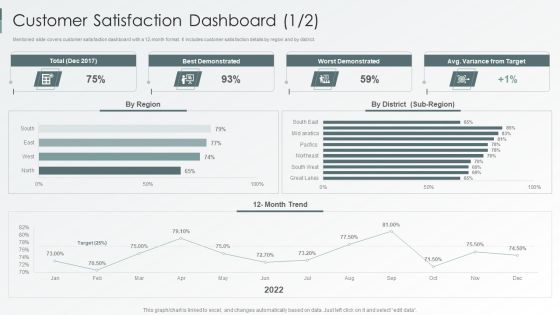
Enterprise Sustainability Performance Metrics Customer Satisfaction Dashboard Designs PDF
Mentioned slide covers customer satisfaction dashboard with a 12-month format. It includes customer satisfaction details by region and by district. Deliver an awe inspiring pitch with this creative Enterprise Sustainability Performance Metrics Customer Satisfaction Dashboard Designs PDF bundle. Topics like Best Demonstrated, Worst Demonstrated, Variance Target can be discussed with this completely editable template. It is available for immediate download depending on the needs and requirements of the user.

Enterprise Sustainability Performance Metrics Financial Performance Indicator Dashboard Themes PDF
This slide shows financial performance indicator dashboard covering net profit and net sales, profitability indicator ratios, cogs and net profit by region or channel.Deliver an awe inspiring pitch with this creative Enterprise Sustainability Performance Metrics Financial Performance Indicator Dashboard Themes PDF bundle. Topics like Profitability Indicator, Sold Breakdown, Target Actual can be discussed with this completely editable template. It is available for immediate download depending on the needs and requirements of the user.
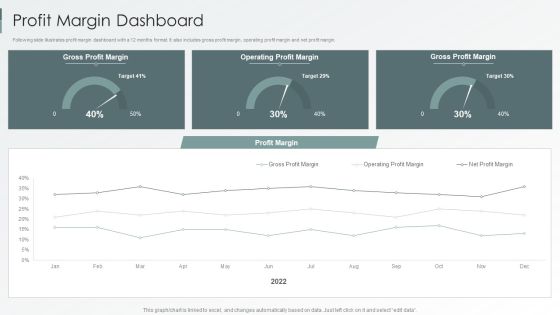
Enterprise Sustainability Performance Metrics Profit Margin Dashboard Brochure PDF
Following slide illustrates profit margin dashboard with a 12 months format. It also includes gross profit margin, operating profit margin and net profit margin.Deliver an awe inspiring pitch with this creative Enterprise Sustainability Performance Metrics Profit Margin Dashboard Brochure PDF bundle. Topics like Gross Profit, Margin Operating, Profit Margin can be discussed with this completely editable template. It is available for immediate download depending on the needs and requirements of the user.

Human Capital Metrics For New Hire Ppt Pictures Brochure PDF
This graph or chart is linked to excel, and changes automatically based on data. Just left click on it and select Edit Data. Pitch your topic with ease and precision using this Human Capital Metrics For New Hire Ppt Pictures Brochure PDF. This layout presents information on Active Employee Count, New Hire Count, New Hire. It is also available for immediate download and adjustment. So, changes can be made in the color, design, graphics or any other component to create a unique layout.
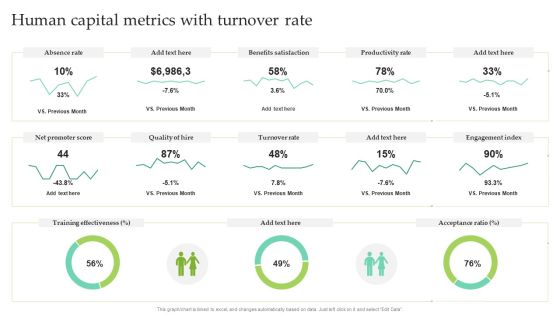
Human Capital Metrics With Turnover Rate Ppt Pictures Outline PDF
This graph or chart is linked to excel, and changes automatically based on data. Just left click on it and select Edit Data. Pitch your topic with ease and precision using this Human Capital Metrics With Turnover Rate Ppt Pictures Outline PDF. This layout presents information on Absence Rate, Benefits Satisfaction, Productivity Rate. It is also available for immediate download and adjustment. So, changes can be made in the color, design, graphics or any other component to create a unique layout.
Market Penetration Dashboard With Sales Metrics Ppt Icon Examples PDF
This slide shows market penetration dashboard for sales team. It provides information about regions, emerging markets, planned sales, actual sales, revenue, gender wise sales, etc. Pitch your topic with ease and precision using this Market Penetration Dashboard With Sales Metrics Ppt Icon Examples PDF. This layout presents information on Emerging Markets, Sales Gender, Actual Sales. It is also available for immediate download and adjustment. So, changes can be made in the color, design, graphics or any other component to create a unique layout.

Dashboard For Project Stakeholder Engagement And Management Metrics Brochure PDF
This slide showcases a dashboard for project stakeholders illustrating KPIs for measurement. It includes types of stakeholders, stakeholder receptiveness etc. Pitch your topic with ease and precision using this Dashboard For Project Stakeholder Engagement And Management Metrics Brochure PDF. This layout presents information on Types Of Stakeholders, Receptiveness, Number Of Stakeholders. It is also available for immediate download and adjustment. So, changes can be made in the color, design, graphics or any other component to create a unique layout.

Hotel Operations Management Software Key Metrics Dashboard Inspiration PDF
The slide includes a dashboard of hotel property management system that provides information about check in guests , reservations, housekeeping and other KPIs at a glance. Pitch your topic with ease and precision using this Hotel Operations Management Software Key Metrics Dashboard Inspiration PDF. This layout presents information on Reservations, Housekeeping, Occupancy. It is also available for immediate download and adjustment. So, changes can be made in the color, design, graphics or any other component to create a unique layout.
Pareto Analysis Shipping Tracking Metrics Dashboard Guidelines PDF
This slide showcases dashboard for analyzing on-time delivery trends. It also includes KPIs such as Pareto analysis and on-time deliveries by shipping organizations. Pitch your topic with ease and precision using this Pareto Analysis Shipping Tracking Metrics Dashboard Guidelines PDF. This layout presents information on Pareto Analysis, Deliveries Trends, Shipping Organization. It is also available for immediate download and adjustment. So, changes can be made in the color, design, graphics or any other component to create a unique layout.

Project Metrics Dashboard With Outstanding Issues Themes PDF
This slide shows the project management dashboard which includes the status, ongoing activities such as building system and interface, preparing quality standards, issues such as finding test manager, descoping risky items with burndown chart, timeline, etc. Showcasing this set of slides titled Project Metrics Dashboard With Outstanding Issues Themes PDF. The topics addressed in these templates are Quality, System, Project Timeline. All the content presented in this PPT design is completely editable. Download it and make adjustments in color, background, font etc. as per your unique business setting.
Project Metrics Dashboard With Revenues And Expenses Icons PDF
This slide shows the project management dashboard which covers the name, priorities, indicators and status which includes strategic priorities, research and development, administration, performance management, etc. With purchases in last 30 days and tasks. Showcasing this set of slides titled Project Metrics Dashboard With Revenues And Expenses Icons PDF. The topics addressed in these templates are Performance Management, Research And Development, Strategic Priorities. All the content presented in this PPT design is completely editable. Download it and make adjustments in color, background, font etc. as per your unique business setting.
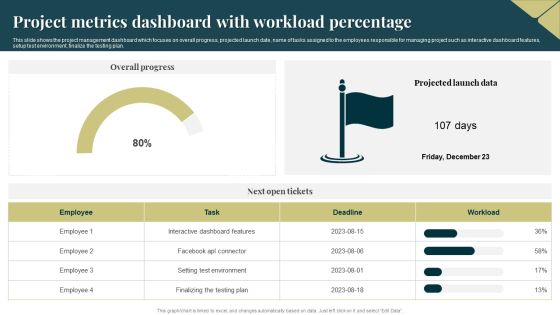
Project Metrics Dashboard With Workload Percentage Ideas PDF
This slide shows the project management dashboard which focuses on overall progress, projected launch date, name of tasks assigned to the employees responsible for managing project such as interactive dashboard features, setup test environment, finalize the testing plan. Showcasing this set of slides titled Project Metrics Dashboard With Workload Percentage Ideas PDF. The topics addressed in these templates are Environment, Plan, Dashboard. All the content presented in this PPT design is completely editable. Download it and make adjustments in color, background, font etc. as per your unique business setting.

Dashboard For Email Communication Kpis Metrics Topics PDF
This slide showcases email communication KPIs and dashboard that can help to keep track of performance of email marketing campaign. Its key elements are number of campaign, total recipients, average open percent and average click percent. Showcasing this set of slides titled Dashboard For Email Communication Kpis Metrics Topics PDF. The topics addressed in these templates are Number Campaigns, Total Recipients, Engagement Distribution. All the content presented in this PPT design is completely editable. Download it and make adjustments in color, background, font etc. as per your unique business setting.

Change Metrics Showcasing Time Consumption Analysis By Status Clipart PDF
This slide showcases dashboard to analyze and monitor overall time consumption by various change cases in the organization. It includes elements such as escalated, solution proposed, waiting for customer approval, etc. Showcasing this set of slides titled Change Metrics Showcasing Time Consumption Analysis By Status Clipart PDF The topics addressed in these templates are Consuming, Status Analysis, Record Count. All the content presented in this PPT design is completely editable. Download it and make adjustments in color, background, font etc. as per your unique business setting.

Monthly Financial Metrics Dashboard With Income Statement Infographics PDF
This following slide displays kpis to communicate key financial information to both internal and external stakeholders. It further includes details such as OPEX ratio, revenue and COGS, income, expenses, etc. Showcasing this set of slides titled Monthly Financial Metrics Dashboard With Income Statement Infographics PDF. The topics addressed in these templates are Gross Profit Margin, Taxes, Revenue. All the content presented in this PPT design is completely editable. Download it and make adjustments in color, background, font etc. as per your unique business setting.

Call Center Metrics Ppt PowerPoint Presentation Complete Deck With Slides
If designing a presentation takes a lot of your time and resources and you are looking for a better alternative, then this Call Center Metrics Ppt PowerPoint Presentation Complete Deck With Slides is the right fit for you. This is a prefabricated set that can help you deliver a great presentation on the topic. All the thirteen slides included in this sample template can be used to present a birds eye view of the topic. These slides are also fully editable, giving you enough freedom to add specific details to make this layout more suited to your business setting. Apart from the content, all other elements like color, design, theme are also replaceable and editable. This helps in designing a variety of presentations with a single layout. Not only this, you can use this PPT design in formats like PDF, PNG, and JPG once downloaded. Therefore, without any further ado, download and utilize this sample presentation as per your liking.

Financial Forecast And Essential Metrics Dashboard Ppt File Show PDF
This slide elaborates about the multiple sources through which one can project about the growth and current status of the company. It includes lead conversion rate, monthly revenue , short term assets , net and gross profit margins, etc. Pitch your topic with ease and precision using this Financial Forecast And Essential Metrics Dashboard Ppt File Show PDF. This layout presents information on Monthly Revenue Growth, Short Term Assets, Overall Financial Performance, Net Profit Margin. It is also available for immediate download and adjustment. So, changes can be made in the color, design, graphics or any other component to create a unique layout.

Enterprise Sustainability Performance Metrics Employee Billable Hours Dashboard Information PDF
Following slide shows employee billable hours dashboard covering total hours capacity, allocated hours billable, total hours worked, and total billable hours worked for the assignment. It also includes details of each team member indulged for same assignment.Deliver an awe inspiring pitch with this creative Enterprise Sustainability Performance Metrics Employee Billable Hours Dashboard Information PDF bundle. Topics like Billable Worked, Allocated Billable, Total Capacity can be discussed with this completely editable template. It is available for immediate download depending on the needs and requirements of the user.

Enterprise Sustainability Performance Metrics Real Time Utilization Dashboard Portrait PDF
This slide covers real time utilization dashboard covering logged time such as billable, non-billable, estimated time and scheduled. It also include details of allotted hours to each employee and weekly hours for the assignment.Deliver and pitch your topic in the best possible manner with this Enterprise Sustainability Performance Metrics Real Time Utilization Dashboard Portrait PDF. Use them to share invaluable insights on Real Time, Utilization Dashboard and impress your audience. This template can be altered and modified as per your expectations. So, grab it now.

Project Metrics Dashboard With Due Tasks Microsoft PDF
This slide shows the project management dashboard which includes hours taken by client, account manager, service, actual working hours, description of services such as web programming, search engine optimization, graphic designing, etc. Pitch your topic with ease and precision using this Project Metrics Dashboard With Due Tasks Microsoft PDF. This layout presents information on Service, Optimization, Graphic Design. It is also available for immediate download and adjustment. So, changes can be made in the color, design, graphics or any other component to create a unique layout.
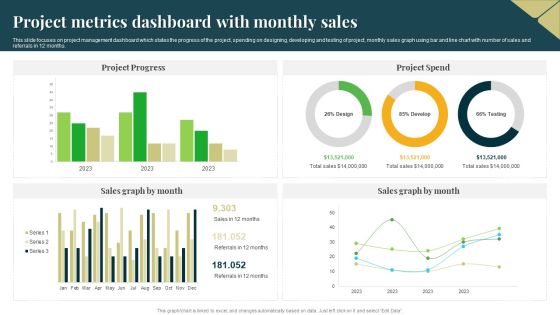
Project Metrics Dashboard With Monthly Sales Professional PDF
This slide focuses on project management dashboard which states the progress of the project, spending on designing, developing and testing of project, monthly sales graph using bar and line chart with number of sales and referrals in 12 months. Pitch your topic with ease and precision using this Project Metrics Dashboard With Monthly Sales Professional PDF. This layout presents information on Project Progress, Project Spend, Sales Graph. It is also available for immediate download and adjustment. So, changes can be made in the color, design, graphics or any other component to create a unique layout.
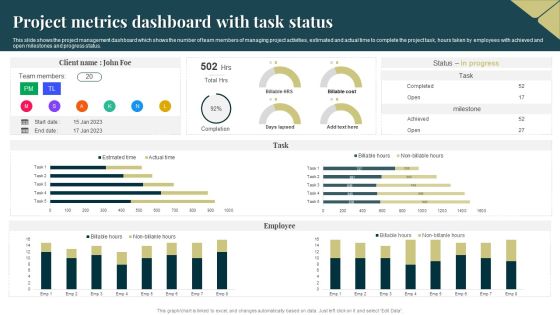
Project Metrics Dashboard With Task Status Rules PDF
This slide shows the project management dashboard which shows the number of team members of managing project activities, estimated and actual time to complete the project task, hours taken by employees with achieved and open milestones and progress status. Pitch your topic with ease and precision using this Project Metrics Dashboard With Task Status Rules PDF. This layout presents information on Team Members, Employee. It is also available for immediate download and adjustment. So, changes can be made in the color, design, graphics or any other component to create a unique layout.
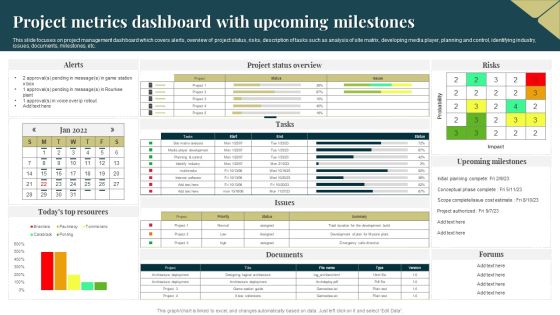
Project Metrics Dashboard With Upcoming Milestones Demonstration PDF
This slide focuses on project management dashboard which covers alerts, overview of project status, risks, description of tasks such as analysis of site matrix, developing media player, planning and control, identifying industry, issues, documents, milestones, etc. Pitch your topic with ease and precision using this Project Metrics Dashboard With Upcoming Milestones Demonstration PDF. This layout presents information on Probability, Project, Risks. It is also available for immediate download and adjustment. So, changes can be made in the color, design, graphics or any other component to create a unique layout.
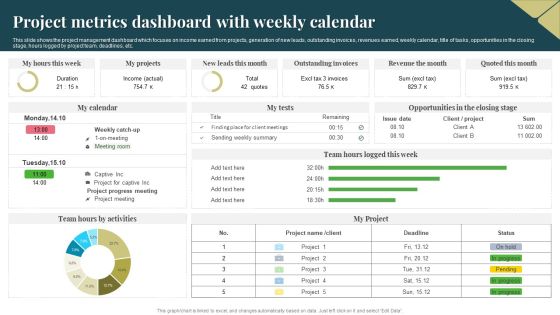
Project Metrics Dashboard With Weekly Calendar Download PDF
This slide shows the project management dashboard which focuses on income earned from projects, generation of new leads, outstanding invoices, revenues earned, weekly calendar, title of tasks, opportunities in the closing stage, hours logged by project team, deadlines, etc. Pitch your topic with ease and precision using this Project Metrics Dashboard With Weekly Calendar Download PDF. This layout presents information on Income, Revenue, Project. It is also available for immediate download and adjustment. So, changes can be made in the color, design, graphics or any other component to create a unique layout.

Learning And Development Metrics Overview Analysis Dashboard Graphics PDF
This slide shows dashboard of employees trained in different locations for learning and development activity. It includes elements such as total invited, total trained, unique trained, total active employees, total programs etc. Pitch your topic with ease and precision using this Learning And Development Metrics Overview Analysis Dashboard Graphics PDF. This layout presents information on Unique Trained YTD, Training Man Days, Total Programs. It is also available for immediate download and adjustment. So, changes can be made in the color, design, graphics or any other component to create a unique layout.
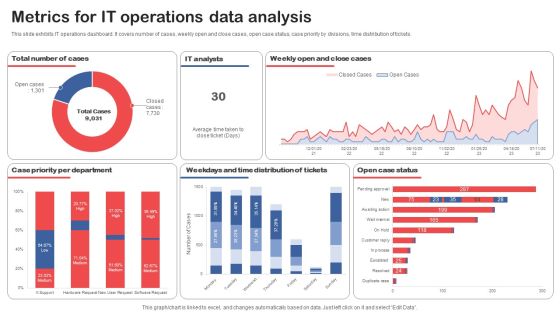
Metrics For IT Operations Data Analysis Topics PDF
This slide exhibits IT operations dashboard. It covers number of cases, weekly open and close cases, open case status, case priority by divisions, time distribution of tickets. Pitch your topic with ease and precision using this Metrics For IT Operations Data Analysis Topics PDF. This layout presents information on Case Priority Per Department, Distribution Of Tickets, Open Case Status. It is also available for immediate download and adjustment. So, changes can be made in the color, design, graphics or any other component to create a unique layout.

Change Management Metrics With Requests By Team Designs PDF
This slide display dashboard for real- time tracking of important change KPIs for the company. It includes details such as awaiting approval, closed on time, emergency, levels of support, etc. Pitch your topic with ease and precision using this Change Management Metrics With Requests By Team Designs PDF This layout presents information on Change Requests, Approval, Team. It is also available for immediate download and adjustment. So, changes can be made in the color, design, graphics or any other component to create a unique layout.

Change Metrics To Analyze Status By Priority Formats PDF
The following slide displays dashboard for real time tracking of major change kpis of the organization. It includes elements such as requests, projects, open, approved, review, in- progress, etc. Pitch your topic with ease and precision using this Change Metrics To Analyze Status By Priority Formats PDF This layout presents information on Project, Request Statistics, Priority. It is also available for immediate download and adjustment. So, changes can be made in the color, design, graphics or any other component to create a unique layout.

Metrics With Open Changes By Priority And Age Guidelines PDF
This slide showcases dashboard for monitoring status of open changes in the organization to ensure timely resolution of tickets raised. It includes key elements such as backlog growth, days, trend, distribution, etc. Pitch your topic with ease and precision using this Metrics With Open Changes By Priority And Age Guidelines PDF This layout presents information on Change Backlog Growth, Priority, Age. It is also available for immediate download and adjustment. So, changes can be made in the color, design, graphics or any other component to create a unique layout.
Open Risks And Issues Metrics For Software Development Icons PDF
This slide displays analytics to offer real-time data and insights on application programming project to keep it on schedule. It further includes details about change requests and bugs. Pitch your topic with ease and precision using this Open Risks And Issues Metrics For Software Development Icons PDF. This layout presents information on Priority, Risks, Change Requests. It is also available for immediate download and adjustment. So, changes can be made in the color, design, graphics or any other component to create a unique layout.

Production Metric Dashboard For Equipment Performance Measurement Slides PDF
This slide represents lean manufacturing dashboard for performance measurement. It covers equipment status timeline, downtime etc Want to ace your presentation in front of a live audience Our Production Metric Dashboard For Equipment Performance Measurement Slides PDF can help you do that by engaging all the users towards you. Slidegeeks experts have put their efforts and expertise into creating these impeccable powerpoint presentations so that you can communicate your ideas clearly. Moreover, all the templates are customizable, and easy to edit and downloadable. Use these for both personal and commercial use.
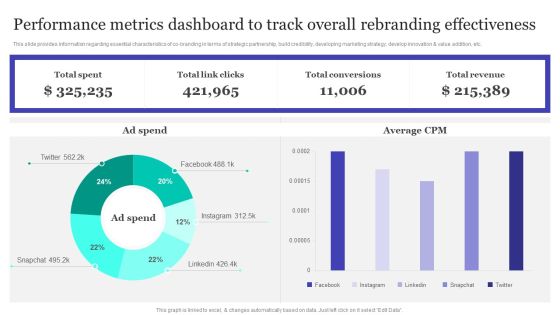
Performance Metrics Dashboard To Track Overall Rebranding Effectiveness Information PDF
This slide provides information regarding essential characteristics of co-branding in terms of strategic partnership, build credibility, developing marketing strategy, develop innovation and value addition, etc. This Performance Metrics Dashboard To Track Overall Rebranding Effectiveness Information PDF from Slidegeeks makes it easy to present information on your topic with precision. It provides customization options, so you can make changes to the colors, design, graphics, or any other component to create a unique layout. It is also available for immediate download, so you can begin using it right away. Slidegeeks has done good research to ensure that you have everything you need to make your presentation stand out. Make a name out there for a brilliant performance.

Performance Metrics Dashboard Of Procurement Department Download PDF
This slide provides an overview of the various KPIs tracked by the procurement department to determine the status. Major performance indicators covered are total, contracted and unlisted suppliers, rate of contract compliance, cycle time, total spending and savings. Slidegeeks has constructed Performance Metrics Dashboard Of Procurement Department Download PDF after conducting extensive research and examination. These presentation templates are constantly being generated and modified based on user preferences and critiques from editors. Here, you will find the most attractive templates for a range of purposes while taking into account ratings and remarks from users regarding the content. This is an excellent jumping off point to explore our content and will give new users an insight into our top notch PowerPoint Templates.
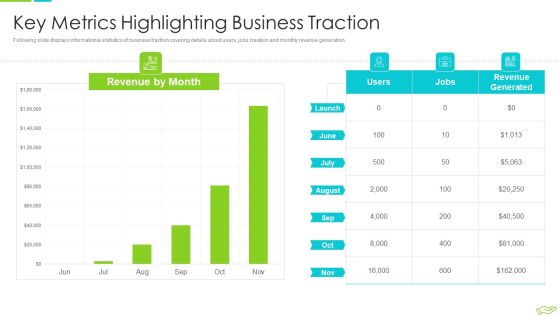
Elevator Pitch Deck To Raise Funds Key Metrics Highlighting Business Traction Clipart PDF
Following slide displays informational statistics of business traction covering details about users, jobs creation and monthly revenue generation. Deliver and pitch your topic in the best possible manner with this elevator pitch deck to raise funds key financial projections for upcoming years pictures pdf. Use them to share invaluable insights on key metrics highlighting business traction and impress your audience. This template can be altered and modified as per your expectations. So, grab it now.

Communicate Company Value To Your Stakeholders Business Value Metrics IT Spend Mockup PDF
This template covers IT business value metrics aligned to a business value such as IT spend by business unit, customer satisfaction scores for business facing services, and percentage of IT investment by business initiative. Deliver an awe inspiring pitch with this creative communicate company value to your stakeholders business value metrics it spend mockup pdf bundle. Topics like technology investments, business value, metrics, expenses can be discussed with this completely editable template. It is available for immediate download depending on the needs and requirements of the user.
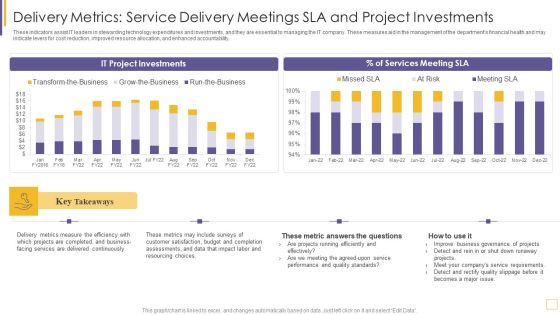
Guidelines For Exhibiting Business Value Of Information And Technology Delivery Metrics Service Portrait PDF
These indicators assist IT leaders in stewarding technology expenditures and investments, and they are essential to managing the IT company. These measures aid in the management of the departments financial health and may indicate levers for cost reduction, improved resource allocation, and enhanced accountability. Deliver and pitch your topic in the best possible manner with this guidelines for exhibiting business value of information and technology delivery metrics service portrait pdf. Use them to share invaluable insights on metrics measure, services, budget, resourcing and impress your audience. This template can be altered and modified as per your expectations. So, grab it now.
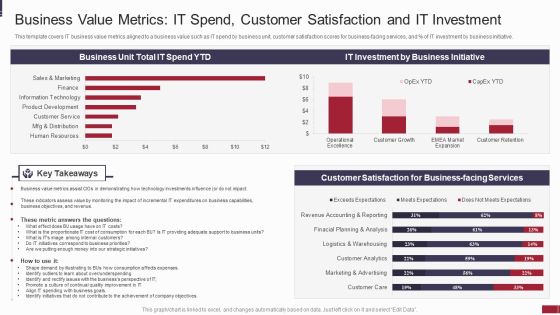
IT Value Story Significant To Corporate Leadership Business Value Metrics IT Spend Information PDF
This template covers IT business value metrics aligned to a business value such as IT spend by business unit, customer satisfaction scores for business facing services, and percentage of IT investment by business initiative. Deliver an awe inspiring pitch with this creative it value story significant to corporate leadership business value metrics it spend information pdf bundle. Topics like technology investments, internal customers, strategic, costs can be discussed with this completely editable template. It is available for immediate download depending on the needs and requirements of the user.

Guidelines For Exhibiting Business Value Of Information And Technology Financial Fundamental Metrics IT Spend Mockup PDF
These indicators assist IT leaders in stewarding technology expenditures and investments, and they are essential to managing the IT company. These measures aid in the management of the departments financial health and may indicate levers for cost reduction, improved resource allocation, and enhanced accountability. Deliver an awe inspiring pitch with this creative guidelines for exhibiting business value of information and technology financial fundamental metrics it spend mockup pdf bundle. Topics like metric, organizations, budget, demonstrate can be discussed with this completely editable template. It is available for immediate download depending on the needs and requirements of the user.

Business Operational Expenditure Dashboard Indicating Revenue And Costs Metrics Pictures PDF
This slide shows operating expenses OPEX dashboard indicating revenue and costs metrics which can be referred by companies to manage various operating expenses of various departments. It contains information about cost center, revenue per company, company code, etc. Pitch your topic with ease and precision using this Business Operational Expenditure Dashboard Indicating Revenue And Costs Metrics Pictures PDF. This layout presents information on Business Operational, Costs Metrics, Revenue. It is also available for immediate download and adjustment. So, changes can be made in the color, design, graphics or any other component to create a unique layout.

Dashboard For Measuring Information Technology Framework Service Performance Ideas PDF
This slide provides a dashboard for measuring key performance indicators of a IT service provider. Key components are ROI, weekly revenue, successful cloud deployments, service type used, monthly visitors and net promoter score. Showcasing this set of slides titled Dashboard For Measuring Information Technology Framework Service Performance Ideas PDF. The topics addressed in these templates are Service Type Used, Weekly Revenue, Net Promoter Score. All the content presented in this PPT design is completely editable. Download it and make adjustments in color, background, font etc. as per your unique business setting.
