Finance Kpi

Software Development Life Cycle Agile Model It Agile Metrics To Measure Project Development Progress Contd Download PDF
Mentioned slide provides information on the agile metrics namely value delivered graph that can be used by the organization to measure its project development progress. Deliver an awe inspiring pitch with this creative software development life cycle agile model it addressing the principles that shape agile model pictures pdf bundle. Topics like agile metrics to measure project development progress contd can be discussed with this completely editable template. It is available for immediate download depending on the needs and requirements of the user.

Cloud Business Intelligence Dashboard Graphics PDF
Deliver and pitch your topic in the best possible manner with this cloud business intelligence dashboard graphics pdf. Use them to share invaluable insights on social interactions, key web metrics, key sales metrics and impress your audience. This template can be altered and modified as per your expectations. So, grab it now.

Dashboard For Tracking Social Media Kpis Mockup PDF
This slide shows dashboard for tracking social media key performance indicators KPIs. It provides details about average social engagement, reactions, comments, shares, clicks, thumbnail, platform, post message, etc. Deliver and pitch your topic in the best possible manner with this Dashboard For Tracking Social Media Kpis Mockup PDF. Use them to share invaluable insights on Social Engagements, Dashboard, Tracking Social Media KPIS and impress your audience. This template can be altered and modified as per your expectations. So, grab it now.

Cyberspace Simulation Platform Fundraising Elevator Why Invest In Our Product Demonstration PDF
For any pith deck, defining key metrics that provide a clear overview of the business is a crucial point, thus in this slide we have provided you with such key metrics that compel the investor to provide funds, these metrics are high demand, aggressive growth, stable and growing economics and exclusive content. Deliver an awe inspiring pitch with this creative cyberspace simulation platform fundraising elevator why invest in our product demonstration pdf bundle. Topics like exclusive content, stable and growing economics, aggressive growth can be discussed with this completely editable template. It is available for immediate download depending on the needs and requirements of the user.
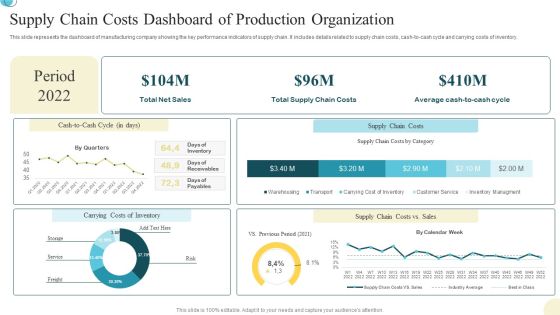
Supply Chain Costs Dashboard Of Production Organization Background PDF
This slide represents the dashboard of manufacturing company showing the key performance indicators of supply chain. It includes details related to supply chain costs, cash to cash cycle and carrying costs of inventory. Pitch your topic with ease and precision using this Supply Chain Costs Dashboard Of Production Organization Background PDF. This layout presents information on Supply Chain Costs, Dashboard Of Production, Organization. It is also available for immediate download and adjustment. So, changes can be made in the color, design, graphics or any other component to create a unique layout.

Agile Customer Relationship Management It Agile Practices Improves Business Customer Relationships Topics PDF
This slide provides the glimpse about the agile practices which improves the business CRM such as transparency, metrics, working software, embracing change, etc. Deliver an awe inspiring pitch with this creative agile customer relationship management it agile practices improves business customer relationships topics pdf bundle. Topics like transparency, demonstrate working software, embracing change can be discussed with this completely editable template. It is available for immediate download depending on the needs and requirements of the user.
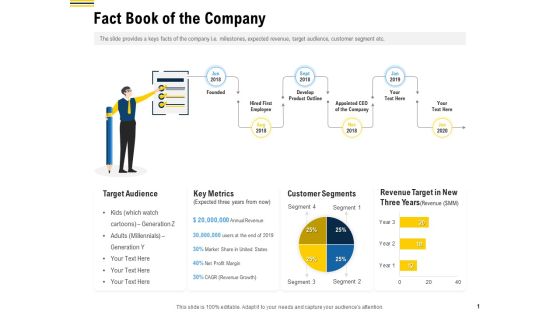
Raise Funding From Pre Seed Money Fact Book Of The Company Sample PDF
Showcasing this set of slides titled raise funding from pre seed money fact book of the company sample pdf. The topics addressed in these templates are target audience, key metrics, customer segments. All the content presented in this PPT design is completely editable. Download it and make adjustments in color, background, font etc. as per your unique business setting.
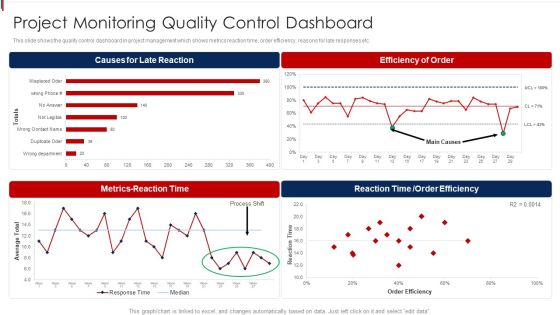
Project Monitoring Quality Control Dashboard Clipart PDF
This slide shows the quality control dashboard in project management which shows metrics reaction time, order efficiency, reasons for late responses etc Showcasing this set of slides titled Project Monitoring Quality Control Dashboard Clipart PDF. The topics addressed in these templates are Causes Late Reaction, Metrics Reaction Time, Efficiency Of Order. All the content presented in this PPT design is completely editable. Download it and make adjustments in color, background, font etc. as per your unique business setting.

Content Marketing Dashboard For Effective Tracking Ppt PowerPoint Presentation File Outline PDF
Purpose of the following slide is to show key metrics that can help the organization to track their content marketing efforts, these metrics are ad cost, visits, cost per click etc.. Do you have an important presentation coming up Are you looking for something that will make your presentation stand out from the rest Look no further than Content Marketing Dashboard For Effective Tracking Ppt PowerPoint Presentation File Outline PDF. With our professional designs, you can trust that your presentation will pop and make delivering it a smooth process. And with Slidegeeks, you can trust that your presentation will be unique and memorable. So why wait Grab Content Marketing Dashboard For Effective Tracking Ppt PowerPoint Presentation File Outline PDF today and make your presentation stand out from the rest.

Virtual Video Hosting Platform Capital Raising Explosive Growth Of Virtual Video Hosting Platform Information PDF
This slide caters details about explosive growth of online video hosting platform and emerging as popular video sharing platform with impressive metrics. Deliver and pitch your topic in the best possible manner with this virtual video hosting platform capital raising explosive growth of virtual video hosting platform information pdf. Use them to share invaluable insights on explosive growth of virtual video hosting platform and impress your audience. This template can be altered and modified as per your expectations. So, grab it now.

Online Music Streaming App Capital Raising Elevator Explosive Growth Of Music Streaming Platform Template PDF
This slide caters details about explosive growth of music streaming platform with impressive metrics. Deliver an awe inspiring pitch with this creative online music streaming app capital raising elevator explosive growth of music streaming platform template pdf bundle. Topics like explosive growth of music streaming platform can be discussed with this completely editable template. It is available for immediate download depending on the needs and requirements of the user.
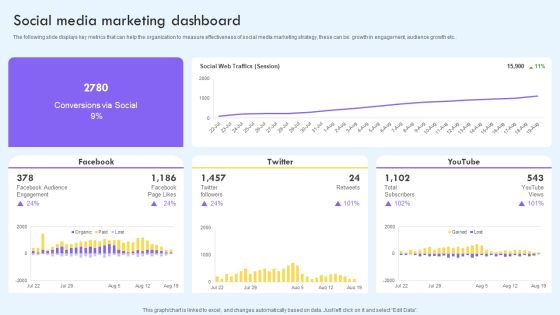
Social Media Marketing Dashboard Ppt PowerPoint Presentation File Infographic Template PDF
The following slide displays key metrics that can help the organization to measure effectiveness of social media marketing strategy, these can be growth in engagement, audience growth etc. Boost your pitch with our creative Social Media Marketing Dashboard Ppt PowerPoint Presentation File Infographic Template PDF. Deliver an awe inspiring pitch that will mesmerize everyone. Using these presentation templates you will surely catch everyones attention. You can browse the ppts collection on our website. We have researchers who are experts at creating the right content for the templates. So you do not have to invest time in any additional work. Just grab the template now and use them.

Dashboard For Inbound Marketing Efforts Ppt PowerPoint Presentation File Infographic Template PDF
The following slide displays key metrics that can help the organization to measure effectiveness of inbound marketing strategy, these can be cost per conversion, clicks, impressions, etc. If your project calls for a presentation, then Slidegeeks is your go to partner because we have professionally designed, easy to edit templates that are perfect for any presentation. After downloading, you can easily edit Dashboard For Inbound Marketing Efforts Ppt PowerPoint Presentation File Infographic Template PDF and make the changes accordingly. You can rearrange slides or fill them with different images. Check out all the handy templates.

Customer Lifetime Value Based Success KPIS Dashboard Ppt PowerPoint Presentation Layouts Gridlines PDF
This slide covers dashboard for estimation of customer lifetime value as success metrics. It includes KPIs such as customer lifetime value, customer lifetime period, customer risk, customer contact rate, customer retention costs, average lifetime value, customer churn rate, average revenue per account, etc. Pitch your topic with ease and precision using this Customer Lifetime Value Based Success KPIS Dashboard Ppt PowerPoint Presentation Layouts Gridlines PDF. This layout presents information on Average Revenue, Customer Lifetime, Customer Risk. It is also available for immediate download and adjustment. So, changes can be made in the color, design, graphics or any other component to create a unique layout.

Customer Centric Success KPIS Dashboard Ppt PowerPoint Presentation Styles Example File PDF
This slide covers dashboard for customer oriented success metrics. It includes KPIs such as net promoter score, customer loyalty rate, premium users, customer lifetime value, customer and revenue churn rates, MRR growth and net retention rates, etc. Showcasing this set of slides titled Customer Centric Success KPIS Dashboard Ppt PowerPoint Presentation Styles Example File PDF. The topics addressed in these templates are New Retention, Customer Churn, Revenue Churn. All the content presented in this PPT design is completely editable. Download it and make adjustments in color, background, font etc. as per your unique business setting.

Customer Retention Based Success KPIS Dashboard Ppt PowerPoint Presentation Slides Graphics Pictures PDF
This slide covers dashboard for estimation of customer retention based success metrics. It includes KPIs such as net retention rates including expansion, contractions, net MRR, cancelled accounts, etc. Showcasing this set of slides titled Customer Retention Based Success KPIS Dashboard Ppt PowerPoint Presentation Slides Graphics Pictures PDF. The topics addressed in these templates are Account Retention, Cancelled Accounts, Retention Components. All the content presented in this PPT design is completely editable. Download it and make adjustments in color, background, font etc. as per your unique business setting.

Customer Success KPIS Overview Dashboard For Technical Support Team Ppt PowerPoint Presentation Gallery Layouts PDF
This slide covers dashboard with parameters to monitor performance for customer success programs. It includes percentage of customers helped, team report metrics, new customers, MRR, revenue churn, cancellation and refunds. Showcasing this set of slides titled Customer Success KPIS Overview Dashboard For Technical Support Team Ppt PowerPoint Presentation Gallery Layouts PDF. The topics addressed in these templates are Customer, Cancelations, New Customer, Revenue Churn. All the content presented in this PPT design is completely editable. Download it and make adjustments in color, background, font etc. as per your unique business setting.

Stats On KPIS To Measure Customer Experience Success Ppt PowerPoint Presentation Slides Objects PDF
This slide depicts key indicators to measure customer success. It includes metrics such as customer retention rate, customer satisfaction, customer lifetime value, visitor intent, net promoter score, customer effort score, likes and comments. Showcasing this set of slides titled Stats On KPIS To Measure Customer Experience Success Ppt PowerPoint Presentation Slides Objects PDF. The topics addressed in these templates are Measure Customer, Experience Success. All the content presented in this PPT design is completely editable. Download it and make adjustments in color, background, font etc. as per your unique business setting.
Positive Marketing For Corporate Dashboard For Tracking Marketing Activities At Social Topics PDF
This slide covers information regarding the dashboard for tracking essential marketing activities at social media platform in terms of social traffic and conversion, referral traffic by site, key social media metrics. Deliver and pitch your topic in the best possible manner with this positive marketing for corporate dashboard for tracking marketing activities at social topics pdf. Use them to share invaluable insights on social events, social traffic and conversion and impress your audience. This template can be altered and modified as per your expectations. So, grab it now.

Customer Success And Satisfaction KPIS Dashboard Ppt PowerPoint Presentation Outline Visuals PDF
This slide covers dashboard for estimation of customer satisfaction with success metrics. It includes KPIs such as average CSAT, average response time , service level agreement compliance, top companys accounts, etc. Pitch your topic with ease and precision using this Customer Success And Satisfaction KPIS Dashboard Ppt PowerPoint Presentation Outline Visuals PDF. This layout presents information on Customer Success, Satisfaction KPIs Dashboard. It is also available for immediate download and adjustment. So, changes can be made in the color, design, graphics or any other component to create a unique layout.
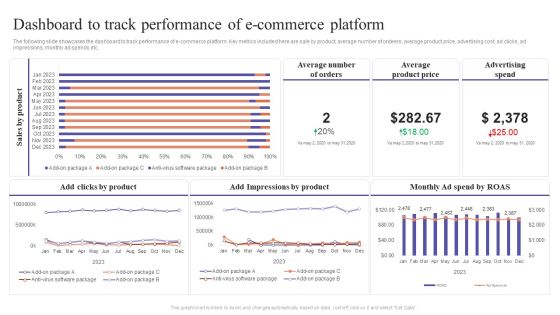
Dashboard To Track Performance Of E Commerce Platform Ecommerce Marketing Techniques Guidelines PDF
The following slide showcases the dashboard to track performance of e commerce platform. Key metrics included here are sale by product, average number of ordeers, average product price, advertising cost, ad clicks, ad impressions, monthly ad spends etc. Here you can discover an assortment of the finest PowerPoint and Google Slides templates. With these templates, you can create presentations for a variety of purposes while simultaneously providing your audience with an eye-catching visual experience. Download Dashboard To Track Performance Of E Commerce Platform Ecommerce Marketing Techniques Guidelines PDF to deliver an impeccable presentation. These templates will make your job of preparing presentations much quicker, yet still, maintain a high level of quality. Slidegeeks has experienced researchers who prepare these templates and write high-quality content for you. Later on, you can personalize the content by editing the Dashboard To Track Performance Of E Commerce Platform Ecommerce Marketing Techniques Guidelines PDF.
Roadmap For Financial Accounting Transformation Key Performance Indicators To Track The Success Of Accounting Icons PDF
The slide shows key Performance Indicator KPI which will help the company to track the success of Accounting and Finance Transformation. Major KPIs include revenue, operating profit margin, net profit margin, invoice errors, net discount etc. Deliver an awe inspiring pitch with this creative roadmap for financial accounting transformation key performance indicators to track the success of accounting icons pdf bundle. Topics like revenue, operating profit margin, net profit margin, invoice errors, net discount can be discussed with this completely editable template. It is available for immediate download depending on the needs and requirements of the user.

Business Performance With Regional Scorecard Ppt PowerPoint Presentation Slides Tips PDF
Presenting this set of slides with name business performance with regional scorecard ppt powerpoint presentation slides tips pdf. The topics discussed in these slides are regional scorecard, set ratio kpi, based on profit ratio kpi, 2019, 2020. This is a completely editable PowerPoint presentation and is available for immediate download. Download now and impress your audience.

Organization Financial Team Summary With Key Performance Indicators Clipart PDF
This slide represents a report prepared by the finance team showing the financial position of the organization with the help of key performance indicators. It demonstrates data related to current working capital, cash conversion cycle and vendor payment error rate of the company. Pitch your topic with ease and precision using this Organization Financial Team Summary With Key Performance Indicators Clipart PDF. This layout presents information on Current Working Capital, Cash Conversion Cycle. It is also available for immediate download and adjustment. So, changes can be made in the color, design, graphics or any other component to create a unique layout.

Project Organizing Playbook Dashboard To Track Project Essential Activities Template PDF
This slide provides information about dashboard to track project essential activities by tracking project schedule, budget, resources, etc. Deliver an awe inspiring pitch with this creative project organizing playbook dashboard to track project essential activities template pdf bundle. Topics like projects kpi, budget, resources can be discussed with this completely editable template. It is available for immediate download depending on the needs and requirements of the user.
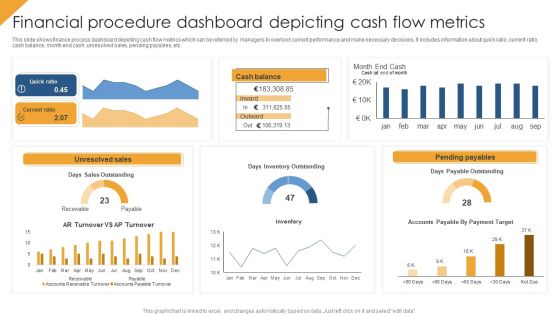
Financial Procedure Dashboard Depicting Cash Flow Metrics Structure PDF
This slide shows finance process dashboard depicting cash flow metrics which can be referred by managers to overlook current performance and make necessary decisions. It includes information about quick ratio, current ratio, cash balance, month end cash, unresolved sales, pending payables, etc. Pitch your topic with ease and precision using this Financial Procedure Dashboard Depicting Cash Flow Metrics Structure PDF. This layout presents information on Quick Ratio, Unresolved Sales, Pending Payables. It is also available for immediate download and adjustment. So, changes can be made in the color, design, graphics or any other component to create a unique layout.

Monthly Financials Metrics With Revenue And Gross Profit Professional PDF
This slide displays P and L variance analysis to closely monitor key financial parameters of the company. It includes details about sales, discounts allowed, freight income, customer finance charges, etc. Showcasing this set of slides titled Monthly Financials Metrics With Revenue And Gross Profit Professional PDF. The topics addressed in these templates are Amount, Current Month, Profit. All the content presented in this PPT design is completely editable. Download it and make adjustments in color, background, font etc. as per your unique business setting.
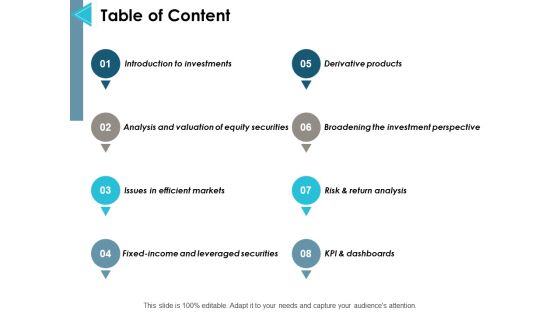
Table Of Content Ppt PowerPoint Presentation Gallery Graphic Tips
This is a table of content ppt powerpoint presentation gallery graphic tips. This is a eight stage process. The stages in this process are introduction to investments, risk and return analysis, issues in efficient markets, kpi and dashboards, management.
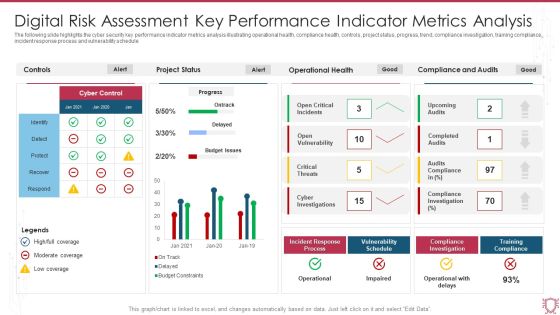
Digital Risk Assessment Key Performance Indicator Metrics Analysis Infographics PDF
The following slide highlights the cyber security key performance indicator metrics analysis illustrating operational health, compliance health, controls, project status, progress, trend, compliance investigation, training compliance, incident response process and vulnerability schedule. Showcasing this set of slides titled Digital Risk Assessment Key Performance Indicator Metrics Analysis Infographics PDF. The topics addressed in these templates are Project Status, Operational Health, Compliance And Audits. All the content presented in this PPT design is completely editable. Download it and make adjustments in color, background, font etc. as per your unique business setting.

Cyber Security Key Performance Indicators Metrics Dashboard Mockup PDF
This slide covers cyber security health status dashboard . It also includes audit and compliance, controls health, project status, incident response process, vulnerability patching schedule, investigation process and training compliance. Pitch your topic with ease and precision using this Cyber Security Key Performance Indicators Metrics Dashboard Mockup PDF. This layout presents information on Cyber Security, Vulnerability Patching Schedule, Compliance Investigation Process. It is also available for immediate download and adjustment. So, changes can be made in the color, design, graphics or any other component to create a unique layout.
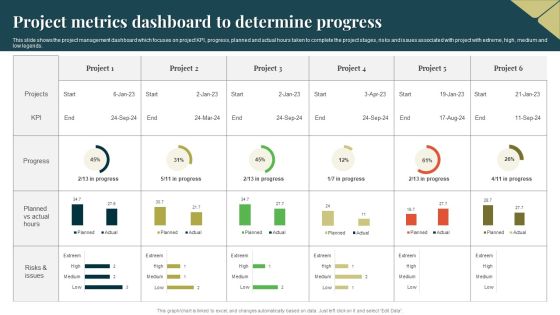
Project Metrics Dashboard To Determine Progress Guidelines PDF
This slide shows the project management dashboard which focuses on project KPI, progress, planned and actual hours taken to complete the project stages, risks and issues associated with project with extreme, high, medium and low legends. Showcasing this set of slides titled Project Metrics Dashboard To Determine Progress Guidelines PDF. The topics addressed in these templates are Project Metrics Dashboard, Determine Progress. All the content presented in this PPT design is completely editable. Download it and make adjustments in color, background, font etc. as per your unique business setting.
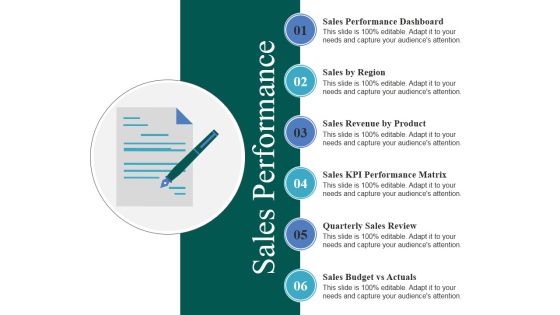
Sales Performance Ppt PowerPoint Presentation Infographics Visuals
This is a sales performance ppt powerpoint presentation infographics visuals. This is a six stage process. The stages in this process are sales by region, sales revenue by product, sales kpi performance matrix, quarterly sales review, sales budget vs actuals.

Performance Management And Reward System Example Of Ppt Presentation
This is a performance management and reward system example of ppt presentation. This is a six stage process. The stages in this process are kpi development and resource allocation, performance evaluation, goal setting, reward system.

Flexible Working Policies Presentation Slide Powerpoint Graphics
This is a flexible working policies presentation slide powerpoint graphics. This is a six stage process. The stages in this process are assign, allocate, monitor, evaluate, full system integration, reduce admin costs, kpi tracking, connect, interact.

B2C Email Marketing Performance Benchmarks Analysis Topics PDF
The purpose of this slide is to outline e-mail marketing benchmarks metrics that are used to assess the success of an email campaign. Certain metrics include follow-up email, finance related, response rate, loyalty program etc. Pitch your topic with ease and precision using this B2C Email Marketing Performance Benchmarks Analysis Topics PDF. This layout presents information on Advertisement, Loyalty Program, Performance Benchmarks Analysis. It is also available for immediate download and adjustment. So, changes can be made in the color, design, graphics or any other component to create a unique layout.

Third Party Vendors Risk Metrics Performance Indicators Dashboard Topics PDF
This slide illustrates graphical representation of risk key performance indicators. It includes third party vendors trust score, impact score and risk score. Pitch your topic with ease and precision using this Third Party Vendors Risk Metrics Performance Indicators Dashboard Topics PDF. This layout presents information on Third Party Vendors Risk Metrics Performance Indicators Dashboard. It is also available for immediate download and adjustment. So, changes can be made in the color, design, graphics or any other component to create a unique layout.

Call Center Quality Key Performance Assurance Indicator Metrics Dashboard Portrait PDF
Showcasing this set of slides titled Call Center Quality Key Performance Assurance Indicator Metrics Dashboard Portrait PDF. The topics addressed in these templates are Key Performance, Assurance Indicator, Metrics Dashboard. All the content presented in this PPT design is completely editable. Download it and make adjustments in color, background, font etc. as per your unique business setting.

Key Performance Indicators Of The Internal Metrics Audit Function Infographics PDF
This slide defines the graphical representation of internal audit key performance indicators. It is a comparison of the means used to evaluate the performance of the internal audit function. Pitch your topic with ease and precision using this Key Performance Indicators Of The Internal Metrics Audit Function Infographics PDF. This layout presents information on High Variance, Budget To Actual, Audit Functions. It is also available for immediate download and adjustment. So, changes can be made in the color, design, graphics or any other component to create a unique layout.

Essential Key Performance Indicators In Investment Summary Demonstration PDF
The following slide showcases dashboard of portfolio summary with important key performance indicators to provide an oversight of the project. Key metrics covered are cost, work, variance, active risk and issues. Showcasing this set of slides titled Essential Key Performance Indicators In Investment Summary Demonstration PDF. The topics addressed in these templates are Cost, Active Risks, Projects. All the content presented in this PPT design is completely editable. Download it and make adjustments in color, background, font etc. as per your unique business setting.
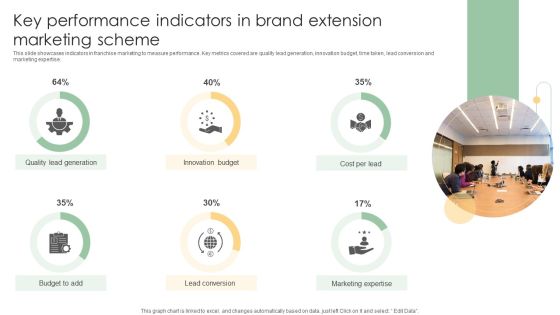
Key Performance Indicators In Brand Extension Marketing Scheme Ideas PDF
This slide showcases indicators in franchise marketing to measure performance. Key metrics covered are quality lead generation, innovation budget, time taken, lead conversion and marketing expertise.Pitch your topic with ease and precision using this Key Performance Indicators In Brand Extension Marketing Scheme Ideas PDF. This layout presents information on Quality Lead Generation, Innovation Budget, Lead Conversion. It is also available for immediate download and adjustment. So, changes can be made in the color, design, graphics or any other component to create a unique layout.

Calculate Facebook Key Performance Indicator Performance Sample PDF
Pitch your topic with ease and precision using this calculate facebook key performance indicator performance sample pdf. This layout presents information on calculate facebook key performance indicator performance. It is also available for immediate download and adjustment. So, changes can be made in the color, design, graphics or any other component to create a unique layout.

Prospective Buyer Retention Dashboard With Key Performance Indicators Themes PDF
This slide shows the dashboard representing the key performance metrics for retention of potential customers of the organization. It shows no. of active users, churn rate, cost of customer acquisition, their life time value, monthly recurring revenue etc.Pitch your topic with ease and precision using this Prospective Buyer Retention Dashboard With Key Performance Indicators Themes PDF. This layout presents information on Recurring Revenue, Revenue Growth, Customer Acquisition. It is also available for immediate download and adjustment. So, changes can be made in the color, design, graphics or any other component to create a unique layout.

Employee Key Performance Indicators With Scores Themes PDF
The following slide highlights the staff key performance Indicators with scores illustrating key headings which includes staff performance , average scores and team result areas Pitch your topic with ease and precision using this Employee Key Performance Indicators With Scores Themes PDF This layout presents information on Staff Performance, Average Scores, Team Result It is also available for immediate download and adjustment. So, changes can be made in the color, design, graphics or any other component to create a unique layout.
Sales Key Performance Indicators Dashboard Ppt PowerPoint Presentation Icon PDF
Presenting this set of slides with name sales key performance indicators dashboard ppt powerpoint presentation icon pdf. The topics discussed in these slides are current ticket volume, sales key performance, indicators dashboard. This is a completely editable PowerPoint presentation and is available for immediate download. Download now and impress your audience.

Key Performance Indicators In Oil And Gas Industry Template PDF
Showcasing this set of slides titled key performance indicators in oil and gas industry template pdf. The topics addressed in these templates are key performance indicators in oil and gas industry. All the content presented in this PPT design is completely editable. Download it and make adjustments in color, background, font etc. as per your unique business setting.
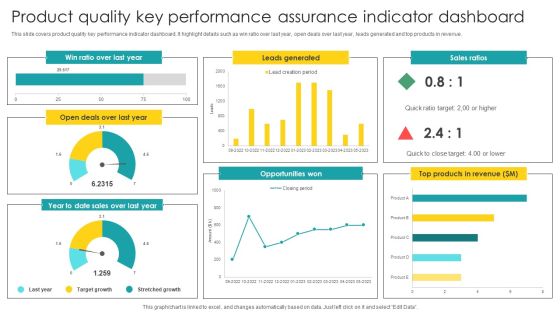
Product Quality Key Performance Assurance Indicator Dashboard Graphics PDF
Showcasing this set of slides titled Product Quality Key Performance Assurance Indicator Dashboard Graphics PDF. The topics addressed in these templates are Key Performance, Assurance Indicator, Dashboard. All the content presented in this PPT design is completely editable. Download it and make adjustments in color, background, font etc. as per your unique business setting.

Project Quality Management Key Performance Assurance Indicator Dashboard Guidelines PDF
Pitch your topic with ease and precision using this Project Quality Management Key Performance Assurance Indicator Dashboard Guidelines PDF. This layout presents information on Management Key, Performance Assurance, Indicator Dashboard. It is also available for immediate download and adjustment. So, changes can be made in the color, design, graphics or any other component to create a unique layout.
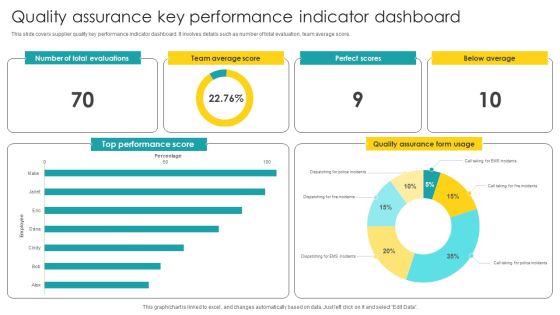
Quality Assurance Key Performance Indicator Dashboard Structure PDF
Showcasing this set of slides titled Quality Assurance Key Performance Indicator Dashboard Structure PDF. The topics addressed in these templates are Key Performance, Indicator Dashboard. All the content presented in this PPT design is completely editable. Download it and make adjustments in color, background, font etc. as per your unique business setting.
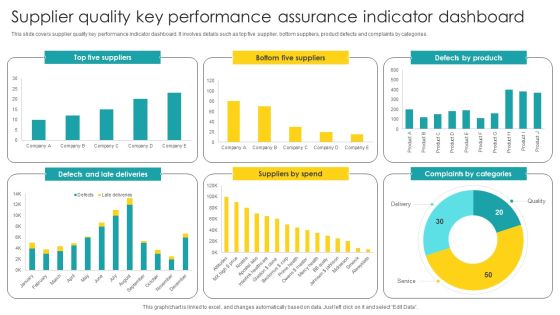
Supplier Quality Key Performance Assurance Indicator Dashboard Diagrams PDF
Showcasing this set of slides titled Supplier Quality Key Performance Assurance Indicator Dashboard Diagrams PDF. The topics addressed in these templates are Supplier Quality, Key Performance, Assurance Indicator. All the content presented in this PPT design is completely editable. Download it and make adjustments in color, background, font etc. as per your unique business setting.
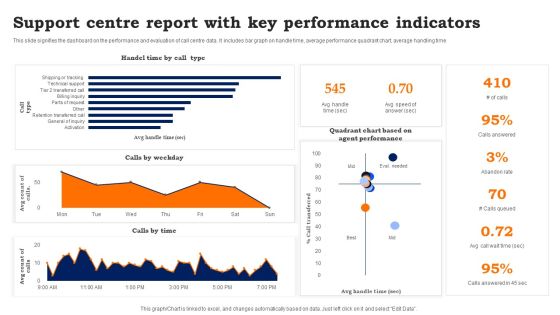
Support Centre Report With Key Performance Indicators Information PDF
This slide signifies the dashboard on the performance and evaluation of call centre data. It includes bar graph on handle time, average performance quadrant chart, average handling time. Showcasing this set of slides titled Support Centre Report With Key Performance Indicators Information PDF. The topics addressed in these templates are Support Centre Report, Key Performance Indicators. All the content presented in this PPT design is completely editable. Download it and make adjustments in color, background, font etc. as per your unique business setting.

Project Key Performance Indicators Progress Scorecard Portrait PDF
This slide covers status summary of different KPIs in a project along with indicators scale. It also contains elements such as resources , project delivery summary with key risks, assumptions and dependencies.Pitch your topic with ease and precision using this Project Key Performance Indicators Progress Scorecard Portrait PDF. This layout presents information on Limited Availability Resources, Limited Funding Options, Key Resources . It is also available for immediate download and adjustment. So, changes can be made in the color, design, graphics or any other component to create a unique layout.
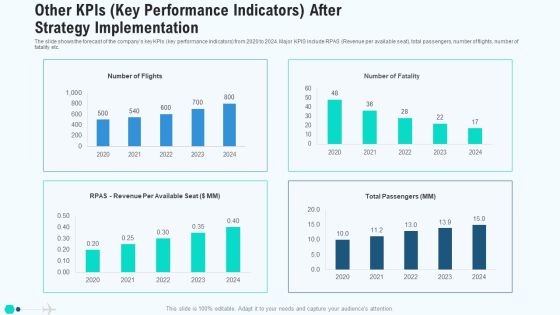
Other Kpis Key Performance Indicators After Strategy Implementation Mockup PDF
The slide shows the forecast of the companys key KPIs key performance indicators from 2020 to 2024. Major KPIS include RPAS Revenue per available seat, total passengers, number of flights, number of fatality etc. Deliver and pitch your topic in the best possible manner with this other kpis key performance indicators after strategy implementation mockup pdf. Use them to share invaluable insights on other kpis key performance indicators after strategy implementation and impress your audience. This template can be altered and modified as per your expectations. So, grab it now.

Other Operational And Financials Kpis Key Performance Indicators Clipart PDF
The slide shows the graph of companys key KPIs key performance indicators from 2017 to 2021. Major KPIs include RPAS Revenue per available seat, total passengers, number of flights, number of fatality etc. Deliver an awe inspiring pitch with this creative other operational and financials kpis key performance indicators clipart pdf bundle. Topics like other operational and financials kpis key performance indicators can be discussed with this completely editable template. It is available for immediate download depending on the needs and requirements of the user.
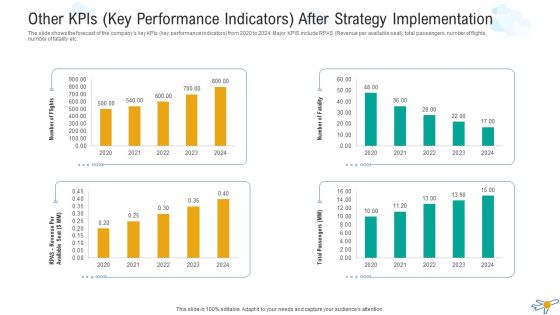
Other Kpis Key Performance Indicators After Strategy Implementation Microsoft PDF
The slide shows the forecast of the companys key KPIs key performance indicators from 2020 to 2024. Major KPIS include RPAS Revenue per available seat, total passengers, number of flights, number of fatality etc. Deliver and pitch your topic in the best possible manner with this other kpis key performance indicators after strategy implementation microsoft pdf. Use them to share invaluable insights on other kpis key performance indicators after strategy implementation and impress your audience. This template can be altered and modified as per your expectations. So, grab it now.
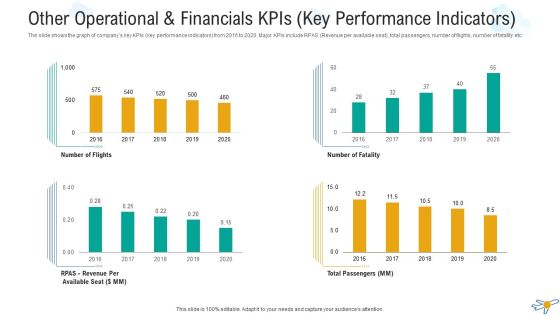
Other Operational And Financials Kpis Key Performance Indicators Professional PDF
The slide shows the graph of companys key KPIs key performance indicators from 2016 to 2020. Major KPIs include RPAS Revenue per available seat, total passengers, number of flights, number of fatality etc. Deliver an awe-inspiring pitch with this creative other operational and financials kpis key performance indicators professional pdf bundle. Topics like other operational and financials kpis key performance indicators can be discussed with this completely editable template. It is available for immediate download depending on the needs and requirements of the user.

Other Kpis Key Performance Indicators After Strategy Implementation Infographics PDF
The slide shows the forecast of the companys key KPIs key performance indicators from 2020 to 2024. Major KPIS include RPAS Revenue per available seat, total passengers, number of flights, number of fatality etc. Deliver and pitch your topic in the best possible manner with this other kpis key performance indicators after strategy implementation infographics pdf. Use them to share invaluable insights on other kpis key performance indicators after strategy implementation and impress your audience. This template can be altered and modified as per your expectations. So, grab it now.
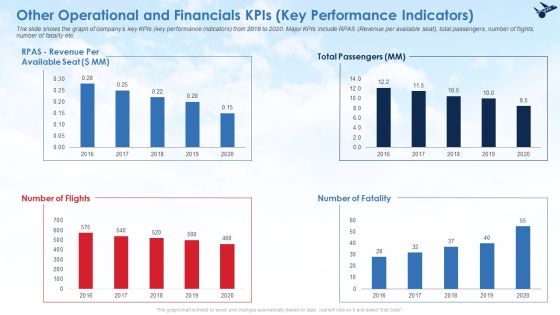
Other Operational And Financials Kpis Key Performance Indicators Ideas PDF
The slide shows the graph of companys key KPIs key performance indicators from 2016 to 2020. Major KPIs include RPAS Revenue per available seat, total passengers, number of flights, number of fatality etc. Deliver an awe inspiring pitch with this creative other operational and financials kpis key performance indicators ideas pdf bundle. Topics like other operational and financials kpis key performance indicators can be discussed with this completely editable template. It is available for immediate download depending on the needs and requirements of the user.
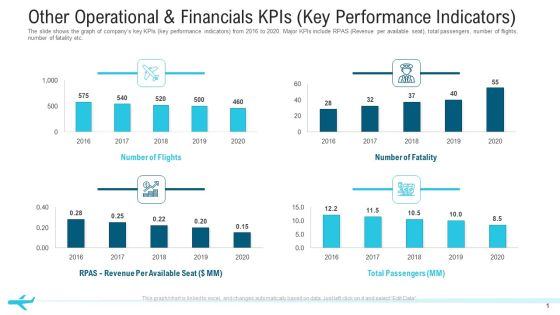
Other Operational And Financials Kpis Key Performance Indicators Structure PDF
The slide shows the graph of companys key KPIs key performance indicators from 2016 to 2020. Major KPIs include RPAS Revenue per available seat, total passengers, number of flights, number of fatality etc.Deliver an awe-inspiring pitch with this creative other operational and financials KPIs key performance indicators structure pdf. bundle. Topics like total passengers, number of flights,2016 to 2020 can be discussed with this completely editable template. It is available for immediate download depending on the needs and requirements of the user.

Revenue And Employee Key Performance Indicators Background PDF
The following slide highlights the revenue and staff key performance Indicators illustrating key headings which includes revenue centres, employee vs profitability, billable hours, average rate per hour and profitable employees Deliver an awe inspiring pitch with this creative Revenue And Employee Key Performance Indicators Background PDF bundle. Topics like Revenue Centres, Employee Profitability, Profitable Employee can be discussed with this completely editable template. It is available for immediate download depending on the needs and requirements of the user.
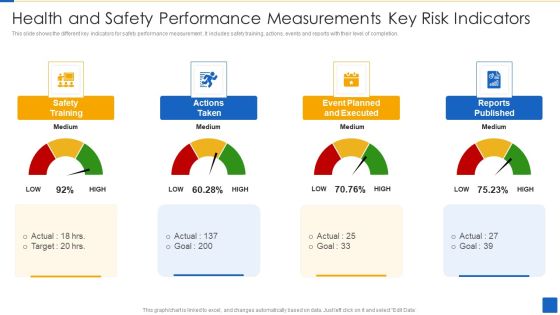
Health And Safety Performance Measurements Key Risk Indicators Download PDF
This slide shows the different key indicators for safety performance measurement . It includes safety training, actions, events and reports with their level of completion.Showcasing this set of slides titled Health And Safety Performance Measurements Key Risk Indicators Download PDF The topics addressed in these templates are Safety Training, Actions Taken, Event Planned Executed All the content presented in this PPT design is completely editable. Download it and make adjustments in color, background, font etc. as per your unique business setting.

Quality Key Performance Assurance Indicator Dashboard For Procurement Elements PDF
Pitch your topic with ease and precision using this Quality Key Performance Assurance Indicator Dashboard For Procurement Elements PDF. This layout presents information on Indicator Dashboard, Procurement. It is also available for immediate download and adjustment. So, changes can be made in the color, design, graphics or any other component to create a unique layout.
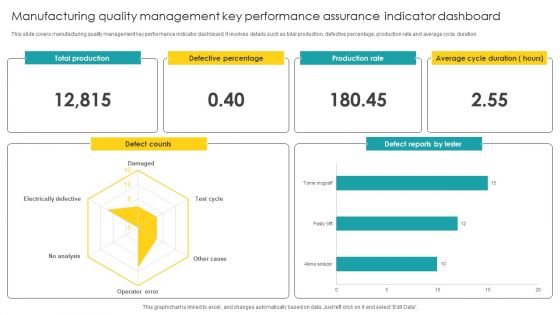
Manufacturing Quality Management Key Performance Assurance Indicator Dashboard Microsoft PDF
Pitch your topic with ease and precision using this Manufacturing Quality Management Key Performance Assurance Indicator Dashboard Microsoft PDF. This layout presents information on Quality Management, Key Performance Assurance. It is also available for immediate download and adjustment. So, changes can be made in the color, design, graphics or any other component to create a unique layout.

Call Center Process Key Performance Indicator Dashboard Mockup PDF
This slide showcases call center process measurements and key performance indicators so managers and teams can keep track of and improve performance . It includes received calls, calculating speed of answering calls , ended calls before starting conversations , average calls per minute etc. Showcasing this set of slides titled Call Center Process Key Performance Indicator Dashboard Mockup PDF. The topics addressed in these templates are Received Calls, Conversation, Abandon Rate. All the content presented in this PPT design is completely editable. Download it and make adjustments in color, background, font etc. as per your unique business setting.
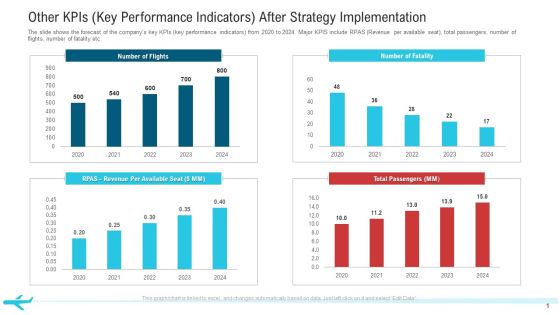
Other Kpis Key Performance Indicators After Strategy Implementation Professional PDF
The slide shows the forecast of the companys key KPIs key performance indicators from 2020 to 2024. Major KPIS include RPAS Revenue per available seat, total passengers, number of flights, number of fatality etc.Deliver and pitch your topic in the best possible manner with this other KPIs key performance indicators after strategy implementation professional pdf. Use them to share invaluable insights on total passengers, number of flights, 2020 to 2024 and impress your audience. This template can be altered and modified as per your expectations. So, grab it now.

Organization Manpower Management Technology HR Key Performance Indicators Graphics PDF
Deliver an awe inspiring pitch with this creative organization manpower management technology hr key performance indicators graphics pdf bundle. Topics like criteria, workforce, performance, revenue, internal can be discussed with this completely editable template. It is available for immediate download depending on the needs and requirements of the user.

Staff Turnover Key Performance Indicators Dashboard Sample PDF
The following slide highlights the staff turnover key performance Indicators dashboard illustrating employee turn over, turn over rate, average tenure, turnover per quarter, turnover per department, turnover type, turnover time period, turnover per position and turnover reasons Deliver and pitch your topic in the best possible manner with this Staff Turnover Key Performance Indicators Dashboard Sample PDF Use them to share invaluable insights on Management Goals, Subjective Appraisal, Product Defects and impress your audience. This template can be altered and modified as per your expectations. So, grab it now.
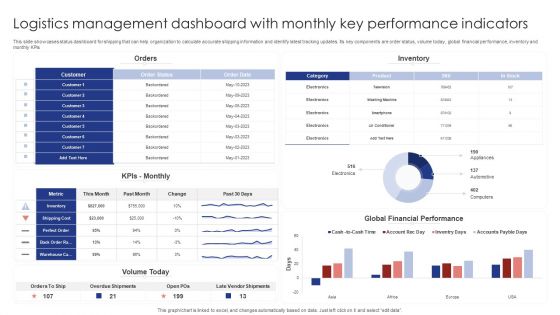
Logistics Management Dashboard With Monthly Key Performance Indicators Rules PDF
This slide showcases status dashboard for shipping that can help organization to calculate accurate shipping information and identify latest tracking updates. Its key components are order status, volume today, global financial performance, inventory and monthly KPIs. Pitch your topic with ease and precision using this Logistics Management Dashboard With Monthly Key Performance Indicators Rules PDF. This layout presents information on Orders, Inventory, Kpis Monthly. It is also available for immediate download and adjustment. So, changes can be made in the color, design, graphics or any other component to create a unique layout.

Current Key Account Management Performance Indicators Pictures PDF
The following slide provides information about the current key account management KPIs of the company which are shown in the form of graphs and for the past 5 years. The KPIs are key account satisfaction rate, key account interaction rate, key account churn rate and key account upsell rate. Are you in need of a template that can accommodate all of your creative concepts This one is crafted professionally and can be altered to fit any style. Use it with Google Slides or PowerPoint. Include striking photographs, symbols, depictions, and other visuals. Fill, move around, or remove text boxes as desired. Test out color palettes and font mixtures. Edit and save your work, or work with colleagues. Download Current Key Account Management Performance Indicators Pictures PDF and observe how to make your presentation outstanding. Give an impeccable presentation to your group and make your presentation unforgettable.
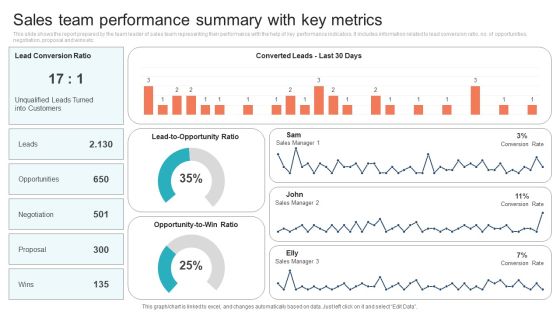
Sales Team Performance Summary With Key Metrics Background PDF
This slide shows the report prepared by the team leader of sales team representing their performance with the help of key performance indicators. It includes information related to lead conversion ratio, no. of opportunities, negotiation, proposal and wins etc. Showcasing this set of slides titled Sales Team Performance Summary With Key Metrics Background PDF. The topics addressed in these templates are Opportunities, Negotiation, Proposal. All the content presented in this PPT design is completely editable. Download it and make adjustments in color, background, font etc. as per your unique business setting.
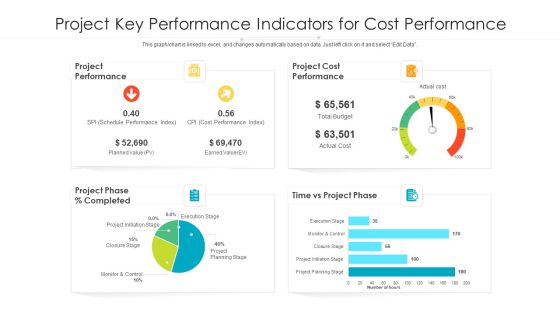
Project Key Performance Indicators For Cost Performance Ppt PowerPoint Presentation File Visuals PDF
Pitch your topic with ease and precision using this project key performance indicators for cost performance ppt powerpoint presentation file rules pdf. This layout presents information on project performance, project cost performance, schedule performance, closure stage. It is also available for immediate download and adjustment. So, changes can be made in the color, design, graphics or any other component to create a unique layout.
Key Performance Indicators To Track Sales Performance Ppt PowerPoint Presentation Icon Diagrams PDF
Showcasing this set of slides titled key performance indicators to track sales performance ppt powerpoint presentation icon diagrams pdf. The topics addressed in these templates are key performance indicators to track sales performance. All the content presented in this PPT design is completely editable. Download it and make adjustments in color, background, font etc. as per your unique business setting.

Calculate Facebook Key Performance Indicator And Track Your Performance Information PDF
Showcasing this set of slides titled calculate facebook key performance indicator and track your performance information pdf. The topics addressed in these templates are calculate facebook key performance indicator and track your performance. All the content presented in this PPT design is completely editable. Download it and make adjustments in color, background, font etc. as per your unique business setting.
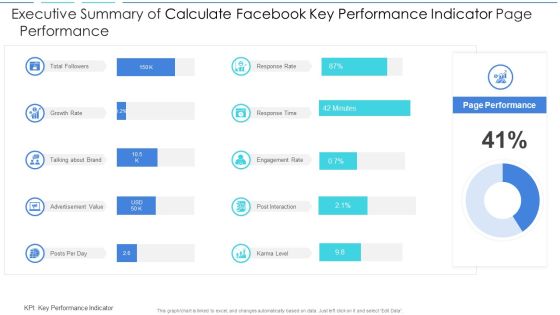
Executive Summary Of Calculate Facebook Key Performance Indicator Page Performance Download PDF
Showcasing this set of slides titled executive summary of calculate facebook key performance indicator page performance download pdf. The topics addressed in these templates are executive summary of calculate facebook key performance indicator page performance. All the content presented in this PPT design is completely editable. Download it and make adjustments in color, background, font etc. as per your unique business setting.
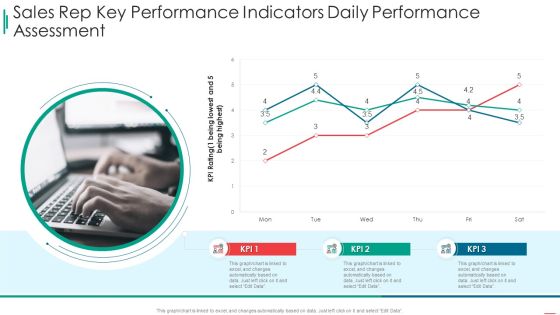
Sales Rep Scorecard Sales Rep Key Performance Indicators Daily Performance Assessment Sample PDF
Deliver and pitch your topic in the best possible manner with this sales rep scorecard sales rep key performance indicators daily performance assessment sample pdf. Use them to share invaluable insights on sales rep key performance indicators daily performance assessment and impress your audience. This template can be altered and modified as per your expectations. So, grab it now.

Venture Capitalist Control Board Key Performance Indicators Dashboard For Operational Performance Analysis Formats PDF
Presenting this set of slides with name venture capitalist control board key performance indicators dashboard for operational performance analysis formats pdf. The topics discussed in these slides are revenue and volume, research production, new client onboarding, trade support staff productivity, trade error frequency. This is a completely editable PowerPoint presentation and is available for immediate download. Download now and impress your audience.

Startup Business Financial Dashboard With Key Metrics Sample PDF
This slide represents the financial dashboard for startup company with key performance indicators. It includes details related to current working capital, cash conversion cycle in days and vendor payment error rate. Pitch your topic with ease and precision using this Startup Business Financial Dashboard With Key Metrics Sample PDF. This layout presents information on Cash Conversion Cycle, Current Working Capital, Current Liabilities Debt. It is also available for immediate download and adjustment. So, changes can be made in the color, design, graphics or any other component to create a unique layout.
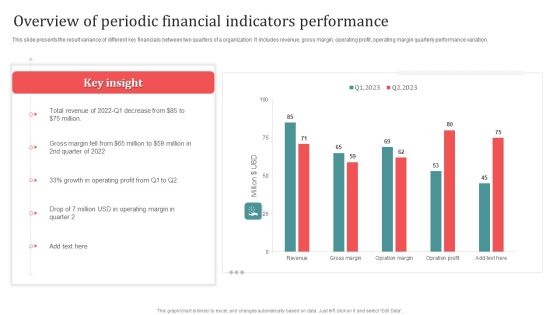
Overview Of Periodic Financial Indicators Performance Designs PDF
This slide presents the result variance of different key financials between two quarters of a organization. It includes revenue, gross margin, operating profit, operating margin quarterly performance variation. Showcasing this set of slides titled Overview Of Periodic Financial Indicators Performance Designs PDF. The topics addressed in these templates are Overview Of Periodic, Financial Indicators Performance. All the content presented in this PPT design is completely editable. Download it and make adjustments in color, background, font etc. as per your unique business setting.
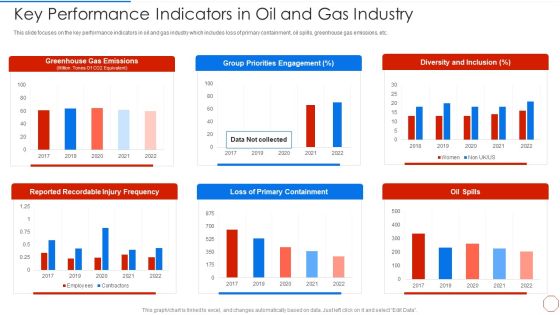
Minimizing Operational Cost Through Iot Virtual Twins Implementation Key Performance Indicators Slides PDF
Deliver and pitch your topic in the best possible manner with this minimizing operational cost through iot virtual twins implementation key performance indicators slides pdf. Use them to share invaluable insights on key performance indicators in oil and gas industry and impress your audience. This template can be altered and modified as per your expectations. So, grab it now.
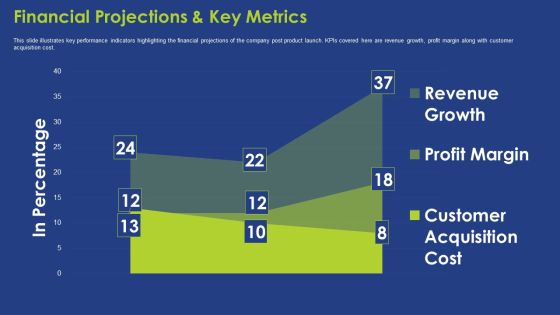
Financial Projections And Key Metrics Ppt Summary Background PDF
This slide illustrates key performance indicators highlighting the financial projections of the company post product launch. KPIs covered here are revenue growth, profit margin along with customer acquisition cost. Deliver an awe inspiring pitch with this creative financial projections and key metrics ppt summary background pdf bundle. Topics like financial projections and key metrics can be discussed with this completely editable template. It is available for immediate download depending on the needs and requirements of the user.
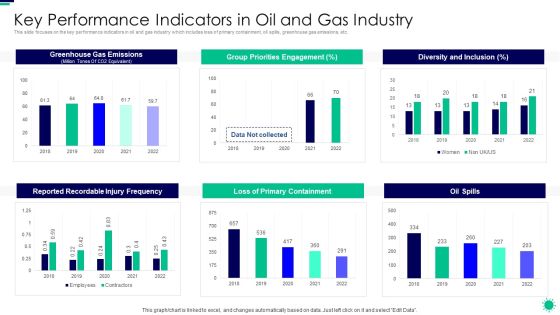
Purpose Digital Twin Internet Things Reducing Costs After COVID Era Key Performance Indicators Infographics PDF
This slide focuses on the key performance indicators in oil and gas industry which includes loss of primary containment, oil spills, greenhouse gas emissions, etc. Deliver and pitch your topic in the best possible manner with this purpose digital twin internet things reducing costs after covid era key performance indicators infographics pdf. Use them to share invaluable insights on key performance indicators in oil and gas industry and impress your audience. This template can be altered and modified as per your expectations. So, grab it now.

Key Company Financial Operation Performance Metrics Ppt Infographic Template Example Introduction PDF
This slide showcases key performance indicators for every business. Key metrics covered are return on assets and equity, working capital ratio, debt and equity ratio. Showcasing this set of slides titled Key Company Financial Operation Performance Metrics Ppt Infographic Template Example Introduction PDF. The topics addressed in these templates are Return on Assets, Working Capital Ratio, Return on Equity. All the content presented in this PPT design is completely editable. Download it and make adjustments in color, background, font etc. as per your unique business setting.

Key Metrics To Measure Current Performance Of Ecommerce Website Clipart PDF
This slide represents the key performance indicators to track and monitor the performance of ecommerce website to draw effective strategies to tackle the problems. It includes key metrics for ecommerce website performance measurement such as average order value and shopping cart abandonment rate.The best PPT templates are a great way to save time, energy, and resources. Slidegeeks have 100precent editable powerpoint slides making them incredibly versatile. With these quality presentation templates, you can create a captivating and memorable presentation by combining visually appealing slides and effectively communicating your message. Download Key Metrics To Measure Current Performance Of Ecommerce Website Clipart PDF from Slidegeeks and deliver a wonderful presentation.

Iot Digital Twin Technology Post Covid Expenditure Management Key Performance Indicators Background PDF
This slide focuses on the key performance indicators in oil and gas industry which includes loss of primary containment, oil spills, greenhouse gas emissions, etc. Deliver an awe inspiring pitch with this creative iot digital twin technology post covid expenditure management key performance indicators background pdf bundle. Topics like key performance indicators in oil and gas industry can be discussed with this completely editable template. It is available for immediate download depending on the needs and requirements of the user.

Price Benefit Internet Things Digital Twins Execution After Covid Key Performance Indicators In Oil Slides PDF
This slide focuses on the key performance indicators in oil and gas industry which includes loss of primary containment, oil spills, greenhouse gas emissions, etc. Deliver an awe inspiring pitch with this creative price benefit internet things digital twins execution after covid key performance indicators in oil slides pdf bundle. Topics like key performance indicators in oil and gas industry can be discussed with this completely editable template. It is available for immediate download depending on the needs and requirements of the user.
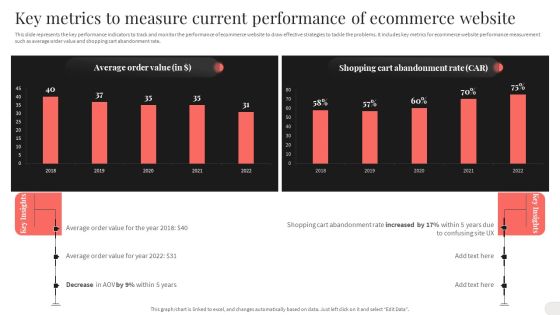
Key Metrics To Measure Current Performance Of Ecommerce Website Structure PDF
This slide represents the key performance indicators to track and monitor the performance of ecommerce website to draw effective strategies to tackle the problems. It includes key metrics for ecommerce website performance measurement such as average order value and shopping cart abandonment rate. There are so many reasons you need a Key Metrics To Measure Current Performance Of Ecommerce Website Structure PDF. The first reason is you can not spend time making everything from scratch, Thus, Slidegeeks has made presentation templates for you too. You can easily download these templates from our website easily.
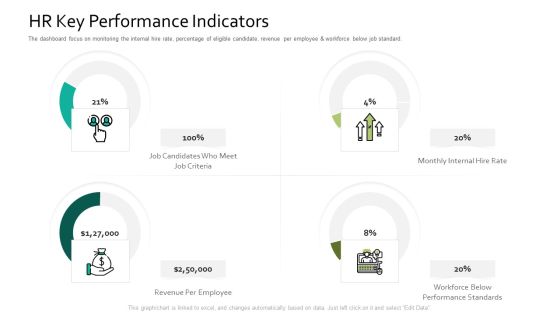
HR Key Performance Indicators Human Resource Information System For Organizational Effectiveness Pictures PDF
Deliver an awe inspiring pitch with this creative hr key performance indicators human resource information system for organizational effectiveness pictures pdf bundle. Topics like revenue, employee, performance, rate can be discussed with this completely editable template. It is available for immediate download depending on the needs and requirements of the user.

Key Performance Indicators Field Service Management Ppt PowerPoint Presentation Gallery Rules PDF
Presenting this set of slides with name key performance indicators field service management ppt powerpoint presentation gallery rules pdf. The topics discussed in these slide is key performance indicators field service management. This is a completely editable PowerPoint presentation and is available for immediate download. Download now and impress your audience.
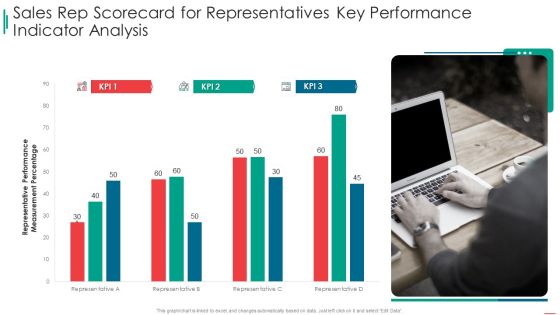
Sales Rep Scorecard Sales Rep Scorecard For Representatives Key Performance Indicator Analysis Portrait PDF
Deliver an awe inspiring pitch with this creative sales rep scorecard sales rep scorecard for representatives key performance indicator analysis portrait pdf bundle. Topics like sales rep scorecard for representatives key performance indicator analysis can be discussed with this completely editable template. It is available for immediate download depending on the needs and requirements of the user.
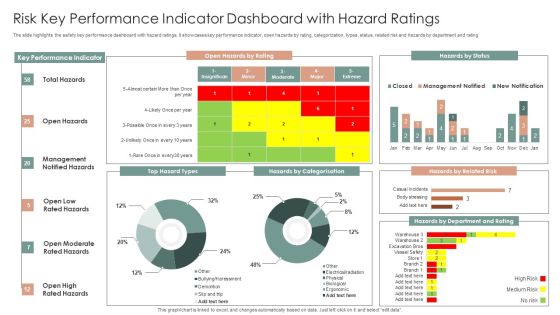
Risk Key Performance Indicator Dashboard With Hazard Ratings Ppt Layouts Slideshow PDF
The slide highlights the safety key performance dashboard with hazard ratings. It showcases key performance indicator, open hazards by rating, categorization, types, status, related risk and hazards by department and rating. Showcasing this set of slides titled Risk Key Performance Indicator Dashboard With Hazard Ratings Ppt Layouts Slideshow PDF. The topics addressed in these templates are Key Performance Indicator, Open Hazards, Hazards By Status. All the content presented in this PPT design is completely editable. Download it and make adjustments in color, background, font etc. as per your unique business setting.
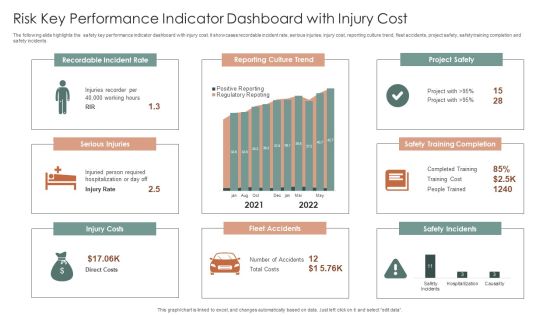
Risk Key Performance Indicator Dashboard With Injury Cost Ppt Summary Brochure PDF
The following slide highlights the safety key performance indicator dashboard with injury cost. It showcases recordable incident rate, serious injuries, injury cost, reporting culture trend, fleet accidents, project safety, safety training completion and safety incidents. Pitch your topic with ease and precision using this Risk Key Performance Indicator Dashboard With Injury Cost Ppt Summary Brochure PDF. This layout presents information on Recordable Incident Rate, Reporting Culture Trend, Project Safety. It is also available for immediate download and adjustment. So, changes can be made in the color, design, graphics or any other component to create a unique layout.
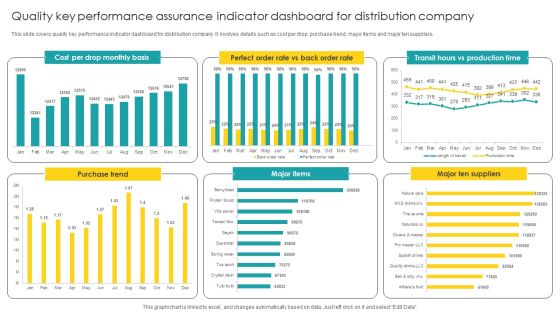
Quality Key Performance Assurance Indicator Dashboard For Distribution Company Mockup PDF
Showcasing this set of slides titled Quality Key Performance Assurance Indicator Dashboard For Distribution Company Mockup PDF. The topics addressed in these templates are Performance Assurance, Indicator Dashboard, Distribution Company. All the content presented in this PPT design is completely editable. Download it and make adjustments in color, background, font etc. as per your unique business setting.

Software Implementation Technique Key Performance Indicators Highlighting Current Problems Elements PDF
This slide represents the key performance indicators to track the problems faced by organization and draw effective strategies to tackle the problems. It includes key performance indicators of decline in organizational sales and customer engagement rate. Make sure to capture your audiences attention in your business displays with our gratis customizable Software Implementation Technique Key Performance Indicators Highlighting Current Problems Elements PDF. These are great for business strategies, office conferences, capital raising or task suggestions. If you desire to acquire more customers for your tech business and ensure they stay satisfied, create your own sales presentation with these plain slides.
Multiple Project Progress Tracking Report Dashboard With Key Performance Indicators Brochure PDF
This slide shows the dashboard representing status of various projects and tracking their performance with the help of key performance indicators which are as follows schedule, budget, resources, risk and issues and quality of projects.Pitch your topic with ease and precision using this Multiple Project Progress Tracking Report Dashboard With Key Performance Indicators Brochure PDF. This layout presents information on Risks Issues, Quality Open Defects, Techno Blogger. It is also available for immediate download and adjustment. So, changes can be made in the color, design, graphics or any other component to create a unique layout.
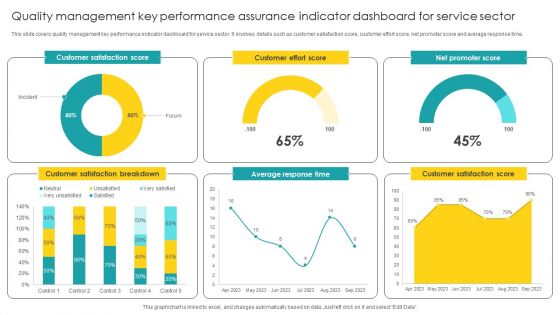
Quality Management Key Performance Assurance Indicator Dashboard For Service Sector Designs PDF
Showcasing this set of slides titled Quality Management Key Performance Assurance Indicator Dashboard For Service Sector Designs PDF. The topics addressed in these templates are Assurance Indicator, Dashboard For Service Sector. All the content presented in this PPT design is completely editable. Download it and make adjustments in color, background, font etc. as per your unique business setting.

Patient Health And Risk Key Performance Indicator Dashboard Ppt Infographic Template Summary PDF
The following slide highlights the patient health and safety key performance indicator dashboard illustrating admission by department, admission by cost, patient satisfaction, total patients, operations cost, patient density, total staff, waiting time, treatment satisfaction and treatment confidence. Pitch your topic with ease and precision using this Patient Health And Risk Key Performance Indicator Dashboard Ppt Infographic Template Summary PDF. This layout presents information on Admission By Department, Admission Vs Cost, Patient Satisfaction. It is also available for immediate download and adjustment. So, changes can be made in the color, design, graphics or any other component to create a unique layout.
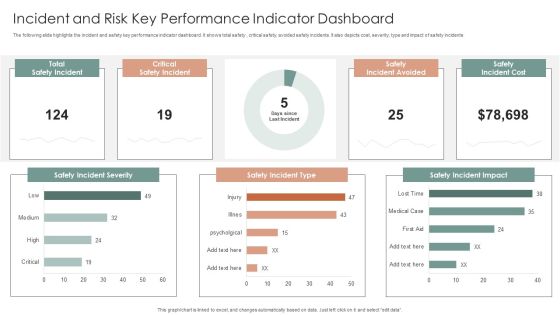
Incident And Risk Key Performance Indicator Dashboard Ppt Gallery Mockup PDF
The following slide highlights the incident and safety key performance indicator dashboard. It shows total safety, critical safety, avoided safety incidents. It also depicts cost, severity, type and impact of safety incidents. Showcasing this set of slides titled Incident And Risk Key Performance Indicator Dashboard Ppt Gallery Mockup PDF. The topics addressed in these templates are Safety Incident Severity, Safety Incident Type, Safety Incident Impact. All the content presented in this PPT design is completely editable. Download it and make adjustments in color, background, font etc. as per your unique business setting.
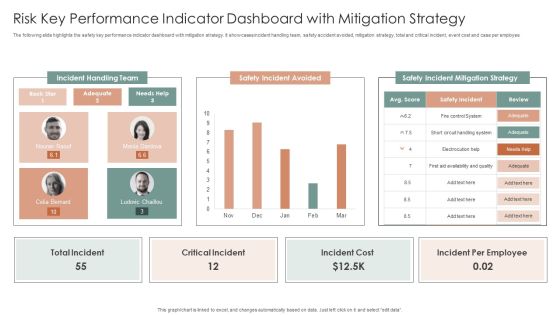
Risk Key Performance Indicator Dashboard With Mitigation Strategy Ppt Inspiration Design Templates PDF
The following slide highlights the safety key performance indicator dashboard with mitigation strategy. It showcases incident handling team, safety accident avoided, mitigation strategy, total and critical incident, event cost and case per employee. Showcasing this set of slides titled Risk Key Performance Indicator Dashboard With Mitigation Strategy Ppt Inspiration Design Templates PDF. The topics addressed in these templates are Incident Handling Team, Safety Incident Avoided, Safety Incident. All the content presented in this PPT design is completely editable. Download it and make adjustments in color, background, font etc. as per your unique business setting.

You Tube Advertising Dashboard With Key Performance Indicators Ppt Outline Graphics Example PDF
This slide represents the dashboard showing the performance of the you tube marketing channel along with their key performance indicators. It includes details related to the no. of subscribers, top 5 most viewed videos etc. Showcasing this set of slides titled You Tube Advertising Dashboard With Key Performance Indicators Ppt Outline Graphics Example PDF. The topics addressed in these templates are Subscribers Gender, Subscribers Age Group, Top 5 Videos. All the content presented in this PPT design is completely editable. Download it and make adjustments in color, background, font etc. as per your unique business setting.

Key Performance Indicators For SCM Ppt PowerPoint Presentation File Graphic Tips PDF
Presenting this set of slides with name key performance indicators for scm ppt powerpoint presentation file graphic tips pdf. The topics discussed in these slides are global, financial, perform. This is a completely editable PowerPoint presentation and is available for immediate download. Download now and impress your audience.
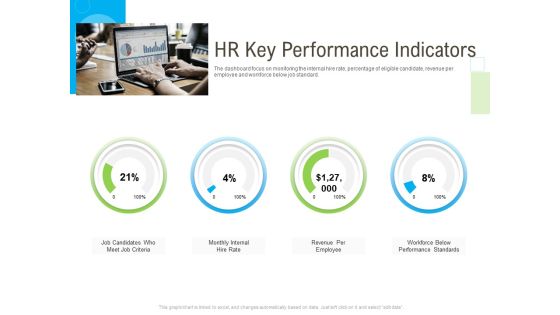
Rapid Innovation In HR Technology Space HR Key Performance Indicators Slides PDF
Deliver an awe inspiring pitch with this creative rapid innovation in hr technology space hr key performance indicators slides pdf bundle. Topics like criteria, workforce, performance, revenue, internal can be discussed with this completely editable template. It is available for immediate download depending on the needs and requirements of the user.
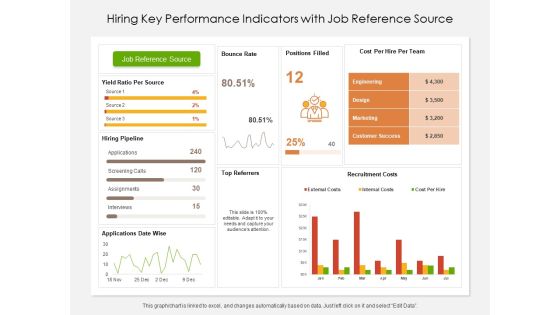
Hiring Key Performance Indicators With Job Reference Source Ppt PowerPoint Presentation Gallery Graphics Example PDF
Presenting this set of slides with name hiring key performance indicators with job reference source ppt powerpoint presentation gallery graphics example pdf. The topics discussed in these slides are source, cost, recruitment. This is a completely editable PowerPoint presentation and is available for immediate download. Download now and impress your audience.
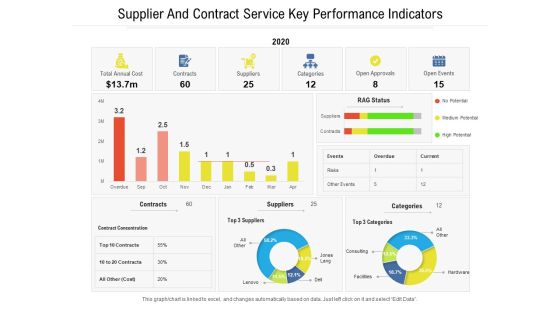
Supplier And Contract Service Key Performance Indicators Ppt PowerPoint Presentation File Inspiration PDF
Presenting this set of slides with name supplier and contract service key performance indicators ppt powerpoint presentation file inspiration pdf. The topics discussed in these slides are cost, suppliers, potential. This is a completely editable PowerPoint presentation and is available for immediate download. Download now and impress your audience.

Key Performance Indicators Highlighting Current Problems Of Organization Application Deployment Project Plan Rules PDF
This slide represents the key performance indicators to track the problems faced by organization and draw effective strategies to tackle the problems. It includes key performance indicators of decline in organizational sales and customer engagement rate. Coming up with a presentation necessitates that the majority of the effort goes into the content and the message you intend to convey. The visuals of a PowerPoint presentation can only be effective if it supplements and supports the story that is being told. Keeping this in mind our experts created Key Performance Indicators Highlighting Current Problems Of Organization Application Deployment Project Plan Rules PDF to reduce the time that goes into designing the presentation. This way, you can concentrate on the message while our designers take care of providing you with the right template for the situation.

System Deployment Project Key Performance Indicators Highlighting Current Problems Information PDF
This slide represents the key performance indicators to track the problems faced by organization and draw effective strategies to tackle the problems. It includes key performance indicators of decline in organizational sales and customer engagement rate. Coming up with a presentation necessitates that the majority of the effort goes into the content and the message you intend to convey. The visuals of a PowerPoint presentation can only be effective if it supplements and supports the story that is being told. Keeping this in mind our experts created System Deployment Project Key Performance Indicators Highlighting Current Problems Information PDF to reduce the time that goes into designing the presentation. This way, you can concentrate on the message while our designers take care of providing you with the right template for the situation.
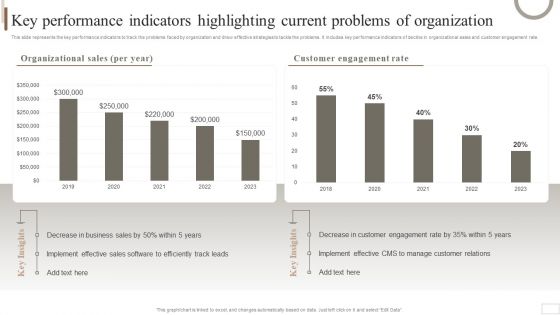
Strategic Plan For Enterprise Key Performance Indicators Highlighting Current Problems Diagrams PDF
This slide represents the key performance indicators to track the problems faced by organization and draw effective strategies to tackle the problems. It includes key performance indicators of decline in organizational sales and customer engagement rate. Coming up with a presentation necessitates that the majority of the effort goes into the content and the message you intend to convey. The visuals of a PowerPoint presentation can only be effective if it supplements and supports the story that is being told. Keeping this in mind our experts created Strategic Plan For Enterprise Key Performance Indicators Highlighting Current Problems Diagrams PDF to reduce the time that goes into designing the presentation. This way, you can concentrate on the message while our designers take care of providing you with the right template for the situation.

Comparative Health And Risk Key Performance Indicator Dashboard Ppt Portfolio Slide PDF
The slide highlights the comparative health and safety key performance indicator dashboard. It shows current year and previous events, safety incident classification, safety cases by place, map and safety consequence. Showcasing this set of slides titled Comparative Health And Risk Key Performance Indicator Dashboard Ppt Portfolio Slide PDF. The topics addressed in these templates are Safety Consequence, Safety Incidents Classification, Map. All the content presented in this PPT design is completely editable. Download it and make adjustments in color, background, font etc. as per your unique business setting.

Employee Risk Key Performance Indicator Dashboard With Case Incident Rate Ppt Professional Information PDF
The following slide highlights the employee safety key performance indicator dashboard with case incident rate illustrating total case occurrence rate, last reported case, days without reported, causing items, corrective actions, incident pyramid, incident by month and major causes. Pitch your topic with ease and precision using this Employee Risk Key Performance Indicator Dashboard With Case Incident Rate Ppt Professional Information PDF. This layout presents information on Total Case, Incident Rate, Last Incident Reported, Incident Causing Items. It is also available for immediate download and adjustment. So, changes can be made in the color, design, graphics or any other component to create a unique layout.

Risk Awareness And Risk Key Performance Indicator Dashboard Ppt Inspiration Ideas PDF
The following slide highlights the risk awareness and safety key performance indicator dashboard illustrating risk awareness, clear leadership, risk mitigation preparedness, risk incidents last month, safety incidents last months, inspection plan adherence, risk and safety quality training, trained people last month, monitoring, safety tools change on and risk awareness. Showcasing this set of slides titled Risk Awareness And Risk Key Performance Indicator Dashboard Ppt Inspiration Ideas PDF. The topics addressed in these templates are Safety Incident Avoided, Safety Incidents, Safety Incident, Accumulated Total. All the content presented in this PPT design is completely editable. Download it and make adjustments in color, background, font etc. as per your unique business setting.

Risk Key Performance Indicator Dashboard For Manufacturing Company Ppt Gallery Graphics Design PDF
The following slide highlights the safety key performance indicator dashboard for manufacturing company. It showcases safety incident per employee, total number of cases, safety events avoided, accumulated total and safety incidents. Pitch your topic with ease and precision using this Risk Key Performance Indicator Dashboard For Manufacturing Company Ppt Gallery Graphics Design PDF. This layout presents information on Safety Incidents, Safety Incident Avoided, Safety Incident Accumulated. It is also available for immediate download and adjustment. So, changes can be made in the color, design, graphics or any other component to create a unique layout.

Scrum Master Key Performance Indicators And Kpis Ppt Gallery Files PDF
This slide illustrates graphical representation of performance reviews of scrum team. It includes average task results, key areas and reviews etc. Showcasing this set of slides titled Scrum Master Key Performance Indicators And Kpis Ppt Gallery Files PDF. The topics addressed in these templates are Scrum Team, Average Task Results, Project Timeline Management. All the content presented in this PPT design is completely editable. Download it and make adjustments in color, background, font etc. as per your unique business setting.
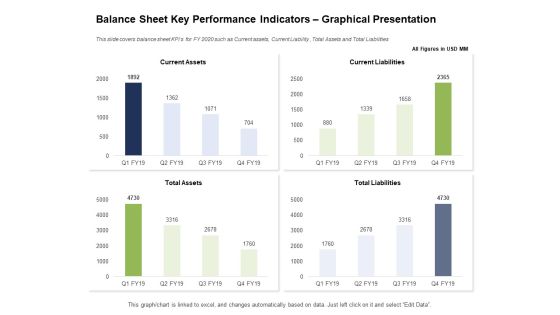
Ways To Bounce Back From Insolvency Balance Sheet Key Performance Indicators Graphical Presentation Brochure PDF
Presenting this set of slides with name ways to bounce back from insolvency balance sheet key performance indicators graphical presentation brochure pdf. The topics discussed in these slides are current assets, current liabilities, total assets, total liabilities. This is a completely editable PowerPoint presentation and is available for immediate download. Download now and impress your audience.

Issues Which Leads To Insolvency Balance Sheet Key Performance Indicators Graphical Presentation Information PDF
Presenting this set of slides with name issues which leads to insolvency balance sheet key performance indicators graphical presentation information pdf. The topics discussed in these slides are current assets, current liabilities, total assets, total liabilities. This is a completely editable PowerPoint presentation and is available for immediate download. Download now and impress your audience.

Key Performance Indicators Of Sales Growth Ppt PowerPoint Presentation Portfolio Clipart Images PDF
Presenting this set of slides with name key performance indicators of sales growth ppt powerpoint presentation portfolio clipart images pdf. The topics discussed in these slides are monthly total sales, monthly sales volume, compare with last month, sales volume by category. This is a completely editable PowerPoint presentation and is available for immediate download. Download now and impress your audience.

Dashboard Showing Key Performance Indicators Of Recruitment Ppt PowerPoint Presentation File Background Image PDF
Presenting this set of slides with name dashboard showing key performance indicators of recruitment ppt powerpoint presentation file background image pdf. The topics discussed in these slides are executive, funnel, department. This is a completely editable PowerPoint presentation and is available for immediate download. Download now and impress your audience.
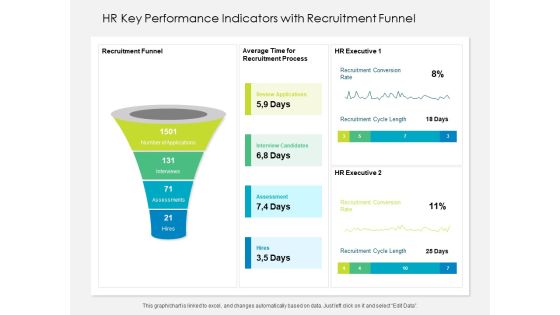
HR Key Performance Indicators With Recruitment Funnel Ppt PowerPoint Presentation File Formats PDF
Presenting this set of slides with name hr key performance indicators with recruitment funnel ppt powerpoint presentation file formats pdf. The topics discussed in these slides are funnel, process, recruitment. This is a completely editable PowerPoint presentation and is available for immediate download. Download now and impress your audience.
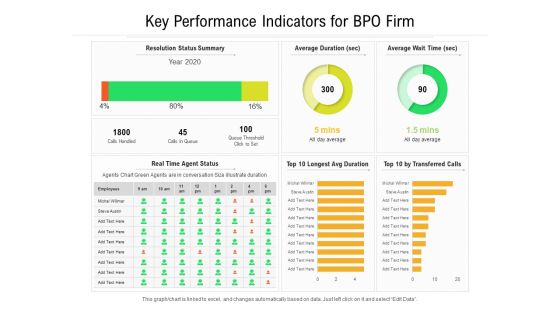
Key Performance Indicators For BPO Firm Ppt PowerPoint Presentation File Picture PDF
Presenting this set of slides with name key performance indicators for bpo firm ppt powerpoint presentation file picture pdf. The topics discussed in these slides are resolution, average, queue. This is a completely editable PowerPoint presentation and is available for immediate download. Download now and impress your audience.

Key Performance Indicators For Business Event Planning Ppt PowerPoint Presentation Gallery Graphic Images PDF
Presenting this set of slides with name key performance indicators for business event planning ppt powerpoint presentation gallery graphic images pdf. The topics discussed in these slides are industries, training, volunteers. This is a completely editable PowerPoint presentation and is available for immediate download. Download now and impress your audience.

Key Performance Indicators For Information Technology Business Ppt PowerPoint Presentation File Graphics Example PDF
Presenting this set of slides with name key performance indicators for information technology business ppt powerpoint presentation file graphics example pdf. The topics discussed in these slides are service, manufacturer, management. This is a completely editable PowerPoint presentation and is available for immediate download. Download now and impress your audience.
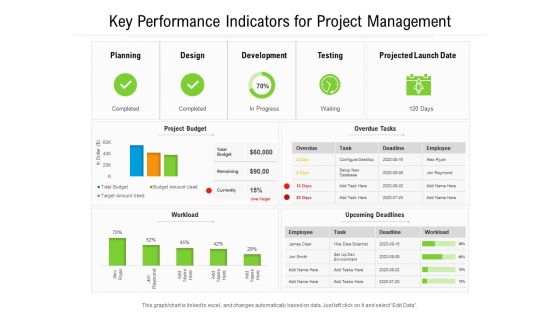
Key Performance Indicators For Project Management Ppt PowerPoint Presentation File Example File PDF
Presenting this set of slides with name key performance indicators for project management ppt powerpoint presentation file example file pdf. The topics discussed in these slides are planning, development, design. This is a completely editable PowerPoint presentation and is available for immediate download. Download now and impress your audience.

Key Performance Indicators For Service Level Agreement Ppt PowerPoint Presentation Gallery Samples PDF
Presenting this set of slides with name key performance indicators for service level agreement ppt powerpoint presentation gallery samples pdf. The topics discussed in these slides are service, current compliance, history. This is a completely editable PowerPoint presentation and is available for immediate download. Download now and impress your audience.

Key Performance Indicators Showing Complaint Resolution Status Ppt PowerPoint Presentation File Styles PDF
Presenting this set of slides with name key performance indicators showing complaint resolution status ppt powerpoint presentation file styles pdf. The topics discussed in these slides are priority, survey, response. This is a completely editable PowerPoint presentation and is available for immediate download. Download now and impress your audience.
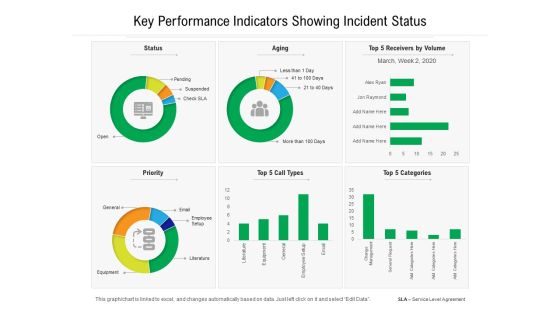
Key Performance Indicators Showing Incident Status Ppt PowerPoint Presentation Gallery Tips PDF
Presenting this set of slides with name key performance indicators showing incident status ppt powerpoint presentation gallery tips pdf. The topics discussed in these slides are priority, categories, aging. This is a completely editable PowerPoint presentation and is available for immediate download. Download now and impress your audience.
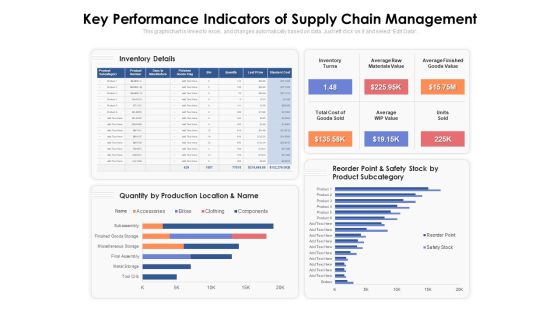
Key Performance Indicators Of Supply Chain Management Ppt PowerPoint Presentation Model Portfolio PDF
Presenting this set of slides with name key performance indicators of supply chain management ppt powerpoint presentation model portfolio pdf. The topics discussed in these slides are inventory details, inventory turns, average raw materials value, average finished goods value, total cost of goods sold, average wip value, units sold. This is a completely editable PowerPoint presentation and is available for immediate download. Download now and impress your audience.

Revenue Performance And Risk Metrics Dashboard Demonstration PDF
This slide illustrates graphical representation of risk key performance indicators. It includes revenue performance of business units with their risk expenditure and people KRIs like employee job satisfaction, customer satisfaction etc. Showcasing this set of slides titled Revenue Performance And Risk Metrics Dashboard Demonstration PDF. The topics addressed in these templates are Total Risk Expenditure, Risk Management, Revenue Performance . All the content presented in this PPT design is completely editable. Download it and make adjustments in color, background, font etc. as per your unique business setting.

Marketing Strategy For Shipping Business Key Performance Indicator Dashboard Graphics PDF
The following slide depicts the key areas in Marketing Strategy for Shipping Business to monitor and optimize supply chain processes. It includes elements such as fleet and shipment status, country wise revenue, location wise delivery, average shipment time etc.Pitch your topic with ease and precision using this Marketing Strategy For Shipping Business Key Performance Indicator Dashboard Graphics PDF. This layout presents information on Shipment Status, Average Shipment, Wise Revenue. It is also available for immediate download and adjustment. So, changes can be made in the color, design, graphics or any other component to create a unique layout.
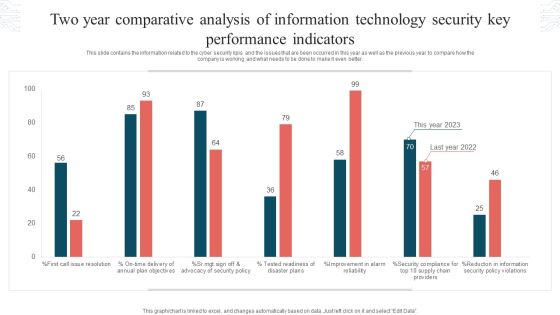
Two Year Comparative Analysis Of Information Technology Security Key Performance Indicators Graphics PDF
This slide contains the information related to the cyber security kpis and the issues that are been occurred in this year as well as the previous year to compare how the company is working and what needs to be done to make it even better. Showcasing this set of slides titled Two Year Comparative Analysis Of Information Technology Security Key Performance Indicators Graphics PDF. The topics addressed in these templates are Tested Readiness, Disaster Plans, Security Policy Violations. All the content presented in this PPT design is completely editable. Download it and make adjustments in color, background, font etc. as per your unique business setting.

Analyzing And Deploying Effective CMS Key Metrics To Measure Current Performance Of Ecommerce Website Infographics PDF
This slide represents the key performance indicators to track and monitor the performance of ecommerce website to draw effective strategies to tackle the problems. It includes key metrics for ecommerce website performance measurement such as average order value and shopping cart abandonment rate. Do you know about Slidesgeeks Analyzing And Deploying Effective CMS Key Metrics To Measure Current Performance Of Ecommerce Website Infographics PDF These are perfect for delivering any kind od presentation. Using it, create PowerPoint presentations that communicate your ideas and engage audiences. Save time and effort by using our pre designed presentation templates that are perfect for a wide range of topic. Our vast selection of designs covers a range of styles, from creative to business, and are all highly customizable and easy to edit. Download as a PowerPoint template or use them as Google Slides themes.

Optimizing Online Stores Key Metrics To Measure Current Performance Download PDF
This slide represents the key performance indicators to track and monitor the performance of ecommerce website to draw effective strategies to tackle the problems. It includes key metrics for ecommerce website performance measurement such as average order value and shopping cart abandonment rate. The Optimizing Online Stores Key Metrics To Measure Current Performance Download PDF is a compilation of the most recent design trends as a series of slides. It is suitable for any subject or industry presentation, containing attractive visuals and photo spots for businesses to clearly express their messages. This template contains a variety of slides for the user to input data, such as structures to contrast two elements, bullet points, and slides for written information. Slidegeeks is prepared to create an impression.
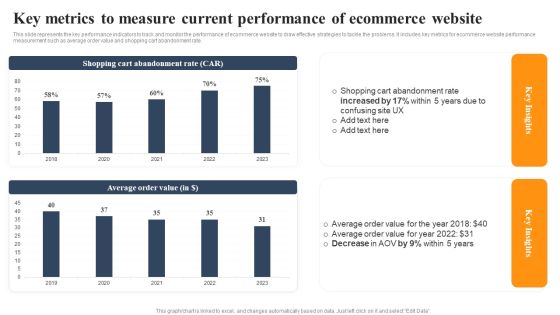
Implementing An Effective Ecommerce Management Framework Key Metrics Current Performance Of Ecommerce Website Slides PDF
This slide represents the key performance indicators to track and monitor the performance of ecommerce website to draw effective strategies to tackle the problems. It includes key metrics for ecommerce website performance measurement such as average order value and shopping cart abandonment rate. The Implementing An Effective Ecommerce Management Framework Key Metrics Current Performance Of Ecommerce Website Slides PDF is a compilation of the most recent design trends as a series of slides. It is suitable for any subject or industry presentation, containing attractive visuals and photo spots for businesses to clearly express their messages. This template contains a variety of slides for the user to input data, such as structures to contrast two elements, bullet points, and slides for written information. Slidegeeks is prepared to create an impression.

Implementing Management System To Enhance Ecommerce Processes Key Metrics To Measure Current Performance Themes PDF
This slide represents the key performance indicators to track and monitor the performance of ecommerce website to draw effective strategies to tackle the problems. It includes key metrics for ecommerce website performance measurement such as average order value and shopping cart abandonment rate. Do you know about Slidesgeeks Implementing Management System To Enhance Ecommerce Processes Key Metrics To Measure Current Performance Themes PDF. These are perfect for delivering any kind od presentation. Using it, create PowerPoint presentations that communicate your ideas and engage audiences. Save time and effort by using our pre designed presentation templates that are perfect for a wide range of topic. Our vast selection of designs covers a range of styles, from creative to business, and are all highly customizable and easy to edit. Download as a PowerPoint template or use them as Google Slides themes.
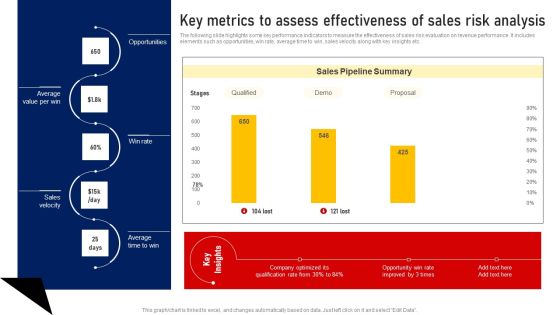
Performing Sales Risk Analysis Procedure Key Metrics To Assess Effectiveness Of Sales Risk Analysis Brochure PDF
The following slide highlights some key performance indicators to measure the effectiveness of sales risk evaluation on revenue performance. It includes elements such as opportunities, win rate, average time to win, sales velocity along with key insights etc. Get a simple yet stunning designed Performing Sales Risk Analysis Procedure Key Metrics To Assess Effectiveness Of Sales Risk Analysis Brochure PDF. It is the best one to establish the tone in your meetings. It is an excellent way to make your presentations highly effective. So, download this PPT today from Slidegeeks and see the positive impacts. Our easy to edit Performing Sales Risk Analysis Procedure Key Metrics To Assess Effectiveness Of Sales Risk Analysis Brochure PDF can be your go to option for all upcoming conferences and meetings. So, what are you waiting for Grab this template today.
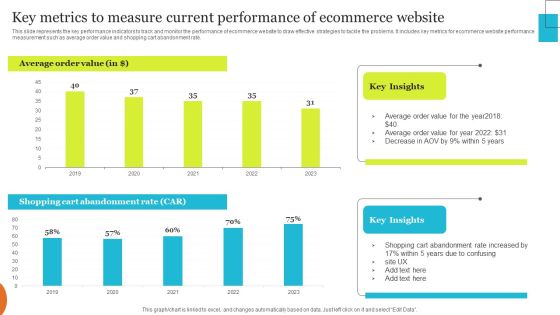
Implementing Effective Ecommerce Managemnet Platform Key Metrics To Measure Current Performance Clipart PDF
This slide represents the key performance indicators to track and monitor the performance of ecommerce website to draw effective strategies to tackle the problems. It includes key metrics for ecommerce website performance measurement such as average order value and shopping cart abandonment rate. Want to ace your presentation in front of a live audience Our Implementing Effective Ecommerce Managemnet Platform Key Metrics To Measure Current Performance Clipart PDF can help you do that by engaging all the users towards you. Slidegeeks experts have put their efforts and expertise into creating these impeccable powerpoint presentations so that you can communicate your ideas clearly. Moreover, all the templates are customizable, and easy to edit and downloadable. Use these for both personal and commercial use.
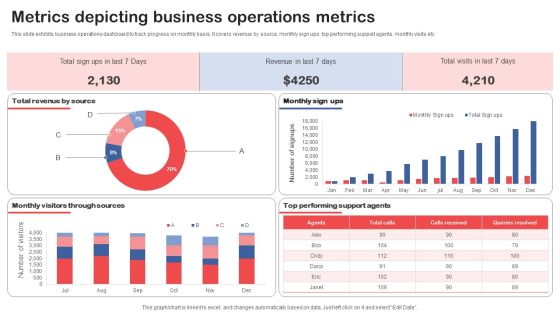
Metrics Depicting Business Operations Metrics Diagrams PDF
Pitch your topic with ease and precision using this Metrics Depicting Business Operations Metrics Diagrams PDF. This layout presents information on Metrics Depicting, Business, Operations Metrics. It is also available for immediate download and adjustment. So, changes can be made in the color, design, graphics or any other component to create a unique layout.
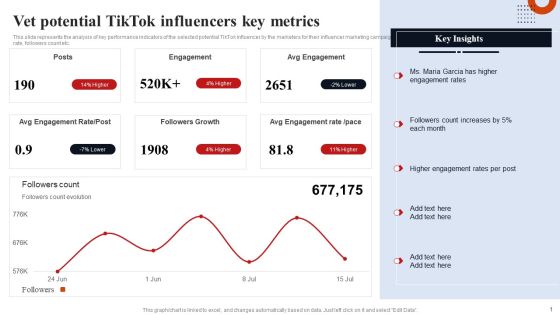
Vet Potential Tiktok Influencers Key Metrics Template PDF
This slide represents the analysis of key performance indicators of the selected potential TikTok influencer by the marketers for their influencer marketing campaign. It includes details related to key metrics such as engagement rate, followers count etc. Explore a selection of the finest Vet Potential Tiktok Influencers Key Metrics Template PDF here. With a plethora of professionally designed and pre made slide templates, you can quickly and easily find the right one for your upcoming presentation. You can use our Vet Potential Tiktok Influencers Key Metrics Template PDF to effectively convey your message to a wider audience. Slidegeeks has done a lot of research before preparing these presentation templates. The content can be personalized and the slides are highly editable. Grab templates today from Slidegeeks.

Iot And Digital Twin To Reduce Costs Post Covid Key Performance Indicators In Oil And Gas Industry Infographics PDF
This slide focuses on the key performance indicators in oil and gas industry which includes loss of primary containment, oil spills, greenhouse gas emissions, etc. Deliver an awe inspiring pitch with this creative iot and digital twin to reduce costs post covid key performance indicators in oil and gas industry infographics pdf bundle. Topics like reported recordable injury frequency, loss of primary containment, oil spills, diversity and inclusion, group priorities engagement can be discussed with this completely editable template. It is available for immediate download depending on the needs and requirements of the user.
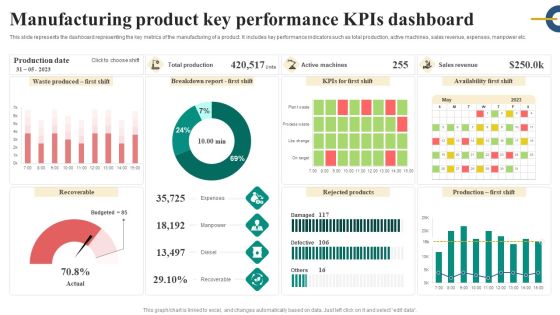
Manufacturing Product Key Performance Kpis Dashboard Inspiration PDF
This slide represents the dashboard representing the key metrics of the manufacturing of a product. It includes key performance indicators such as total production, active machines, sales revenue, expenses, manpower etc. Showcasing this set of slides titled Manufacturing Product Key Performance Kpis Dashboard Inspiration PDF. The topics addressed in these templates are Expenses, Manpower, Diesel, Recoverable. All the content presented in this PPT design is completely editable. Download it and make adjustments in color, background, font etc. as per your unique business setting.
Digital Sales Metrics Showing Enhancement Icons PDF
The following slide represents statistics of online sales key performance indicators KPIs which can assist marketing manager to review their performance and take necessary steps. It include different metrics such as add to cart rate, conversion rate, and revenue per session. Showcasing this set of slides titled Digital Sales Metrics Showing Enhancement Icons PDF. The topics addressed in these templates are Quarterly Online Sales Metrics, Targeted Right Customers, Offered Product Recommendations. All the content presented in this PPT design is completely editable. Download it and make adjustments in color, background, font etc. as per your unique business setting.

Ten Slides Guy Kawasaki Investor Deck Financial Projections And Key Metrics Structure PDF
This slide illustrates key performance indicators highlighting the financial projections of the company post product launch. KPIs covered here are revenue growth, profit margin along with customer acquisition cost. Deliver an awe-inspiring pitch with this creative ten slides guy kawasaki investor deck financial projections and key metrics structure pdf. bundle. Topics like financial projections and key metrics can be discussed with this completely editable template. It is available for immediate download depending on the needs and requirements of the user.

Monthly Financial Metrics Graph With Operating Profit And Cost Of Goods Sold Pictures PDF
This slide showcases monthly analytics for to keep company finances organized and identify problem areas. It further includes details about marketing, professional fees, COGS and other operations. Pitch your topic with ease and precision using this Monthly Financial Metrics Graph With Operating Profit And Cost Of Goods Sold Pictures PDF. This layout presents information on Key Insights, Operating Profit, Total Revenue. It is also available for immediate download and adjustment. So, changes can be made in the color, design, graphics or any other component to create a unique layout.
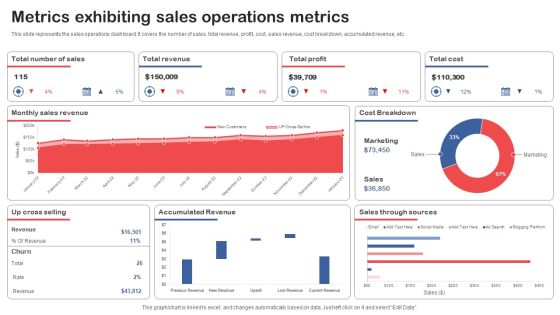
Metrics Exhibiting Sales Operations Metrics Topics PDF
This slide represents the sales operations dashboard. It covers the number of sales, total revenue, profit, cost, sales revenue, cost breakdown, accumulated revenue, etc. Showcasing this set of slides titled Metrics Exhibiting Sales Operations Metrics Topics PDF. The topics addressed in these templates are Total Revenue, Total Profit, Total Cost. All the content presented in this PPT design is completely editable. Download it and make adjustments in color, background, font etc. as per your unique business setting.

Return On Equity Indicators To Measure Company Financial Performance Mockup PDF
This slide showcases a graph of return on equity that represents how well the firm can manage the capital invested by shareholders. Pitch your topic with ease and precision using this Return On Equity Indicators To Measure Company Financial Performance Mockup PDF. This layout presents information on Return On Equity, Key Insights, Positive Return. It is also available for immediate download and adjustment. So, changes can be made in the color, design, graphics or any other component to create a unique layout.

Hiring Key Perfromance Indicators With Active Candidates Ppt PowerPoint Presentation File Microsoft PDF
Presenting this set of slides with name hiring key performance indicators with active candidates ppt powerpoint presentation file microsoft pdf. The topics discussed in these slides are candidate pipeline, active candidates, perm by salary range, inactive candidates, temp by salary range. This is a completely editable PowerPoint presentation and is available for immediate download. Download now and impress your audience.
Sales L2RM System Tracking Key Metrics Dashboard Ppt Professional Format Ideas PDF
This slide represents the dashboard for tracking the key performance indicators of sales lead to revenue management. It includes key metrics such as leads by campaign, ratings, lead generation rate, top accounts by revenue and top owners by number of accounts. Showcasing this set of slides titled Sales L2RM System Tracking Key Metrics Dashboard Ppt Professional Format Ideas PDF. The topics addressed in these templates are Leads By Campaign, Leads By Rating, Leads Generation Rate. All the content presented in this PPT design is completely editable. Download it and make adjustments in color, background, font etc. as per your unique business setting.
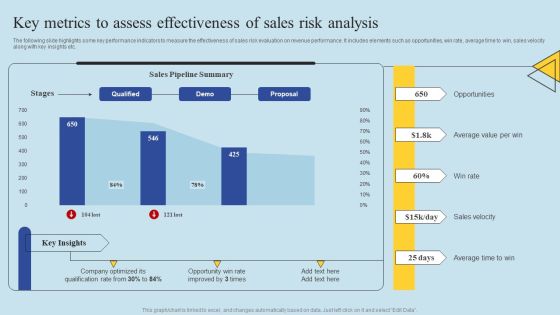
Determining Risks In Sales Administration Procedure Key Metrics To Assess Effectiveness Of Sales Pictures PDF
The following slide highlights some key performance indicators to measure the effectiveness of sales risk evaluation on revenue performance. It includes elements such as opportunities, win rate, average time to win, sales velocity along with key insights etc. This Determining Risks In Sales Administration Procedure Key Metrics To Assess Effectiveness Of Sales Pictures PDF from Slidegeeks makes it easy to present information on your topic with precision. It provides customization options, so you can make changes to the colors, design, graphics, or any other component to create a unique layout. It is also available for immediate download, so you can begin using it right away. Slidegeeks has done good research to ensure that you have everything you need to make your presentation stand out. Make a name out there for a brilliant performance.

Key Metrics To Measure Success Of Video Marketing Campaign Icons PDF
The following slide outlines key performance indicators KPIs that can assist marketers in measuring real estate video marketing campaign performance. The metrics outlined in slide are watch time, click-through rate CTR, conversion rate, customer engagement rate, etc. Formulating a presentation can take up a lot of effort and time, so the content and message should always be the primary focus. The visuals of the PowerPoint can enhance the presenters message, so our Key Metrics To Measure Success Of Video Marketing Campaign Icons PDF was created to help save time. Instead of worrying about the design, the presenter can concentrate on the message while our designers work on creating the ideal templates for whatever situation is needed. Slidegeeks has experts for everything from amazing designs to valuable content, we have put everything into Key Metrics To Measure Success Of Video Marketing Campaign Icons PDF
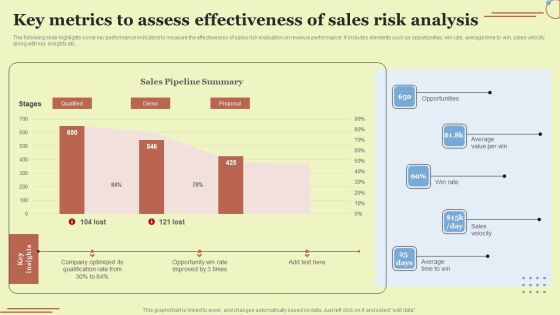
Key Metrics To Assess Effectiveness Of Sales Risk Analysis Download PDF
The following slide highlights some key performance indicators to measure the effectiveness of sales risk evaluation on revenue performance. It includes elements such as opportunities, win rate, average time to win, sales velocity along with key insights etc. Get a simple yet stunning designed Key Metrics To Assess Effectiveness Of Sales Risk Analysis Download PDF. It is the best one to establish the tone in your meetings. It is an excellent way to make your presentations highly effective. So, download this PPT today from Slidegeeks and see the positive impacts. Our easy to edit Key Metrics To Assess Effectiveness Of Sales Risk Analysis Download PDF can be your go to option for all upcoming conferences and meetings. So, what are you waiting for Grab this template today.

Key Metrics To Assess Effectiveness Of Sales Risk Analysis Topics PDF
The following slide highlights some key performance indicators to measure the effectiveness of sales risk evaluation on revenue performance. It includes elements such as opportunities, win rate, average time to win, sales velocity along with key insights etc. Whether you have daily or monthly meetings, a brilliant presentation is necessary. Key Metrics To Assess Effectiveness Of Sales Risk Analysis Topics PDF can be your best option for delivering a presentation. Represent everything in detail using Key Metrics To Assess Effectiveness Of Sales Risk Analysis Topics PDF and make yourself stand out in meetings. The template is versatile and follows a structure that will cater to your requirements. All the templates prepared by Slidegeeks are easy to download and edit. Our research experts have taken care of the corporate themes as well. So, give it a try and see the results.

Executing Sales Risk Reduction Plan Key Metrics To Assess Effectiveness Of Sales Risk Analysis Background PDF
The following slide highlights some key performance indicators to measure the effectiveness of sales risk evaluation on revenue performance. It includes elements such as opportunities, win rate, average time to win, sales velocity along with key insights etc. Get a simple yet stunning designed Executing Sales Risk Reduction Plan Key Metrics To Assess Effectiveness Of Sales Risk Analysis Background PDF. It is the best one to establish the tone in your meetings. It is an excellent way to make your presentations highly effective. So, download this PPT today from Slidegeeks and see the positive impacts. Our easy to edit Executing Sales Risk Reduction Plan Key Metrics To Assess Effectiveness Of Sales Risk Analysis Background PDF can be your go to option for all upcoming conferences and meetings. So, what are you waiting for Grab this template today.

Implementing Sales Volatility Management Techniques Key Metrics To Assess Effectiveness Of Sales Designs PDF
The following slide highlights some key performance indicators to measure the effectiveness of sales risk evaluation on revenue performance. It includes elements such as opportunities, win rate, average time to win, sales velocity along with key insights etc. Do you have an important presentation coming up Are you looking for something that will make your presentation stand out from the rest Look no further than Implementing Sales Volatility Management Techniques Key Metrics To Assess Effectiveness Of Sales Designs PDF. With our professional designs, you can trust that your presentation will pop and make delivering it a smooth process. And with Slidegeeks, you can trust that your presentation will be unique and memorable. So why wait Grab Implementing Sales Volatility Management Techniques Key Metrics To Assess Effectiveness Of Sales Designs PDF today and make your presentation stand out from the rest.

Key Metrics To Assess Effectiveness Of Sales Risk Analysis Ppt Outline Design Ideas PDF
The following slide highlights some key performance indicators to measure the effectiveness of sales risk evaluation on revenue performance. It includes elements such as opportunities, win rate, average time to win, sales velocity along with key insights etc. Retrieve professionally designed Key Metrics To Assess Effectiveness Of Sales Risk Analysis Ppt Outline Design Ideas PDF to effectively convey your message and captivate your listeners. Save time by selecting pre made slideshows that are appropriate for various topics, from business to educational purposes. These themes come in many different styles, from creative to corporate, and all of them are easily adjustable and can be edited quickly. Access them as PowerPoint templates or as Google Slides themes. You do not have to go on a hunt for the perfect presentation because Slidegeeks got you covered from everywhere.
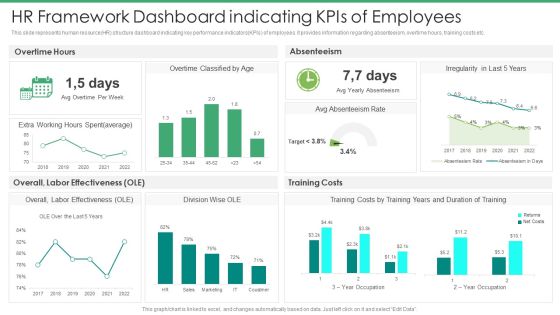
HR Framework Dashboard Indicating Kpis Of Employees Introduction PDF
This slide represents human resource HR structure dashboard indicating key performance indicators KPIs of employees. it provides information regarding absenteeism, overtime hours, training costs etc.Pitch your topic with ease and precision using this HR Framework Dashboard Indicating Kpis Of Employees Introduction PDF. This layout presents information on Absenteeism Rate, Costs, Average. It is also available for immediate download and adjustment. So, changes can be made in the color, design, graphics or any other component to create a unique layout.

Tiktok Digital Marketing Campaign Vet Potential Tiktok Influencers Key Metrics Download PDF
This slide represents the analysis of key performance indicators of the selected potential TikTok influencer by the marketers for their influencer marketing campaign. It includes details related to key metrics such as engagement rate, followers count etc. Do you have to make sure that everyone on your team knows about any specific topic I yes, then you should give Tiktok Digital Marketing Campaign Vet Potential Tiktok Influencers Key Metrics Download PDF a try. Our experts have put a lot of knowledge and effort into creating this impeccable Tiktok Digital Marketing Campaign Vet Potential Tiktok Influencers Key Metrics Download PDF. You can use this template for your upcoming presentations, as the slides are perfect to represent even the tiniest detail. You can download these templates from the Slidegeeks website and these are easy to edit. So grab these today
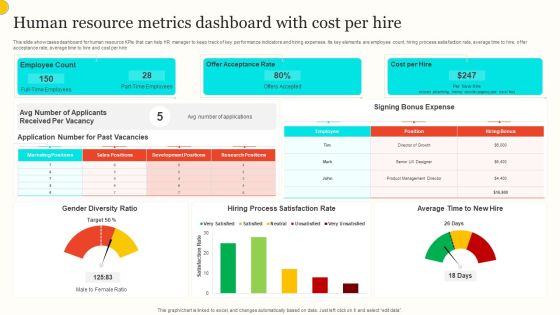
Human Resource Metrics Dashboard With Cost Per Hire Portrait PDF
This slide showcases dashboard for human resource KPIs that can help HR manager to keep track of key performance indicators and hiring expenses. Its key elements are employee count, hiring process satisfaction rate, average time to hire, offer acceptance rate, average time to hire and cost per hire. Showcasing this set of slides titled Human Resource Metrics Dashboard With Cost Per Hire Portrait PDF. The topics addressed in these templates are Employee Count, Offer Acceptance Rate, Cost Per Hire. All the content presented in this PPT design is completely editable. Download it and make adjustments in color, background, font etc. as per your unique business setting.
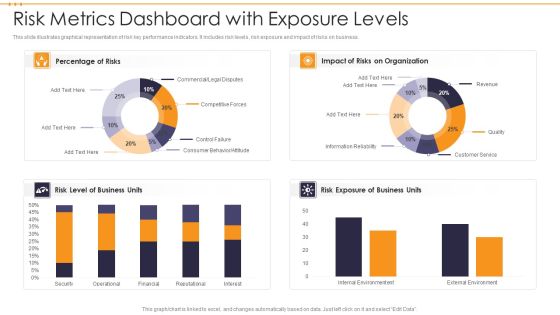
Risk Metrics Dashboard With Exposure Levels Template PDF
This slide illustrates graphical representation of risk key performance indicators. It includes risk levels, risk exposure and impact of risks on business. Pitch your topic with ease and precision using this Risk Metrics Dashboard With Exposure Levels Template PDF. This layout presents information on Risk Metrics Dashboard With Exposure Levels. It is also available for immediate download and adjustment. So, changes can be made in the color, design, graphics or any other component to create a unique layout.

Customer Metrics Dashboard For Retention Management Rate Information PDF
This slide represents dashboard exhibiting customer retention management key performance indicators. It covers NPS, loyal customer rate, customer churn, revenue churn etc. Showcasing this set of slides titled customer metrics dashboard for retention management rate information pdf. The topics addressed in these templates are customer, premium users. All the content presented in this PPT design is completely editable. Download it and make adjustments in color, background, font etc. as per your unique business setting.
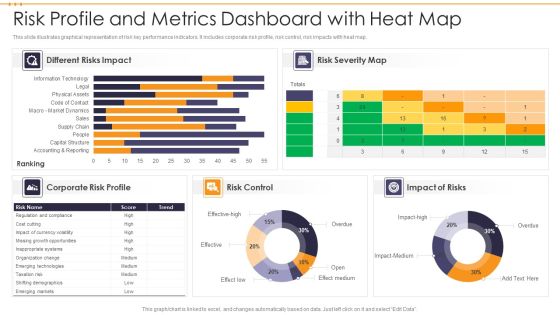
Risk Profile And Metrics Dashboard With Heat Map Brochure PDF
This slide illustrates graphical representation of risk key performance indicators. It includes corporate risk profile, risk control, risk impacts with heat map. Showcasing this set of slides titled Risk Profile And Metrics Dashboard With Heat Map Brochure PDF. The topics addressed in these templates are Risk Control, Impact Of Risks, Risk Severity Map. All the content presented in this PPT design is completely editable. Download it and make adjustments in color, background, font etc. as per your unique business setting.

Corporate Earnings And Risk Metrics Dashboard Guidelines PDF
This slide illustrates graphical representation of risk key performance indicators. It includes financial risks, operational risk and risk expenditure etc. Pitch your topic with ease and precision using this Corporate Earnings And Risk Metrics Dashboard Guidelines PDF. This layout presents information on Financial Risk, Operational Risk Expenditure. It is also available for immediate download and adjustment. So, changes can be made in the color, design, graphics or any other component to create a unique layout.
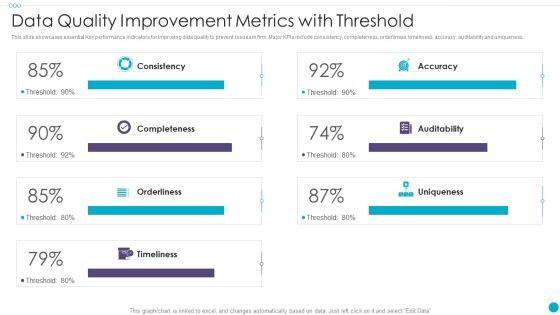
Data Quality Improvement Metrics With Threshold Formats PDF
This slide showcases essential Key performance indicators for improving data quality to prevent issues in firm. Major KPIs include consistency, completeness, orderliness, timeliness, accuracy, auditability and uniqueness. Pitch your topic with ease and precision using this Data Quality Improvement Metrics With Threshold Formats PDF This layout presents information on Auditability, Completeness, Consistency It is also available for immediate download and adjustment. So, changes can be made in the color, design, graphics or any other component to create a unique layout.
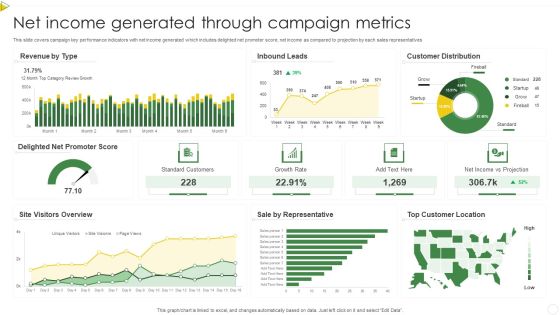
Net Income Generated Through Campaign Metrics Summary PDF
This slide covers campaign key performance indicators with net income generated which includes delighted net promoter score, net income as compared to projection by each sales representatives. Pitch your topic with ease and precision using this Net Income Generated Through Campaign Metrics Summary PDF. This layout presents information on Standard Customers, Growth Rate, Net Income. It is also available for immediate download and adjustment. So, changes can be made in the color, design, graphics or any other component to create a unique layout.

Metrics To Manage Company Cash Flow Ppt Model Gridlines PDF
This slide showcases key metrics used by organizations to manage cashflow. The key performance indicators included are days, receivable, inventory and payable outstanding. Pitch your topic with ease and precision using this Metrics To Manage Company Cash Flow Ppt Model Gridlines PDF. This layout presents information on Days Receivable Outstanding, Days Inventory Outstanding, Days Payable Outstanding. It is also available for immediate download and adjustment. So, changes can be made in the color, design, graphics or any other component to create a unique layout.

Education Dashboard With Fees Collection And Expense Metrics Demonstration PDF
This slide covers education key performance indicators tracking dashboard. It also include metrics such as total students, teachers, parents, total earrings, social media followers, event calendar, fees collection, and expenses. Showcasing this set of slides titled Education Dashboard With Fees Collection And Expense Metrics Demonstration PDF. The topics addressed in these templates are Event Calender, Annual Holidays, Fees Collection, Expenses. All the content presented in this PPT design is completely editable. Download it and make adjustments in color, background, font etc. as per your unique business setting.
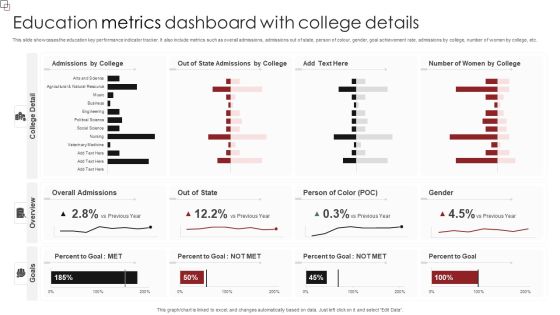
Education Metrics Dashboard With College Details Formats PDF
This slide showcases the education key performance indicator tracker. It also include metrics such as overall admissions, admissions out of state, person of colour, gender, goal achievement rate, admissions by college, number of women by college, etc. Pitch your topic with ease and precision using this Education Metrics Dashboard With College Details Formats PDF. This layout presents information on Overall Admissions, Person Of Color, Percent To Goal. It is also available for immediate download and adjustment. So, changes can be made in the color, design, graphics or any other component to create a unique layout.
Tracking Channel Campaign Metrics To Measure Web Traffic Sample PDF
This slide covers measuring campaign key performance indicators through tracking channel web traffic which includes total visit, cost per click, engagement rate and total impressions. Pitch your topic with ease and precision using this Tracking Channel Campaign Metrics To Measure Web Traffic Sample PDF. This layout presents information on Revenue By Channel, Website Demographics, Product Sales Trend. It is also available for immediate download and adjustment. So, changes can be made in the color, design, graphics or any other component to create a unique layout.

Metrics To Measure Content Advertising Success Demonstration PDF
This slide represents key performance indicators used by marketers to measure effectiveness of content marketing strategy. It covers website traffic, direct sales, lead quality etc. The Metrics To Measure Content Advertising Success Demonstration PDF is a compilation of the most recent design trends as a series of slides. It is suitable for any subject or industry presentation, containing attractive visuals and photo spots for businesses to clearly express their messages. This template contains a variety of slides for the user to input data, such as structures to contrast two elements, bullet points, and slides for written information. Slidegeeks is prepared to create an impression.
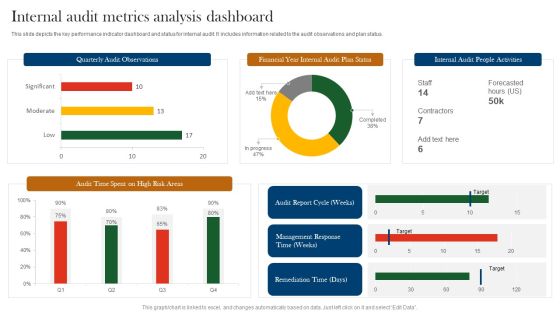
Internal Audit Metrics Analysis Dashboard Ppt Ideas Clipart Images PDF
This slide depicts the key performance indicator dashboard and status for internal audit. It includes information related to the audit observations and plan status. Pitch your topic with ease and precision using this Internal Audit Metrics Analysis Dashboard Ppt Ideas Clipart Images PDF. This layout presents information on Quarterly Audit Observations, Financial Year Internal, Audit Plan Status. It is also available for immediate download and adjustment. So, changes can be made in the color, design, graphics or any other component to create a unique layout.

Mitigating Sales Risks With Strategic Action Planning Key Metrics To Assess Effectiveness Of Sales Risk Analysis Rules PDF
The following slide highlights some key performance indicators to measure the effectiveness of sales risk evaluation on revenue performance. It includes elements such as opportunities, win rate, average time to win, sales velocity along with key insights etc. Create an editable Mitigating Sales Risks With Strategic Action Planning Key Metrics To Assess Effectiveness Of Sales Risk Analysis Rules PDF that communicates your idea and engages your audience. Whether youre presenting a business or an educational presentation, pre designed presentation templates help save time. Mitigating Sales Risks With Strategic Action Planning Key Metrics To Assess Effectiveness Of Sales Risk Analysis Rules PDF is highly customizable and very easy to edit, covering many different styles from creative to business presentations. Slidegeeks has creative team members who have crafted amazing templates. So, go and get them without any delay.
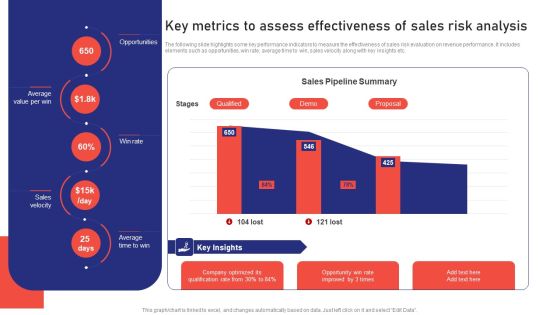
Sales Risk Assessment For Profit Maximization Key Metrics To Assess Effectiveness Of Sales Risk Analysis Ideas PDF
The following slide highlights some key performance indicators to measure the effectiveness of sales risk evaluation on revenue performance. It includes elements such as opportunities, win rate, average time to win, sales velocity along with key insights etc. Get a simple yet stunning designed Sales Risk Assessment For Profit Maximization Key Metrics To Assess Effectiveness Of Sales Risk Analysis Ideas PDF. It is the best one to establish the tone in your meetings. It is an excellent way to make your presentations highly effective. So, download this PPT today from Slidegeeks and see the positive impacts. Our easy to edit Sales Risk Assessment For Profit Maximization Key Metrics To Assess Effectiveness Of Sales Risk Analysis Ideas PDF can be your go to option for all upcoming conferences and meetings. So, what are you waiting for Grab this template today.

Company Performance Of Construction Company With Key Insights Portrait PDF
This slide showcases the construction companys performance on various areas. It include cost, time, quality and safety management, cash flow indicator etc. Pitch your topic with ease and precision using this company performance of construction company with key insights portrait pdf. This layout presents information on performance, management. It is also available for immediate download and adjustment. So, changes can be made in the color, design, graphics or any other component to create a unique layout.
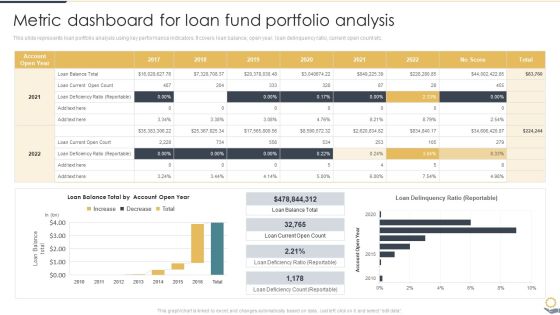
Metric Dashboard For Loan Fund Portfolio Analysis Portfolio Investment Analysis Formats PDF
This slide represents loan portfolio analysis using key performance indicators. It covers loan balance, open year, loan delinquency ratio, current open count etc.From laying roadmaps to briefing everything in detail, our templates are perfect for you. You can set the stage with your presentation slides. All you have to do is download these easy-to-edit and customizable templates. Metric Dashboard For Loan Fund Portfolio Analysis Portfolio Investment Analysis Formats PDF will help you deliver an outstanding performance that everyone would remember and praise you for. Do download this presentation today.
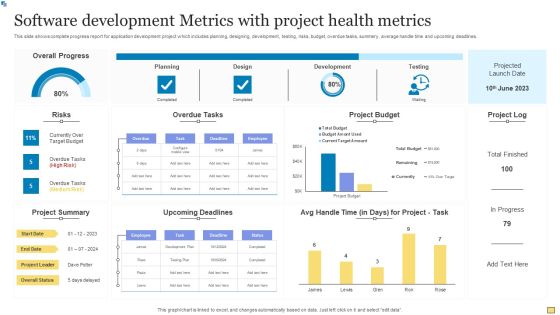
Software Development Metrics With Project Health Metrics Graphics PDF
This slide shows complete progress report for application development project which includes planning, designing, development, testing, risks, budget, overdue tasks, summery, average handle time and upcoming deadlines. Pitch your topic with ease and precision using this Software Development Metrics With Project Health Metrics Graphics PDF. This layout presents information on Overall Progress, Overdue Tasks, Project Budget. It is also available for immediate download and adjustment. So, changes can be made in the color, design, graphics or any other component to create a unique layout.

Safety Team Performance Management Dashboard With Key Kpis Rules PDF
This slide shows a dashboard representing performance measurement of the safety team of the organization on the basis of key performance indicators. It includes details related to safety team performance ranking, average result area scores etc. Pitch your topic with ease and precision using this Safety Team Performance Management Dashboard With Key Kpis Rules PDF. This layout presents information on Improve Corrective Actions, Safety Manager Objective, Conduct Risk Assessment. It is also available for immediate download and adjustment. So, changes can be made in the color, design, graphics or any other component to create a unique layout.
Executive Dashboards For Tracking Key Performance Icons PDF
This slide represents the dashboard for the CEO to track the companys performance. It includes key performance indicators such as no. of deals, open deals, revenue, expected revenue and win percentage. Showcasing this set of slides titled Executive Dashboards For Tracking Key Performance Icons PDF. The topics addressed in these templates are Pen Deals, Revenue, Expected Revenue. All the content presented in this PPT design is completely editable. Download it and make adjustments in color, background, font etc. as per your unique business setting.

Corporate Risk Metrics Dashboard And Control Dashboard With Expenditure Inspiration PDF
This slide illustrates corporate risk key performance indicators. It includes graphs of inherent risks, overdue risks, risk control data. Showcasing this set of slides titled Corporate Risk Metrics Dashboard And Control Dashboard With Expenditure Inspiration PDF. The topics addressed in these templates are Expenditure, Risk Management, Organization Risk. All the content presented in this PPT design is completely editable. Download it and make adjustments in color, background, font etc. as per your unique business setting.

Internal Audit Metrics Dashboard And Status Ppt Layouts Graphic Images PDF
This slide covers the key performance indicator dashboard and status for internal audit. It includes information related to the audit status and risk rating. Pitch your topic with ease and precision using this Internal Audit Metrics Dashboard And Status Ppt Layouts Graphic Images PDF. This layout presents information on Audit Status, Risk Rating, Auditable Entry. It is also available for immediate download and adjustment. So, changes can be made in the color, design, graphics or any other component to create a unique layout.

Dashboard For Tracking Mobile Commercial Banking Marketing Campaign Performance Slides PDF
This slide depicts a dashboard for tracking performance of marketing campaigns of mobile banking across paid media channels. The key performing indicators are client acquisition metrics, client conversion metrics, expense metrics among many others. Showcasing this set of slides titled Dashboard For Tracking Mobile Commercial Banking Marketing Campaign Performance Slides PDF. The topics addressed in these templates are Dashboard For Tracking Mobile, Commercial Banking, Marketing Campaign Performance. All the content presented in this PPT design is completely editable. Download it and make adjustments in color, background, font etc. as per your unique business setting.
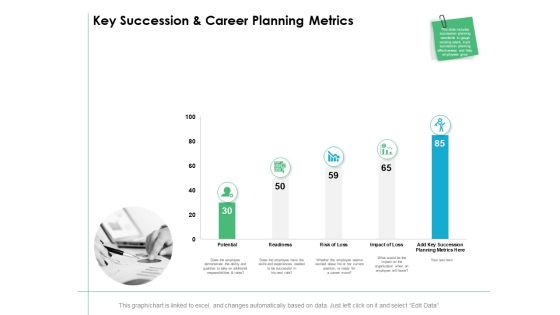
Key Succession And Career Planning Metrics Ppt PowerPoint Presentation Infographics Maker
Presenting this set of slides with name key succession and career planning metrics ppt powerpoint presentation infographics maker. The topics discussed in these slides are finance, analysis, business, investment, marketing. This is a completely editable PowerPoint presentation and is available for immediate download. Download now and impress your audience.

Data Quality Kpis Metrics Scorecard For Core Business Processes Topics PDF
This slide covers score for data obtained from core business activities and process. It includes quality metrics such as accuracy, completeness, consistency, integrity, timeliness, uniqueness and validity for data from business partners, finance, material management, sales, etc. Showcasing this set of slides titled Data Quality Kpis Metrics Scorecard For Core Business Processes Topics PDF. The topics addressed in these templates are Data Quality, Errors, Reports. All the content presented in this PPT design is completely editable. Download it and make adjustments in color, background, font etc. as per your unique business setting.
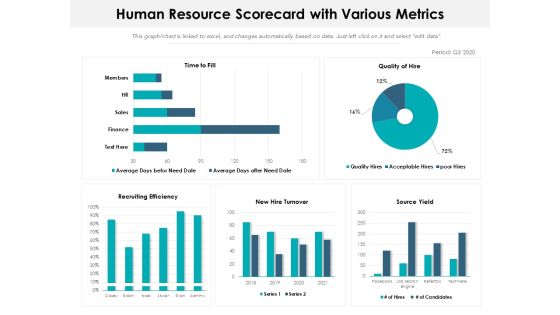
Human Resource Scorecard With Various Metrics Ppt PowerPoint Presentation Slides Demonstration PDF
Presenting this set of slides with name human resource scorecard with various metrics ppt powerpoint presentation slides demonstration pdf. The topics discussed in these slides are hr, sales, finance, recruiting efficiency, source yield, quality of hire. This is a completely editable PowerPoint presentation and is available for immediate download. Download now and impress your audience.

Company Financial Forecast And Essential Metrics Ppt Model Design Templates PDF
This slide shows the projections of the financials of a company with the key performance indicators to know exactly where the business stands and what needs to be enhanced or reduced to make the business profitable. Showcasing this set of slides titled Company Financial Forecast And Essential Metrics Ppt Model Design Templates PDF. The topics addressed in these templates are Budget, Income, Expense, 2018 To 2022. All the content presented in this PPT design is completely editable. Download it and make adjustments in color, background, font etc. as per your unique business setting.

Key Succession And Career Planning Metrics Ppt PowerPoint Presentation Model Deck
Presenting this set of slides with name key succession and career planning metrics ppt powerpoint presentation model deck. The topics discussed in these slides are finance, marketing, management, investment, analysis. This is a completely editable PowerPoint presentation and is available for immediate download. Download now and impress your audience.
 Home
Home