Finance Kpi
Software Developer Playbook Kpi Dashboard For Tracking Project Team Performance Guidelines PDF
Following slide illustrates performance monitoring dashboard that can be used by managers to track their developers team efficiency. It also includes details about billable and non-billable hours along with task summary. Deliver an awe inspiring pitch with this creative software developer playbook kpi dashboard for tracking project team performance guidelines pdf bundle. Topics like task milestone, employee productivity, estimated time, actual time can be discussed with this completely editable template. It is available for immediate download depending on the needs and requirements of the user.
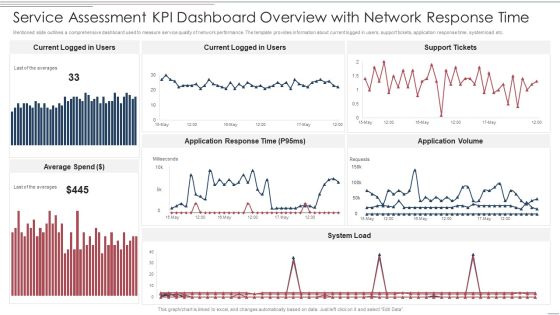
Service Assessment Kpi Dashboard Overview With Network Response Time Themes PDF
Mentioned slide outlines a comprehensive dashboard used to measure service quality of network performance. The template provides information about current logged in users, support tickets, application response time, system load etc. Pitch your topic with ease and precision using this Service Assessment Kpi Dashboard Overview With Network Response Time Themes PDF. This layout presents information on Average Spend, System Load, Application Response Time. It is also available for immediate download and adjustment. So, changes can be made in the color, design, graphics or any other component to create a unique layout.

Maintenance KPI Dashboard Of Service Companies Ppt Outline Graphics Design PDF
This slide focuses on maintenance dashboard which includes total assets, evolution, relevant assets, reports status, alert faults, asset status with good, satisfied, unsatisfied, inaccurate , overdue, completed and in-progress. Pitch your topic with ease and precision using this Maintenance KPI Dashboard Of Service Companies Ppt Outline Graphics Design PDF. This layout presents information on Assent Status Current, Reports Status 2023, Asset Status Evolution. It is also available for immediate download and adjustment. So, changes can be made in the color, design, graphics or any other component to create a unique layout.
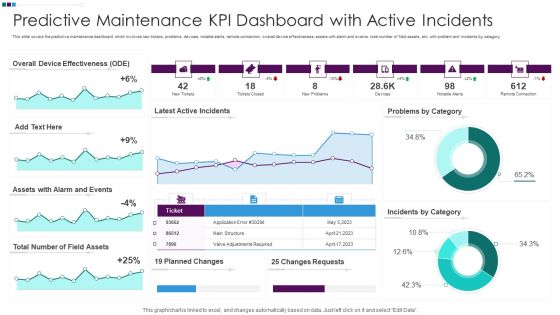
Predictive Maintenance KPI Dashboard With Active Incidents Ppt Slides Backgrounds PDF
This slide covers the predictive maintenance dashboard which involves new tickets, problems, devices, notable alerts, remote connection, overall device effectiveness, assets with alarm and events, total number of field assets, etc. with problem and incidents by category. Showcasing this set of slides titled Predictive Maintenance KPI Dashboard With Active Incidents Ppt Slides Backgrounds PDF. The topics addressed in these templates are Overall Device Effectiveness, Assets Alarm Events, Total Number Field. All the content presented in this PPT design is completely editable. Download it and make adjustments in color, background, font etc. as per your unique business setting.
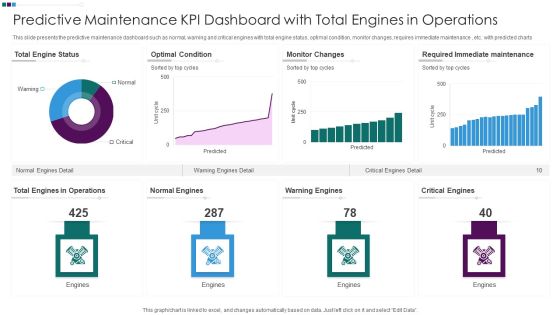
Predictive Maintenance KPI Dashboard With Total Engines In Operations Ppt Professional Inspiration PDF
This slide presents the predictive maintenance dashboard such as normal, warning and critical engines with total engine status, optimal condition, monitor changes, requires immediate maintenance , etc. with predicted charts. Pitch your topic with ease and precision using this Predictive Maintenance KPI Dashboard With Total Engines In Operations Ppt Professional Inspiration PDF. This layout presents information on Total Engine Status, Optimal Condition Monitor, Changes Warning Engines, Required Immediate Maintenance. It is also available for immediate download and adjustment. So, changes can be made in the color, design, graphics or any other component to create a unique layout.

Workforce Management Strategies For Effective Hiring Process Kpi Dashboard To Measure Talent Performance Formats PDF
This slide represents dashboard to measure talent performance in organization. It includes talent applicant status, team training methods, talented candidate status, risk for loss of potential talent pool etc. Deliver an awe inspiring pitch with this creative Workforce Management Strategies For Effective Hiring Process Kpi Dashboard To Measure Talent Performance Formats PDF bundle. Topics like Potential Candidate, Talent Performance, Learning Platform can be discussed with this completely editable template. It is available for immediate download depending on the needs and requirements of the user.

KPI Dashboard Highlighting Automation Results In Supply Chain Management Rules PDF
The following slide outlines a comprehensive dashboard depicting the business process automation BPA results in the supply chain. Information covered in the slide is related to average order processing days, average shipping days, etc. Deliver and pitch your topic in the best possible manner with this KPI Dashboard Highlighting Automation Results In Supply Chain Management Rules PDF. Use them to share invaluable insights on Average Order Fulfillment Days, Average Shipping Days, Average Order Processing Days and impress your audience. This template can be altered and modified as per your expectations. So, grab it now.
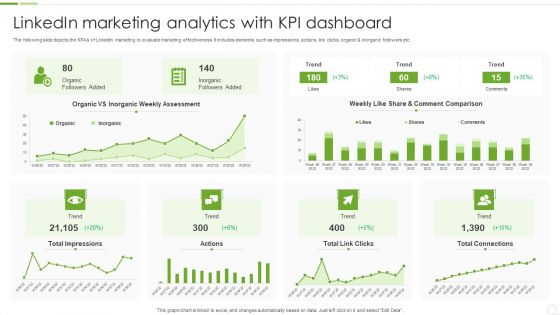
Linkedin Marketing Analytics With KPI Dashboard Ppt PowerPoint Presentation File Inspiration PDF
The following slide depicts the KPAs of LinkedIn marketing to evaluate marketing effectiveness. It includes elements such as impressions, actions, link clicks, organic and inorganic followers etc. Showcasing this set of slides titled Linkedin Marketing Analytics With KPI Dashboard Ppt PowerPoint Presentation File Inspiration PDF. The topics addressed in these templates are Total Impressions, Total Connections, Inorganic Followers Added. All the content presented in this PPT design is completely editable. Download it and make adjustments in color, background, font etc. as per your unique business setting.
Saas Cloud Security Analysis With KPI Dashboard Ppt PowerPoint Presentation Icon Slides PDF
The following slide highlights the assessment of Software as a security to meet safety standards. It includes key elements such as critical incidents, risk analysis, number of open tasks etc. Pitch your topic with ease and precision using this Saas Cloud Security Analysis With KPI Dashboard Ppt PowerPoint Presentation Icon Slides PDF. This layout presents information on Quarterly Incident Severity, Incident Risk Analysis, Critical Incidents. It is also available for immediate download and adjustment. So, changes can be made in the color, design, graphics or any other component to create a unique layout.

Firm KPI Dashboard With Average Click Through Rate Ppt Inspiration Sample PDF
This graph or chart is linked to excel, and changes automatically based on data. Just left click on it and select Edit Data. Pitch your topic with ease and precision using this Firm KPI Dashboard With Average Click Through Rate Ppt Inspiration Sample PDF. This layout presents information on Total Clicks, Total Impressive, Average CTR, Average Position. It is also available for immediate download and adjustment. So, changes can be made in the color, design, graphics or any other component to create a unique layout.

KPI Dashboard Of Workforce Performance In Organization Ppt Gallery Portfolio PDF
This slide shows the performance of employees in an organization. It includes KPIs such as headcount, average employee age, gender diversity ratio, absenteeism, etc. Showcasing this set of slides titled KPI Dashboard Of Workforce Performance In Organization Ppt Gallery Portfolio PDF. The topics addressed in these templates are Employee Count Status, Employee Count Department, Average Employee Age. All the content presented in this PPT design is completely editable. Download it and make adjustments in color, background, font etc. as per your unique business setting.
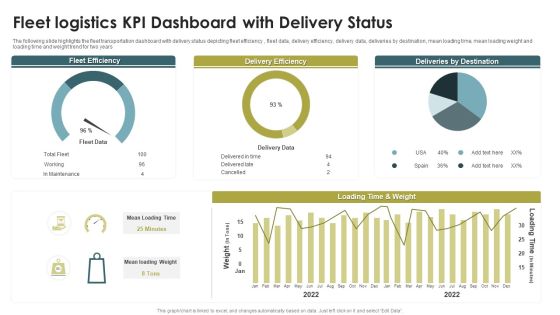
Fleet Logistics KPI Dashboard With Delivery Status Ppt Model Guide PDF
The following slide highlights the fleet transportation dashboard with delivery status depicting fleet efficiency , fleet data, delivery efficiency, delivery data, deliveries by destination, mean loading time, mean loading weight and loading time and weight trend for two years. Pitch your topic with ease and precision using this Fleet Logistics KPI Dashboard With Delivery Status Ppt Model Guide PDF. This layout presents information on Fleet Efficiency, Delivery Efficiency, Deliveries By Destination. It is also available for immediate download and adjustment. So, changes can be made in the color, design, graphics or any other component to create a unique layout.
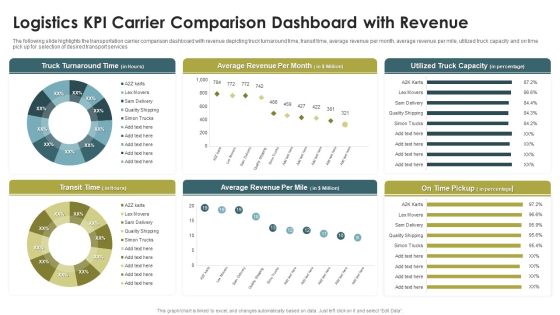
Logistics KPI Carrier Comparison Dashboard With Revenue Ppt Infographics Portfolio PDF
The following slide highlights the transportation carrier comparison dashboard with revenue depicting truck turnaround time, transit time, average revenue per month, average revenue per mile, utilized truck capacity and on time pick up for selection of desired transport services. Pitch your topic with ease and precision using this Logistics KPI Carrier Comparison Dashboard With Revenue Ppt Infographics Portfolio PDF. This layout presents information on Truck Turnaround Time, Average Revenue, Per Month, Transit Time. It is also available for immediate download and adjustment. So, changes can be made in the color, design, graphics or any other component to create a unique layout.
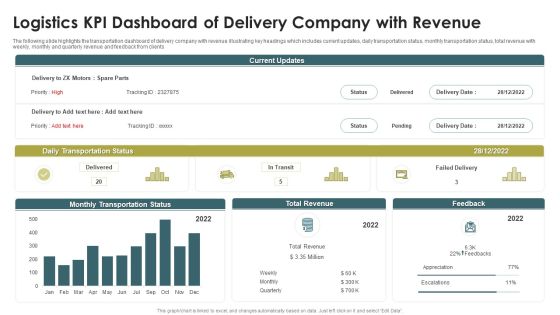
Logistics KPI Dashboard Of Delivery Company With Revenue Ppt Show PDF
The following slide highlights the transportation dashboard of delivery company with revenue illustrating key headings which includes current updates, daily transportation status, monthly transportation status, total revenue with weekly, monthly and quarterly revenue and feedback from clients. Showcasing this set of slides titled Logistics KPI Dashboard Of Delivery Company With Revenue Ppt Show PDF. The topics addressed in these templates are Daily Transportation Status, Monthly Transportation Status, Total Revenue. All the content presented in this PPT design is completely editable. Download it and make adjustments in color, background, font etc. as per your unique business setting.

Dashboard For International Logistics KPI Via Third Party Carriers Rules PDF
The following slide highlights the dashboard for international transportation via third party carriers illustrating total shipment, payment method, revenue, shipment status and shipment details such as company, tracking id, Item, weight, address, payment, status to monitor the transportation. Showcasing this set of slides titled Dashboard For International Logistics KPI Via Third Party Carriers Rules PDF. The topics addressed in these templates are Total Shipment, Payment Method, Revenue, 20. All the content presented in this PPT design is completely editable. Download it and make adjustments in color, background, font etc. as per your unique business setting.
Market Insights Research Results With KPI Dashboard Ppt PowerPoint Presentation Icon File Formats PDF
The given below slide highlights the KPAs of market research associated with customer satisfaction. It includes net promoter score, customer effort score, monthly NPS and CES trend etc.Pitch your topic with ease and precision using this Market Insights Research Results With KPI Dashboard Ppt PowerPoint Presentation Icon File Formats PDF. This layout presents information on Satisfaction Score, Customer Effort, Customer Score. It is also available for immediate download and adjustment. So, changes can be made in the color, design, graphics or any other component to create a unique layout.
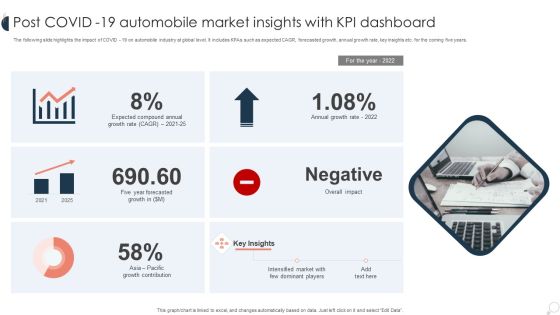
Post COVID 19 Automobile Market Insights With KPI Dashboard Ppt PowerPoint Presentation Slides Background Images PDF
The following slide highlights the impact of COVID 19 on automobile industry at global level. It includes KPAs such as expected CAGR, forecasted growth, annual growth rate, key insights etc. for the coming five years. Showcasing this set of slides titled Post COVID 19 Automobile Market Insights With KPI Dashboard Ppt PowerPoint Presentation Slides Background Images PDF. The topics addressed in these templates are Expected Compound, Annual Growth, Overall Impact. All the content presented in this PPT design is completely editable. Download it and make adjustments in color, background, font etc. as per your unique business setting.
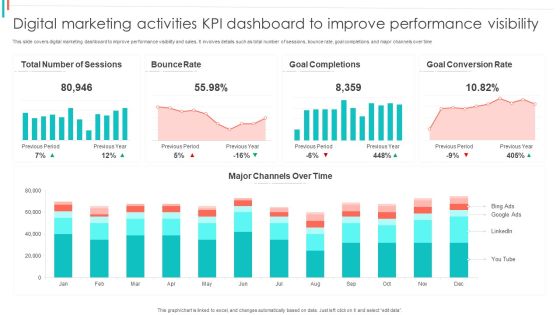
Digital Marketing Activities KPI Dashboard To Improve Performance Visibility Summary PDF
This slide covers digital marketing dashboard to improve performance visibility and sales. It involves details such as total number of sessions, bounce rate, goal completions and major channels over time.Showcasing this set of slides titled Digital Marketing Activities KPI Dashboard To Improve Performance Visibility Summary PDF. The topics addressed in these templates are Bounce Rate, Goal Completions, Goal Conversion. All the content presented in this PPT design is completely editable. Download it and make adjustments in color, background, font etc. as per your unique business setting.

Service Level Agreement KPI Dashboard Indicating Violation Count And Overdue Requests Diagrams PDF
This graph or chart is linked to excel, and changes automatically based on data. Just left click on it and select Edit Data. Showcasing this set of slides titled Service Level Agreement KPI Dashboard Indicating Violation Count And Overdue Requests Diagrams PDF. The topics addressed in these templates are Total Requests Category, Total Requests Status, Urgent Requests. All the content presented in this PPT design is completely editable. Download it and make adjustments in color, background, font etc. as per your unique business setting.

Service Level Agreement KPI Dashboard With Current Risk Statistics Topics PDF
This graph or chart is linked to excel, and changes automatically based on data. Just left click on it and select Edit Data. Pitch your topic with ease and precision using this Service Level Agreement KPI Dashboard With Current Risk Statistics Topics PDF. This layout presents information on Current Risk SLAS, Current Breached Slas, Personal Active SLA It is also available for immediate download and adjustment. So, changes can be made in the color, design, graphics or any other component to create a unique layout.
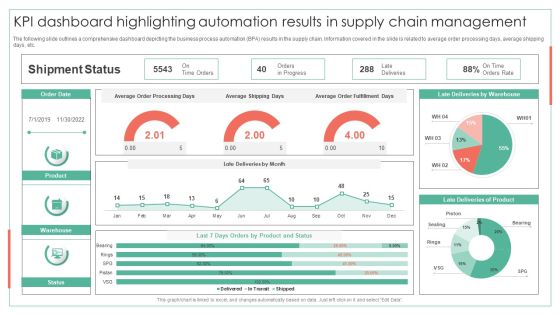
KPI Dashboard Highlighting Automation Results In Supply Achieving Operational Efficiency Graphics PDF
The following slide outlines a comprehensive dashboard depicting the business process automation BPA results in the supply chain. Information covered in the slide is related to average order processing days, average shipping days, etc.Deliver and pitch your topic in the best possible manner with this KPI Dashboard Highlighting Automation Results In Supply Achieving Operational Efficiency Graphics PDF. Use them to share invaluable insights on Orders Progress, Late Deliveries, Deliveries Warehouse and impress your audience. This template can be altered and modified as per your expectations. So, grab it now.

Business Performance Monitoring Kpi Dashboard Guide For Successful Merger And Acquisition Mockup PDF
Coming up with a presentation necessitates that the majority of the effort goes into the content and the message you intend to convey. The visuals of a PowerPoint presentation can only be effective if it supplements and supports the story that is being told. Keeping this in mind our experts created Business Performance Monitoring Kpi Dashboard Guide For Successful Merger And Acquisition Mockup PDF to reduce the time that goes into designing the presentation. This way, you can concentrate on the message while our designers take care of providing you with the right template for the situation.

Kpi Dashboard To Measure Talent Performance Employee Performance Management Tactics Professional PDF
This slide represents dashboard to measure talent performance in organization. It includes talent applicant status, team training methods, talented candidate status, risk for loss of potential talent pool etc.The Kpi Dashboard To Measure Talent Performance Employee Performance Management Tactics Professional PDF is a compilation of the most recent design trends as a series of slides. It is suitable for any subject or industry presentation, containing attractive visuals and photo spots for businesses to clearly express their messages. This template contains a variety of slides for the user to input data, such as structures to contrast two elements, bullet points, and slides for written information. Slidegeeks is prepared to create an impression.

Financial Kpi Dashboard To Evaluate Fundraising Impact Developing Fundraising Techniques Diagrams PDF
This slide showcases dashboard that can help organization to evaluate key changes in financial KPIs post fundraising. Its key components are net profit margin, revenue, gross profit margin, debt to equity and return on equity. From laying roadmaps to briefing everything in detail, our templates are perfect for you. You can set the stage with your presentation slides. All you have to do is download these easy-to-edit and customizable templates. Financial Kpi Dashboard To Evaluate Fundraising Impact Developing Fundraising Techniques Diagrams PDF will help you deliver an outstanding performance that everyone would remember and praise you for. Do download this presentation today.
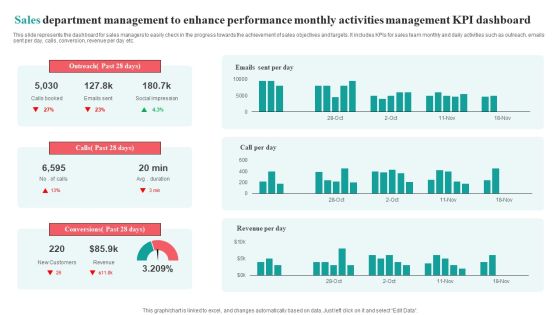
Sales Department Management To Enhance Performance Monthly Activities Management KPI Dashboard Brochure PDF
This slide represents the dashboard for sales managers to easily check in the progress towards the achievement of sales objectives and targets. It includes KPIs for sales team monthly and daily activities such as outreach, emails sent per day, calls, conversion, revenue per day etc.Pitch your topic with ease and precision using this Sales Department Management To Enhance Performance Monthly Activities Management KPI Dashboard Brochure PDF. This layout presents information on Social Impression, Conversions Past, Outreach Past. It is also available for immediate download and adjustment. So, changes can be made in the color, design, graphics or any other component to create a unique layout.
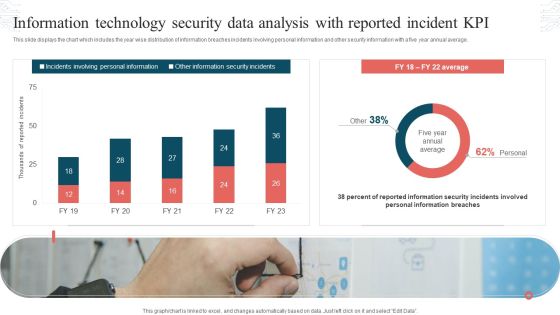
Information Technology Security Data Analysis With Reported Incident KPI Download PDF
This slide displays the chart which includes the year wise distribution of information breaches incidents involving personal information and other security information with a five year annual average. Showcasing this set of slides titled Information Technology Security Data Analysis With Reported Incident KPI Download PDF. The topics addressed in these templates are Incidents Involving, Personal Information, Other Information, Security Incidents. All the content presented in this PPT design is completely editable. Download it and make adjustments in color, background, font etc. as per your unique business setting.
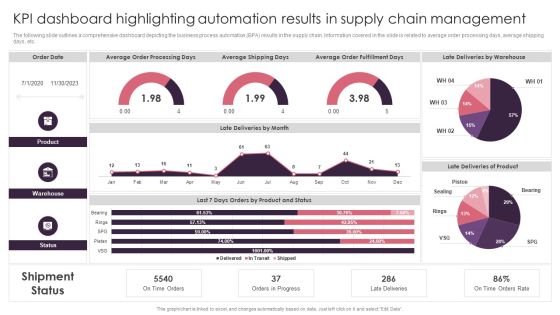
KPI Dashboard Highlighting Automation Results In Supply Chain Management Brochure PDF
The following slide outlines a comprehensive dashboard depicting the business process automation BPA results in the supply chain. Information covered in the slide is related to average order processing days, average shipping days, etc. From laying roadmaps to briefing everything in detail, our templates are perfect for you. You can set the stage with your presentation slides. All you have to do is download these easy to edit and customizable templates. KPI Dashboard Highlighting Automation Results In Supply Chain Management Brochure PDF will help you deliver an outstanding performance that everyone would remember and praise you for. Do download this presentation today.

Customer Relationship Management Software KPI Dashboard Application Deployment Project Plan Infographics PDF
This slide represents the dashboard showing details related to customer relationship management software. It includes details related to outbound sales, contracts closed, average contract value etc. From laying roadmaps to briefing everything in detail, our templates are perfect for you. You can set the stage with your presentation slides. All you have to do is download these easy to edit and customizable templates. Customer Relationship Management Software KPI Dashboard Application Deployment Project Plan Infographics PDF will help you deliver an outstanding performance that everyone would remember and praise you for. Do download this presentation today.

System Deployment Project Customer Relationship Management Software Kpi Dashboard Rules PDF
This slide represents the dashboard showing details related to customer relationship management software. It includes details related to outbound sales, contracts closed, average contract value etc. Present like a pro with System Deployment Project Customer Relationship Management Software Kpi Dashboard Rules PDF Create beautiful presentations together with your team, using our easy-to-use presentation slides. Share your ideas in real-time and make changes on the fly by downloading our templates. So whether youre in the office, on the go, or in a remote location, you can stay in sync with your team and present your ideas with confidence. With Slidegeeks presentation got a whole lot easier. Grab these presentations today.

Employee Performance Management To Enhance Organizational Growth KPI Dashboard To Track Employee Topics PDF
The Employee Performance Management To Enhance Organizational Growth KPI Dashboard To Track Employee Topics PDF is a compilation of the most recent design trends as a series of slides. It is suitable for any subject or industry presentation, containing attractive visuals and photo spots for businesses to clearly express their messages. This template contains a variety of slides for the user to input data, such as structures to contrast two elements, bullet points, and slides for written information. Slidegeeks is prepared to create an impression.

Optimizing Marketing Analytics To Enhance Organizational Growth Social Media Analytics KPI Dashboard Graphics PDF
This slide covers a dashboard for tracking social media KPIs such as face engagements, total likes, followers, audience growth, YouTube subscribers, views, Instagram reach and , likes, LinkedIn impressions, etc. From laying roadmaps to briefing everything in detail, our templates are perfect for you. You can set the stage with your presentation slides. All you have to do is download these easy to edit and customizable templates. Optimizing Marketing Analytics To Enhance Organizational Growth Social Media Analytics KPI Dashboard Graphics PDF will help you deliver an outstanding performance that everyone would remember and praise you for. Do download this presentation today.
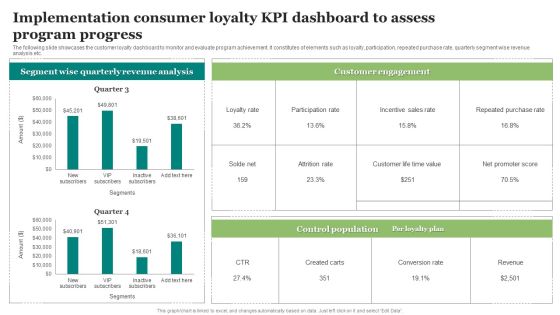
Implementation Consumer Loyalty KPI Dashboard To Assess Program Progress Guidelines PDF
The following slide illustrates the impact of executing artificial technology and machine learning in customer loyalty program. It includes elements such as predictive insights, prescriptive analytics, fraud prevention, intelligent interference etc. Showcasing this set of slides titled Implementation Consumer Loyalty KPI Dashboard To Assess Program Progress Guidelines PDF. The topics addressed in these templates are Implementation Consumer, Assess Program. All the content presented in this PPT design is completely editable. Download it and make adjustments in color, background, font etc. as per your unique business setting.

Customer Service Organizational Efficiency Gain Assessment With KPI Dashboard Slides PDF
The following slide highlights the key insights of customer service management to optimize issue response process. It includes elements such as average talk time, queue time, answer time, abandoned on hold, voice mails etc. Showcasing this set of slides titled Customer Service Organizational Efficiency Gain Assessment With KPI Dashboard Slides PDF. The topics addressed in these templates are Activity, Unsuccessful Inbound Calls, Efficiency. All the content presented in this PPT design is completely editable. Download it and make adjustments in color, background, font etc. as per your unique business setting.

Strategic Plan For Enterprise Customer Relationship Management Software KPI Dashboard Infographics PDF
This slide represents the dashboard showing details related to customer relationship management software. It includes details related to outbound sales, contracts closed, average contract value etc. Present like a pro with Strategic Plan For Enterprise Customer Relationship Management Software KPI Dashboard Infographics PDF Create beautiful presentations together with your team, using our easy-to-use presentation slides. Share your ideas in real-time and make changes on the fly by downloading our templates. So whether youre in the office, on the go, or in a remote location, you can stay in sync with your team and present your ideas with confidence. With Slidegeeks presentation got a whole lot easier. Grab these presentations today.

Revolutionizing Customer Support Through Digital Transformation KPI Dashboard To Measure Customer Elements PDF
This slide represents dashboard to measure customer service performance. It includes number of issues, average time to close, average response time etc. Take your projects to the next level with our ultimate collection of Revolutionizing Customer Support Through Digital Transformation KPI Dashboard To Measure Customer Elements PDF. Slidegeeks has designed a range of layouts that are perfect for representing task or activity duration, keeping track of all your deadlines at a glance. Tailor these designs to your exact needs and give them a truly corporate look with your own brand colors they will make your projects stand out from the rest.
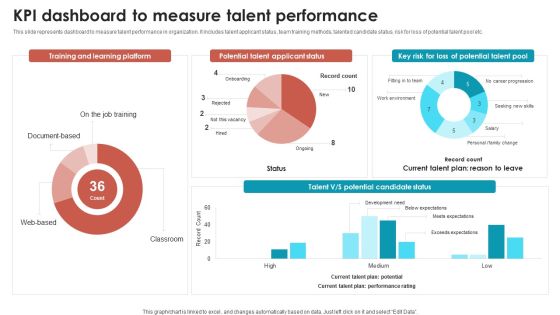
Talent Management Optimization With Workforce Staffing Kpi Dashboard To Measure Talent Performance Sample PDF
This slide represents dashboard to measure talent performance in organization. It includes talent applicant status, team training methods, talented candidate status, risk for loss of potential talent pool etc. If your project calls for a presentation, then Slidegeeks is your go to partner because we have professionally designed, easy to edit templates that are perfect for any presentation. After downloading, you can easily edit Talent Management Optimization With Workforce Staffing Kpi Dashboard To Measure Talent Performance Sample PDF and make the changes accordingly. You can rearrange slides or fill them with different images. Check out all the handy templates.

Marketers Guide To Data Analysis Optimization Social Media Analytics KPI Dashboard Clipart PDF
This slide covers a dashboard for tracking social media KPIs such as face engagements, total likes, followers, audience growth, YouTube subscribers, views, Instagram reach and , likes, LinkedIn impressions, etc. Find a pre designed and impeccable Marketers Guide To Data Analysis Optimization Social Media Analytics KPI Dashboard Clipart PDF. The templates can ace your presentation without additional effort. You can download these easy to edit presentation templates to make your presentation stand out from others. So, what are you waiting for Download the template from Slidegeeks today and give a unique touch to your presentation.

Amazon Tactical Plan KPI Dashboard To Track Amazon Performance Clipart PDF
This slide provides information regarding dashboard to monitor Amazon performance. The KPIs include tracking of product sales, conversion rate, advertising spends, session, organic sales, etc. The Amazon Tactical Plan KPI Dashboard To Track Amazon Performance Clipart PDF is a compilation of the most recent design trends as a series of slides. It is suitable for any subject or industry presentation, containing attractive visuals and photo spots for businesses to clearly express their messages. This template contains a variety of slides for the user to input data, such as structures to contrast two elements, bullet points, and slides for written information. Slidegeeks is prepared to create an impression.

KPI Dashboard To Track Progress Of Law Firm Development Strategic Plan Infographics PDF
Following slide demonstrates dashboard for tracking law firm development plan progress to determine key practice areas. It includes elements such as number of won ,lost and decline cases, opportunity sources, proposal type and proportion of practice areas. Showcasing this set of slides titled KPI Dashboard To Track Progress Of Law Firm Development Strategic Plan Infographics PDF. The topics addressed in these templates are Opportunities, Cases, Practice Areas. All the content presented in this PPT design is completely editable. Download it and make adjustments in color, background, font etc. as per your unique business setting.

Review Yearly Employee Engagement Score With Kpi Dashboard Ppt Pictures Design Ideas PDF
The following slide showcases annual employee engagement scores to measure employee activeness. It includes elements such as response rate, net promotor score, monthly engagement rate, number of responses, teams, accuracy etc. From laying roadmaps to briefing everything in detail, our templates are perfect for you. You can set the stage with your presentation slides. All you have to do is download these easy to edit and customizable templates. Review Yearly Employee Engagement Score With Kpi Dashboard Ppt Pictures Design Ideas PDF will help you deliver an outstanding performance that everyone would remember and praise you for. Do download this presentation today.

Kpi Dashboard Highlighting Automation Results In Supplyoptimizing Business Processes Through Automation Download PDF
The following slide outlines a comprehensive dashboard depicting the business process automation BPA results in the supply chain. Information covered in the slide is related to average order processing days, average shipping days, etc. There are so many reasons you need a Kpi Dashboard Highlighting Automation Results In Supplyoptimizing Business Processes Through Automation Download PDF. The first reason is you cannot spend time making everything from scratch, Thus, Slidegeeks has made presentation templates for you too. You can easily download these templates from our website easily.

KPI Dashboard To Track First Time Leads Ppt PowerPoint Presentation File Pictures PDF
The following slide showcases dashboard which can help businesses assess information about newly generated leads. It provides information about leads, permissions gained by source, revenue, sales closed, MailChimp, email, ads, etc. Take your projects to the next level with our ultimate collection of KPI Dashboard To Track First Time Leads Ppt PowerPoint Presentation File Pictures PDF. Slidegeeks has designed a range of layouts that are perfect for representing task or activity duration, keeping track of all your deadlines at a glance. Tailor these designs to your exact needs and give them a truly corporate look with your own brand colors they will make your projects stand out from the rest.

Business Vendor Performance Dashboard KPI With Top Supplier For Manufacturing Business Information PDF
Following slide contains executive dashboard which provide managers to track and monitor trends over a period of time. This include elements such as revenue, top products, top supplier, top customer, revenue trends annually, etc. Showcasing this set of slides titled Business Vendor Performance Dashboard KPI With Top Supplier For Manufacturing Business Information PDF. The topics addressed in these templates are Customers, Product, Sales. All the content presented in this PPT design is completely editable. Download it and make adjustments in color, background, font etc. as per your unique business setting.

Enhancing Digital Visibility Using SEO Content Strategy KPI Dashboard To Evaluate Content Performance Diagrams PDF
This slide shows key performance indicators dashboard which can be used by content marketing managers to measure content performance. It includes metrics such as page views, social shares, content first touch, pipeline generated, etc. This modern and well arranged Enhancing Digital Visibility Using SEO Content Strategy KPI Dashboard To Evaluate Content Performance Diagrams PDF provides lots of creative possibilities. It is very simple to customize and edit with the Powerpoint Software. Just drag and drop your pictures into the shapes. All facets of this template can be edited with Powerpoint no extra software is necessary. Add your own material, put your images in the places assigned for them, adjust the colors, and then you can show your slides to the world, with an animated slide included.

Adopting IMC Technique To Boost Brand Recognition Kpi Dashboard To Review Campaign Performance Pictures PDF
The following slide depicts key performance indicators to evaluate effectiveness of campaign performance. It includes elements such as total revenue, marketing spend, leads, cost per acquisition, profits, return on investments etc. This modern and well arranged Adopting IMC Technique To Boost Brand Recognition Kpi Dashboard To Review Campaign Performance Pictures PDF provides lots of creative possibilities. It is very simple to customize and edit with the Powerpoint Software. Just drag and drop your pictures into the shapes. All facets of this template can be edited with Powerpoint no extra software is necessary. Add your own material, put your images in the places assigned for them, adjust the colors, and then you can show your slides to the world, with an animated slide included.

Construction Site Safety Measure KPI Dashboard To Track Safety Program Performance Slides PDF
This slide reflects the key performance indicator dashboard to track the performance of safety program. It includes information regarding the total manpower, manhours, unsafe conditions, lost time injuries frequency, injuries severity rate, along with the training hours.Slidegeeks has constructed Construction Site Safety Measure KPI Dashboard To Track Safety Program Performance Slides PDF after conducting extensive research and examination. These presentation templates are constantly being generated and modified based on user preferences and critiques from editors. Here, you will find the most attractive templates for a range of purposes while taking into account ratings and remarks from users regarding the content. This is an excellent jumping-off point to explore our content and will give new users an insight into our top-notch PowerPoint Templates.

Kpi Dashboard To Track Safety Program Performance Construction Site Safety Plan Summary PDF
This slide reflects the key performance indicator dashboard to track the performance of safety program. It includes information regarding the total manpower, manhours, unsafe conditions, lost time injuries frequency, injuries severity rate, along with the training hours. The Kpi Dashboard To Track Safety Program Performance Construction Site Safety Plan Summary PDF is a compilation of the most recent design trends as a series of slides. It is suitable for any subject or industry presentation, containing attractive visuals and photo spots for businesses to clearly express their messages. This template contains a variety of slides for the user to input data, such as structures to contrast two elements, bullet points, and slides for written information. Slidegeeks is prepared to create an impression.
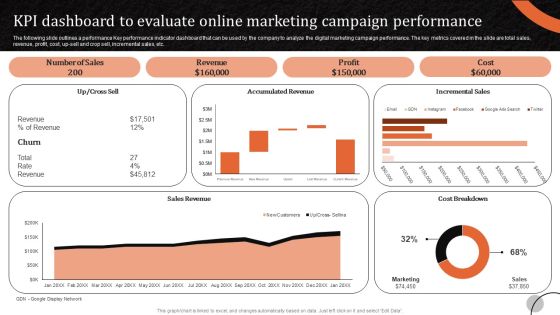
Marketing Tactics To Increase KPI Dashboard To Evaluate Online Marketing Campaign Infographics PDF
The following slide outlines a performance Key performance indicator dashboard that can be used by the company to analyze the digital marketing campaign performance. The key metrics covered in the slide are total sales, revenue, profit, cost, up-sell and crop sell, incremental sales, etc. Want to ace your presentation in front of a live audience Our Marketing Tactics To Increase KPI Dashboard To Evaluate Online Marketing Campaign Infographics PDF can help you do that by engaging all the users towards you. Slidegeeks experts have put their efforts and expertise into creating these impeccable powerpoint presentations so that you can communicate your ideas clearly. Moreover, all the templates are customizable, and easy-to-edit and downloadable. Use these for both personal and commercial use.

Assessing Impact Of Sales Risk Management With Kpi Dashboard Diagrams PDF
The following slide highlights some key performance indicators KPIs to measure the influence of executing sales risk management strategies on revenue performance. It includes elements such as target attainment rate, gross profit, annual growth rate etc. Boost your pitch with our creative Assessing Impact Of Sales Risk Management With Kpi Dashboard Diagrams PDF. Deliver an awe inspiring pitch that will mesmerize everyone. Using these presentation templates you will surely catch everyones attention. You can browse the ppts collection on our website. We have researchers who are experts at creating the right content for the templates. So you do not have to invest time in any additional work. Just grab the template now and use them.
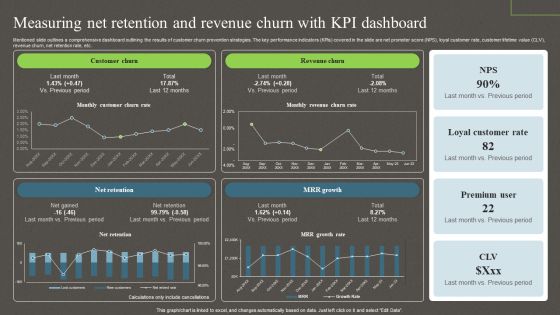
Measuring Net Retention And Revenue Churn With Kpi Dashboard Ppt PowerPoint Presentation File Backgrounds PDF
Mentioned slide outlines a comprehensive dashboard outlining the results of customer churn prevention strategies. The key performance indicators KPIs covered in the slide are net promoter score NPS, loyal customer rate, customer lifetime value CLV, revenue churn, net retention rate, etc. Boost your pitch with our creative Measuring Net Retention And Revenue Churn With Kpi Dashboard Ppt PowerPoint Presentation File Backgrounds PDF. Deliver an awe inspiring pitch that will mesmerize everyone. Using these presentation templates you will surely catch everyones attention. You can browse the ppts collection on our website. We have researchers who are experts at creating the right content for the templates. So you do not have to invest time in any additional work. Just grab the template now and use them.
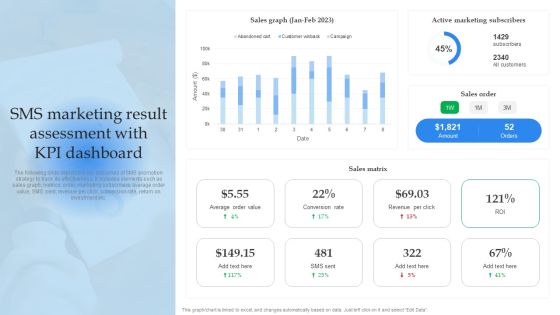
Mobile Promotion Strategic Guide For Micro Businesses Sms Marketing Result Assessment With Kpi Dashboard Slides PDF
The following slide depicts the key outcomes of SMS promotion strategy to track its effectiveness. It includes elements such as sales graph, metrics, order, marketing subscribers, average order value, SMS sent, revenue per click, conversion rate, return on investment etc. Slidegeeks is here to make your presentations a breeze with Mobile Promotion Strategic Guide For Micro Businesses Sms Marketing Result Assessment With Kpi Dashboard Slides PDF With our easy to use and customizable templates, you can focus on delivering your ideas rather than worrying about formatting. With a variety of designs to choose from, you are sure to find one that suits your needs. And with animations and unique photos, illustrations, and fonts, you can make your presentation pop. So whether you are giving a sales pitch or presenting to the board, make sure to check out Slidegeeks first.

Boosting Yearly Business Revenue KPI Dashboard To Track Sales Plan Performance Topics PDF
This slide shows dashboard which can be used by organizations to measure the results of sales plan. It includes metrics such as sales per product, actual vs target sales, sales by region, sales by channel, etc. Boost your pitch with our creative Boosting Yearly Business Revenue KPI Dashboard To Track Sales Plan Performance Topics PDF. Deliver an awe-inspiring pitch that will mesmerize everyone. Using these presentation templates you will surely catch everyones attention. You can browse the ppts collection on our website. We have researchers who are experts at creating the right content for the templates. So you dont have to invest time in any additional work. Just grab the template now and use them.

Comprehensive Guide To Build Marketing Traditional Marketing KPI Dashboard With Total Designs PDF
The following slide showcases the impact of offline marketing strategies on store performance. The key performance indicators KPIs mentioned in slide are sales, customers, average transaction price, average units per customer, top collections, sales by different segments, etc. Retrieve professionally designed Comprehensive Guide To Build Marketing Traditional Marketing KPI Dashboard With Total Designs PDF to effectively convey your message and captivate your listeners. Save time by selecting pre-made slideshows that are appropriate for various topics, from business to educational purposes. These themes come in many different styles, from creative to corporate, and all of them are easily adjustable and can be edited quickly. Access them as PowerPoint templates or as Google Slides themes. You do not have to go on a hunt for the perfect presentation because Slidegeeks got you covered from everywhere.

Assessing Impact Of Sales Risk Management With KPI Dashboard Ppt Professional Graphics Pictures PDF
The following slide highlights some key performance indicators KPIs to measure the influence of executing sales risk management strategies on revenue performance. It includes elements such as target attainment rate, gross profit, annual growth rate etc. Are you in need of a template that can accommodate all of your creative concepts This one is crafted professionally and can be altered to fit any style. Use it with Google Slides or PowerPoint. Include striking photographs, symbols, depictions, and other visuals. Fill, move around, or remove text boxes as desired. Test out color palettes and font mixtures. Edit and save your work, or work with colleagues. Download Assessing Impact Of Sales Risk Management With KPI Dashboard Ppt Professional Graphics Pictures PDF and observe how to make your presentation outstanding. Give an impeccable presentation to your group and make your presentation unforgettable.

Measuring Net Retention And Revenue Churn With Kpi Dashboard Ideas PDF
Mentioned slide outlines a comprehensive dashboard outlining the results of customer churn prevention strategies. The key performance indicators KPIs covered in the slide are net promoter score NPS, loyal customer rate, customer lifetime value CLV, revenue churn, net retention rate, etc. The Measuring Net Retention And Revenue Churn With Kpi Dashboard Ideas PDF is a compilation of the most recent design trends as a series of slides. It is suitable for any subject or industry presentation, containing attractive visuals and photo spots for businesses to clearly express their messages. This template contains a variety of slides for the user to input data, such as structures to contrast two elements, bullet points, and slides for written information. Slidegeeks is prepared to create an impression.

Website Traffic Analysis With KPI Dashboard Ppt Visual Aids Slides PDF
The following slide depicts the website analysis dashboard to get better visibility over search engines. It mainly includes key performance indicators such as sessions, users, page views, sources of traffic, phone call to actions etc. Retrieve professionally designed Website Traffic Analysis With KPI Dashboard Ppt Visual Aids Slides PDF to effectively convey your message and captivate your listeners. Save time by selecting pre made slideshows that are appropriate for various topics, from business to educational purposes. These themes come in many different styles, from creative to corporate, and all of them are easily adjustable and can be edited quickly. Access them as PowerPoint templates or as Google Slides themes. You do not have to go on a hunt for the perfect presentation because Slidegeeks got you covered from everywhere.

Guide To Healthcare Services Administration Performance KPI Dashboard To Analyze Healthcare Marketing Clipart PDF
The following slide showcases a comprehensive dashboard which can be used to evaluate the effectiveness of marketing strategies. The key metrics are total searches, brand mentions, customer value, total spending on advertisement etc. Slidegeeks is one of the best resources for PowerPoint templates. You can download easily and regulate Guide To Healthcare Services Administration Performance KPI Dashboard To Analyze Healthcare Marketing Clipart PDF for your personal presentations from our wonderful collection. A few clicks is all it takes to discover and get the most relevant and appropriate templates. Use our Templates to add a unique zing and appeal to your presentation and meetings. All the slides are easy to edit and you can use them even for advertisement purposes.

Creating New Product Launch Campaign Strategy Kpi Dashboard To Monitor Sales Performance Introduction PDF
This slide shows sales performance monitoring dashboard. Metrics included in the dashboard are sales revenue, sales growth, average revenue per unit, customer lifetime value and customer acquisition cost. This modern and well arranged Creating New Product Launch Campaign Strategy Kpi Dashboard To Monitor Sales Performance Introduction PDF provides lots of creative possibilities. It is very simple to customize and edit with the Powerpoint Software. Just drag and drop your pictures into the shapes. All facets of this template can be edited with Powerpoint no extra software is necessary. Add your own material, put your images in the places assigned for them, adjust the colors, and then you can show your slides to the world, with an animated slide included.
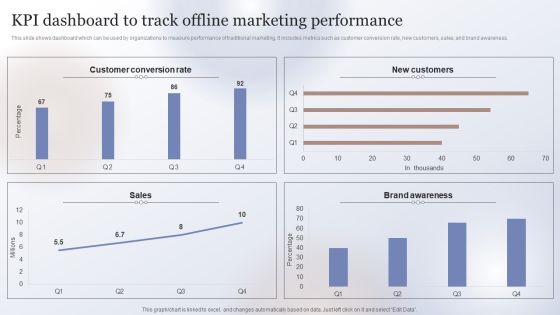
Marketing Strategy To Enhance KPI Dashboard To Track Offline Marketing Performance Ideas PDF
This slide shows dashboard which can be used by organizations to measure performance of traditional marketing. It includes metrics such as customer conversion rate, new customers, sales, and brand awareness. Welcome to our selection of the Marketing Strategy To Enhance KPI Dashboard To Track Offline Marketing Performance Ideas PDF. These are designed to help you showcase your creativity and bring your sphere to life. Planning and Innovation are essential for any business that is just starting out. This collection contains the designs that you need for your everyday presentations. All of our PowerPoints are 100 percent editable, so you can customize them to suit your needs. This multi-purpose template can be used in various situations. Grab these presentation templates today.
Ultimate Guide To Improve Customer Support And Services Kpi Dashboard For Tracking Customer Retention Guidelines PDF
This slide covers the dashboard for analyzing customer loyalty with metrics such as NPS, loyal customer rate, premium users, CLV, customer churn, revenue churn, net retention, MRR growth, etc. Welcome to our selection of the Ultimate Guide To Improve Customer Support And Services Kpi Dashboard For Tracking Customer Retention Guidelines PDF. These are designed to help you showcase your creativity and bring your sphere to life. Planning and Innovation are essential for any business that is just starting out. This collection contains the designs that you need for your everyday presentations. All of our PowerPoints are 100 percent editable, so you can customize them to suit your needs. This multi purpose template can be used in various situations. Grab these presentation templates today.
 Home
Home