AI PPT Maker
Templates
PPT Bundles
Design Services
Business PPTs
Business Plan
Management
Strategy
Introduction PPT
Roadmap
Self Introduction
Timelines
Process
Marketing
Agenda
Technology
Medical
Startup Business Plan
Cyber Security
Dashboards
SWOT
Proposals
Education
Pitch Deck
Digital Marketing
KPIs
Project Management
Product Management
Artificial Intelligence
Target Market
Communication
Supply Chain
Google Slides
Research Services
 One Pagers
All Categories
-
Home
- Customer Favorites
- Finance Icons
Finance Icons
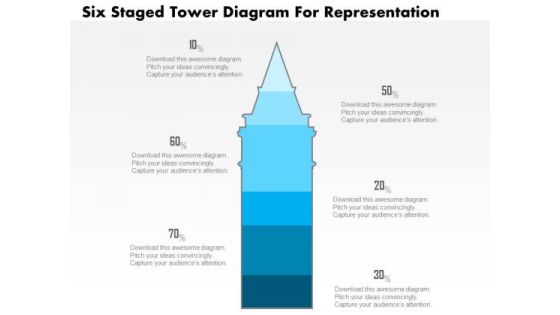
Business Diagram Five Staged Tower Diagram For Representation PowerPoint Slide
This business slide displays five staged tower diagram. It contains blue tower graphic divided into five parts. This diagram slide depicts processes, stages, steps, points, options information display. Use this diagram, in your presentations to express your views innovatively.
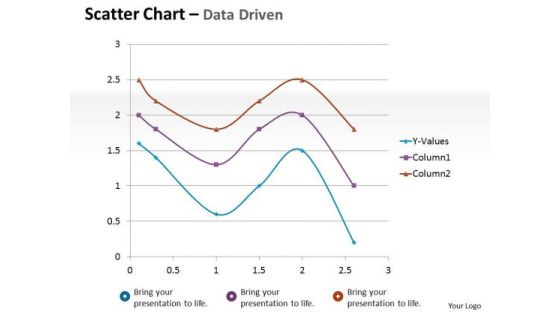
Financial Data Analysis Driven Scatter Chart Mathematical Diagram PowerPoint Slides Templates
Dominate Proceedings With Your Ideas. Our financial data analysis driven scatter chart mathematical diagram powerpoint slides Templates Will Empower Your Thoughts.

Competitive Analysis Scatter Chart Radar Chart Ppt PowerPoint Presentation Infographics
This is a competitive analysis scatter chart radar chart ppt powerpoint presentation infographics. This is a eight stage process. The stages in this process are users interface, data import, example, pricing, support, update, tutorials, easy to use.
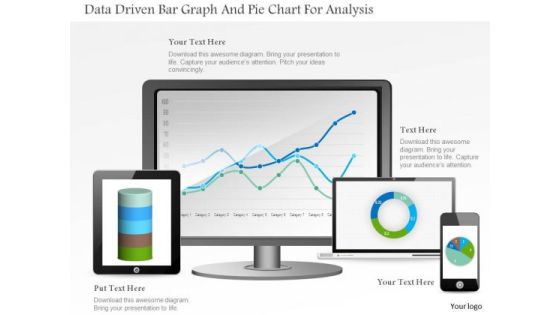
Business Diagram Data Driven Bar Graph And Pie Chart For Analysis PowerPoint Slide
This PowerPoint template displays technology gadgets with various business charts. Use this diagram slide, in your presentations to make business reports for statistical analysis. You may use this diagram to impart professional appearance to your presentations.
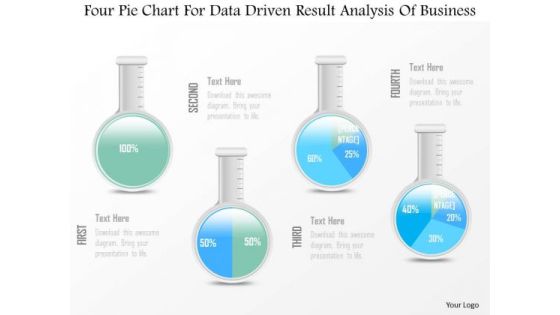
Business Diagram Four Pie Chart For Data Driven Result Analysis Of Business PowerPoint Slide
This business diagram displays graphic of pie charts in shape of flasks. This business slide is suitable to present and compare business data. Use this diagram to build professional presentations for your viewers.

Business Diagram Five Staged Timeline Diagram For Business PowerPoint Slide
This PowerPoint template displays five points timeline diagram. This business diagram has been designed with graphic of timeline with five points, text space and start, end points. Use this diagram, in your presentations to display process steps, stages, timelines and business management. Make wonderful presentations using this business slide.

Business Diagram Alarm Clock With Pie Chart For Result Analysis PowerPoint Slide
This business slide displays alarm clock with pie chart. This diagram is a data visualization tool that gives you a simple way to present statistical information. This slide helps your audience examine and interpret the data you present.
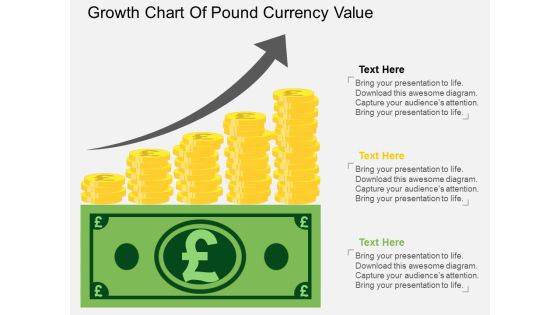
Growth Chart Of Pound Currency Value Powerpoint Template
The above PPT template displays growth chart of Pound currency. This diagram helps to exhibit Pound currency value growth. Adjust the above diagram in your business presentations to visually support your content.
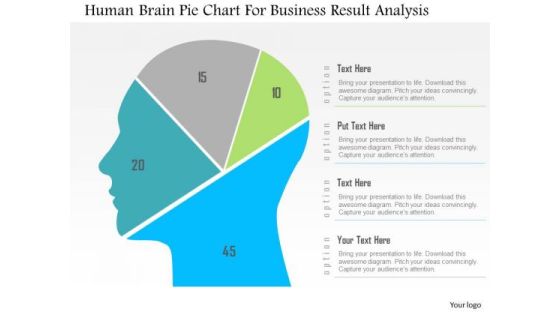
Business Diagram Human Brain Pie Chart For Business Result Analysis PowerPoint Slide
This diagram displays human face graphic divided into sections. This section can be used for data display. Use this diagram to build professional presentations for your viewers.

Business Diagram Data Driven Pie Chart Inside The Magnifier PowerPoint Slide
This business slide displays 3d colorful pie graph with magnifier. This diagram is a data visualization tool that gives you a simple way to present statistical information. This slide helps your audience examine and interpret the data you present.
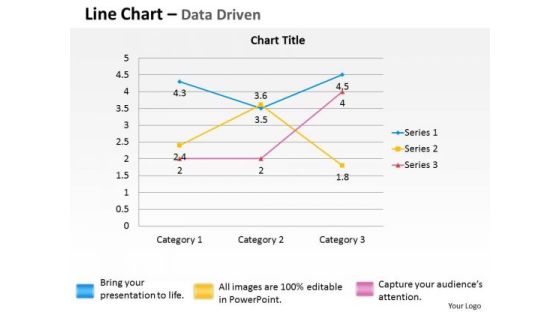
Quantitative Data Analysis Driven Economic Line Chart PowerPoint Slides Templates
Break The Deadlock With Our quantitative data analysis driven economic line chart powerpoint slides Templates . Let The Words Start To Flow.
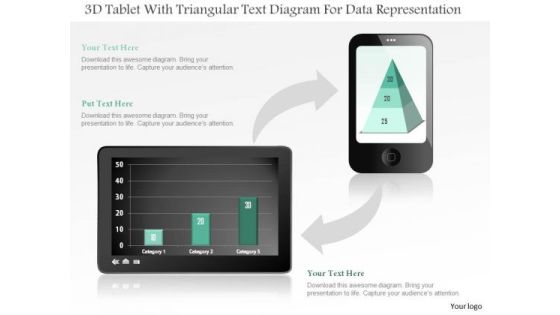
Business Diagram 3d Tablet With Triangular Text Diagram For Data Representation PowerPoint Slide
This business diagram displays bar graph on tablet and pyramid chart on mobile phone. Use this diagram, to make reports for interactive business presentations. Create professional presentations using this diagram.
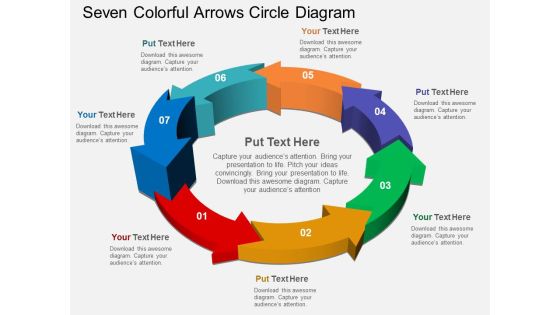
Seven Colorful Arrows Circle Diagram Powerpoint Templates
Our above PPT slide contains arrows infographic. It helps to display outline of business plan. Use this diagram to impart more clarity to data and to create more sound impact on viewers.

Combo Chart Ppt PowerPoint Presentation Slides Smartart
This is a combo chart ppt powerpoint presentation slides smartart. This is a four stage process. The stages in this process are business, strategy, analysis, planning, combo chart.

Bubble Chart Ppt PowerPoint Presentation Portfolio Files
This is a bubble chart ppt powerpoint presentation portfolio files. This is a five stage process. The stages in this process are profit, bubble chart, in percentage.

Stock Chart Ppt PowerPoint Presentation Slides Guidelines
This is a stock chart ppt powerpoint presentation slides guidelines. This is a five stage process. The stages in this process are stock chart, volume, low, close, open.
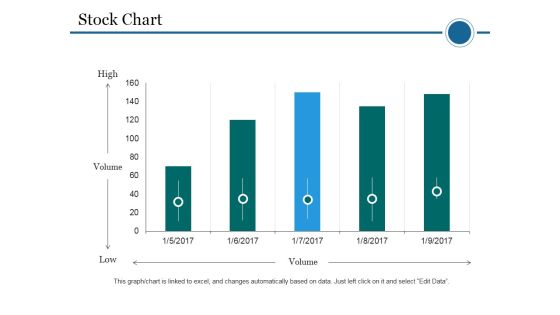
Stock Chart Ppt PowerPoint Presentation Professional Vector
This is a stock chart ppt powerpoint presentation professional vector. This is a five stage process. The stages in this process are stock chart, volume, high, low.

Area Chart Ppt PowerPoint Presentation Inspiration Images
This is a area chart ppt powerpoint presentation inspiration images. This is a two stage process. The stages in this process are area chart, product, sales in percentage.
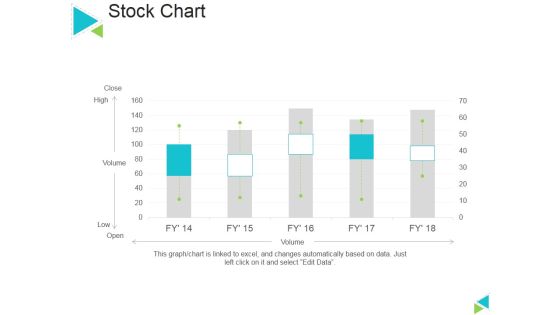
Stock Chart Ppt PowerPoint Presentation Ideas Slideshow
This is a stock chart ppt powerpoint presentation ideas slideshow. This is a five stage process. The stages in this process are stock chart, close, volume, open.
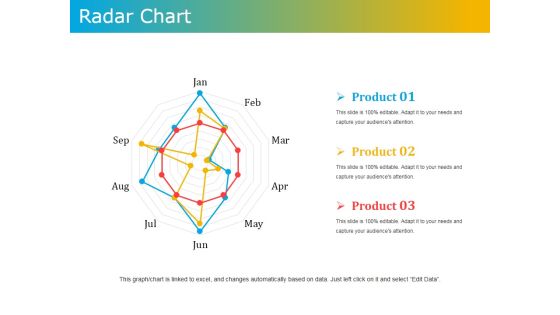
Radar Chart Ppt PowerPoint Presentation Outline Model
This is a radar chart ppt powerpoint presentation outline model. This is a three stage process. The stages in this process are radar chart, product, business, marketing, management.

Activity Planning Chart Ppt PowerPoint Presentation Backgrounds
This is a activity planning chart ppt powerpoint presentation backgrounds. This is a five stage process. The stages in this process are business, strategy, analysis, marketing, chart and graph, compare.

Combo Chart Ppt PowerPoint Presentation Inspiration Information
This is a combo chart ppt powerpoint presentation inspiration information. This is a eight stage process. The stages in this process are business, strategy, analysis, planning, combo chart, market size, growth rate.

Bar Chart Ppt PowerPoint Presentation Professional Files
This is a bar chart ppt powerpoint presentation professional files. This is a seven stage process. The stages in this process are bar chart, product, sales in percentage, financial years.

Area Chart Ppt PowerPoint Presentation Inspiration Rules
This is a area chart ppt powerpoint presentation inspiration rules. This is a two stage process. The stages in this process are area chart, business, marketing, sales in percentage, product.
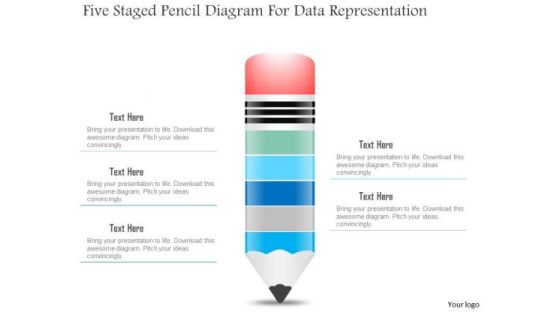
Business Diagram Five Staged Pencil Diagram For Data Representation PowerPoint Slide
This business slide displays five staged pencil diagram. It contains pencil graphic divided into five parts. This diagram slide depicts processes, stages, steps, points, options and education information display. Use this diagram, in your presentations to express your views innovatively.

Business Diagram Human Mind Diagram With Pie Graph For Representation PowerPoint Slide
This diagram displays human face graphic divided into sections. This section can be used for data display. Use this diagram to build professional presentations for your viewers.

Combo Chart Ppt PowerPoint Presentation Samples
This is a combo chart ppt powerpoint presentation samples. This is a four stage process. The stages in this process are business, marketing, strategy, success, growth.
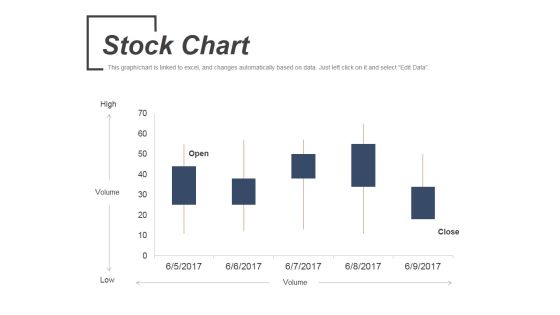
Stock Chart Ppt PowerPoint Presentation Ideas Topics
This is a stock chart ppt powerpoint presentation ideas topics. This is a five stage process. The stages in this process are volume, low, high, open, close.
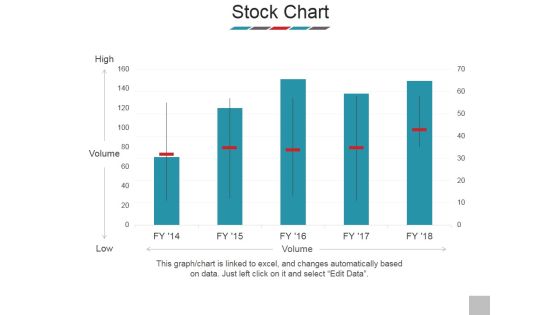
Stock Chart Ppt PowerPoint Presentation Show Templates
This is a stock chart ppt powerpoint presentation show templates. This is a five stage process. The stages in this process are high, volume, low, business, marketing.

Business Diagram Three Staged Pencil Diagram For Graph Formation PowerPoint Slide
This business diagram displays set of pencils. This Power Point template has been designed to compare and present business data. Download this diagram to represent stages of business growth.

Combo Chart Ppt PowerPoint Presentation Gallery Sample
This is a combo chart ppt powerpoint presentation gallery sample. This is a three stage process. The stages in this process are market size, product, growth rate, bar, graph.

Area Chart Ppt PowerPoint Presentation Slides Deck
This is a area chart ppt powerpoint presentation slides deck. This is a two stage process. The stages in this process are financial, sales in percentage, business, marketing, management.
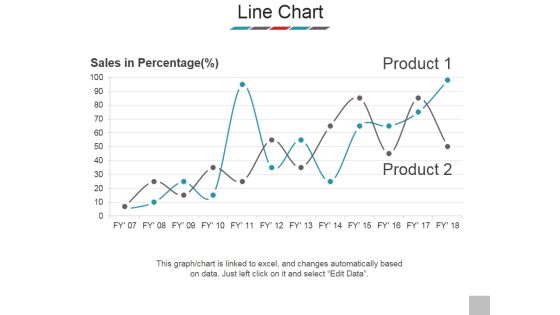
Line Chart Ppt PowerPoint Presentation Outline Samples
This is a line chart ppt powerpoint presentation outline samples. This is a two stage process. The stages in this process are sales in percentage, product, business, marketing, success.

Line Chart Ppt PowerPoint Presentation Layouts Information
This is a line chart ppt powerpoint presentation layouts information. This is a two stage process. The stages in this process are business, marketing, line chart, analysis, growth.

Area Chart Ppt PowerPoint Presentation Styles Designs
This is a area chart ppt powerpoint presentation styles designs. This is a two stage process. The stages in this process are area chart, product.

Pareto Chart Ppt PowerPoint Presentation Shapes
This is a pareto chart ppt powerpoint presentation shapes. This is a eight stage process. The stages in this process are business, strategy, marketing, success, growth strategy.

Column Chart Ppt PowerPoint Presentation Introduction
This is a column chart ppt powerpoint presentation introduction. This is a nine stage process. The stages in this process are business, marketing, management, growth, timeline.

Combo Chart Ppt PowerPoint Presentation Inspiration
This is a combo chart ppt powerpoint presentation inspiration. This is a eight stage process. The stages in this process are business, marketing, management, growth, timeline.

Combo Chart Ppt PowerPoint Presentation Files
This is a combo chart ppt powerpoint presentation files. This is a eight stage process. The stages in this process are business, marketing, growth, timeline, graph.

Scatter Bubble Chart Ppt PowerPoint Presentation Slides
This is a scatter bubble chart ppt powerpoint presentation slides. This is a eight stage process. The stages in this process are in price, highest sale, business, management.
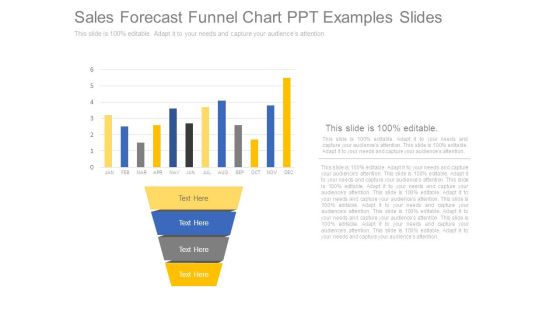
Sales Forecast Funnel Chart Ppt Examples Slides
This is a sales forecast funnel chart ppt examples slides. This is a four stage process. The stages in this process are jan, feb, mar, apr, may, jun, jul, aug, sep, oct, nov, dec.

Dollar Stacks Chart For Performance Attribution Powerpoint Slide Designs
This is a dollar stacks chart for performance attribution powerpoint slide designs. This is a four stage process. The stages in this process are step.
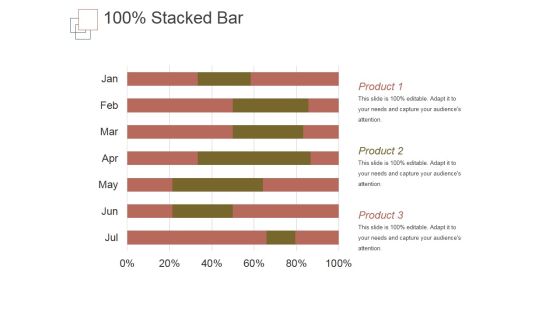
Stacked Bar Template 1 Ppt PowerPoint Presentation Themes
This is a stacked bar template 1 ppt powerpoint presentation themes. This is a six stage process. The stages in this process are product, business, marketing, success, management.

Crm Dashboard Sales Dashboard Ppt PowerPoint Presentation Themes
This is a crm dashboard sales dashboard ppt powerpoint presentation themes. This is a four stage process. The stages in this process are month over month closing trend, lead owner breakdown, total lead ownership, sales by product march 2017.

Stacked Line With Marker Ppt PowerPoint Presentation Ideas Themes
This is a stacked line with marker ppt powerpoint presentation ideas themes. This is a two stage process. The stages in this process are profit, stacked bar, product, business, marketing.
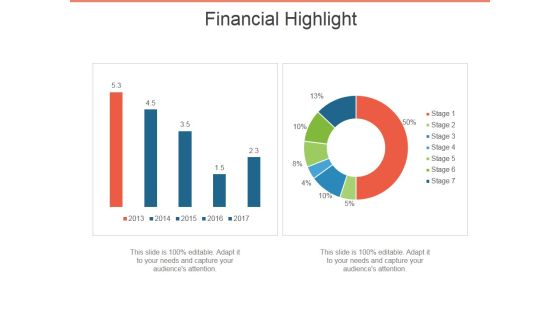
Financial Highlight Template 1 Ppt PowerPoint Presentation Ideas Themes
This is a financial highlight template 1 ppt powerpoint presentation ideas themes. This is a two stage process. The stages in this process are financial, highlight, business, bar graph, marketing.

Multivariate Data Analysis Numeric Values Surface Chart PowerPoint Templates
Your Grasp Of Economics Is Well Known. Help Your Audience Comprehend Issues With Our multivariate data analysis numeric values surface chart Powerpoint Templates .

Business Diagram 3d Lock With Pie Graph For Result Representation PowerPoint Slide
This Power Point diagram has been crafted with pie chart in shape of lock. It contains diagram of lock pie chart to compare and present data in an effective manner. Use this diagram to build professional presentations for your viewers.

Money Market Example Diagram Ppt Examples Slides
This is a money market example diagram ppt examples slides. This is a three stage process. The stages in this process are equity, debt, bond.
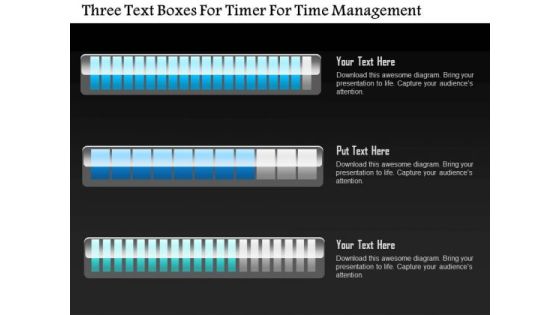
Business Diagram Three Text Boxes For Timer For Time Management PowerPoint Slide
This business diagram displays three text boxes. This diagram contains text boxes for data representation. Use this diagram to display business process workflows in any presentations.

Business Diagram Three Trucks For Data Representation For Business PowerPoint Slide
This business diagram displays three trucks graphic. This diagram contains trucks for percentage value growth. Use this diagram to display business growth over a period of time.
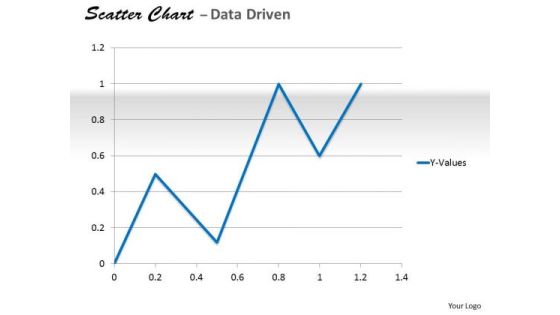
Data Analysis In Excel Analyzing Of Relationship Chart PowerPoint Templates
Delight Them With Our data analysis in excel analyzing of relationship chart Powerpoint Templates .
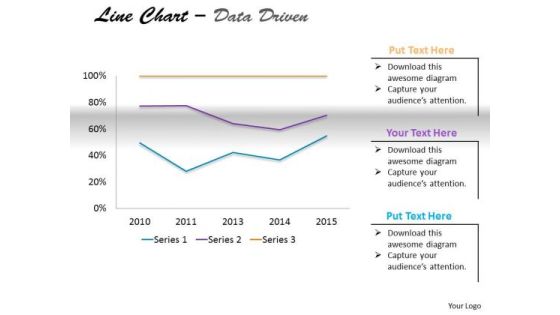
Multivariate Data Analysis Driven Market Line Chart PowerPoint Slides Templates
Delight Them With Our multivariate data analysis driven market line chart powerpoint slides Templates .

Business Data Analysis Chart For Project PowerPoint Templates
Document Your Views On Our business data analysis chart for project Powerpoint Templates. They Will Create A Strong Impression.
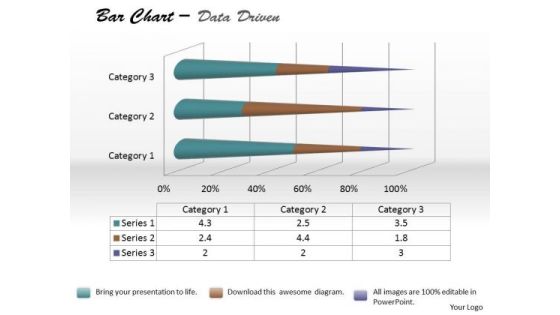
Data Analysis Bar Chart For Foreign Trade PowerPoint Templates
Be The Doer With Our data analysis bar chart for foreign trade Powerpoint Templates. Put Your Thoughts Into Practice.

Data Analysis Excel Business Tool Scatter Chart PowerPoint Templates
Dominate Proceedings With Your Ideas. Our data analysis excel business tool scatter chart Powerpoint Templates Will Empower Your Thoughts.
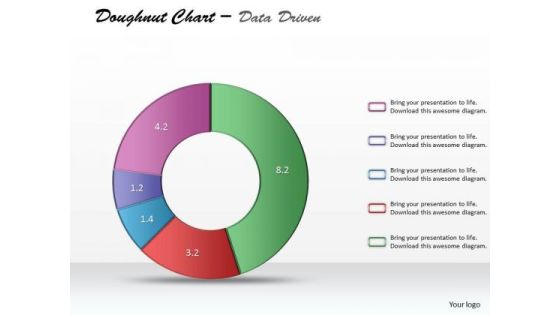
Data Analysis Excel Categorical Statistics Doughnut Chart PowerPoint Templates
Establish Your Dominion With Our data analysis excel categorical statistics doughnut chart Powerpoint Templates. Rule The Stage With Your Thoughts.

Data Analysis Techniques 3d Grouped Bar Chart PowerPoint Templates
Place The Orders With Your Thoughts. Our data analysis techniques 3d grouped bar chart Powerpoint Templates Know The Drill.
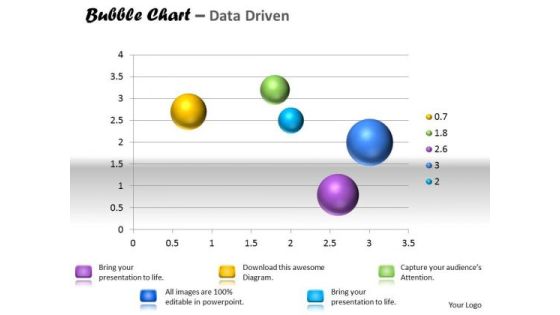
Data Analysis Template Interactive Bubble Chart PowerPoint Templates
Our data analysis template interactive bubble chart Powerpoint Templates Are A Wonder Drug. They Help Cure Almost Any Malaise.
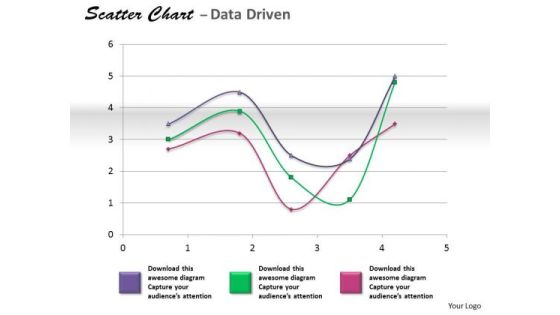
Financial Data Analysis Coordinate With Scatter Chart PowerPoint Templates
Get The Doers Into Action. Activate Them With Our financial data analysis coordinate with scatter chart Powerpoint Templates .
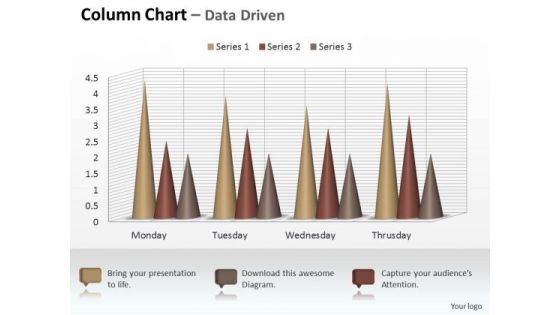
Marketing Data Analysis 3d Sets Of Column Chart PowerPoint Templates
Your Listeners Will Never Doodle. Our marketing data analysis 3d sets of column chart Powerpoint Templates Will Hold Their Concentration.
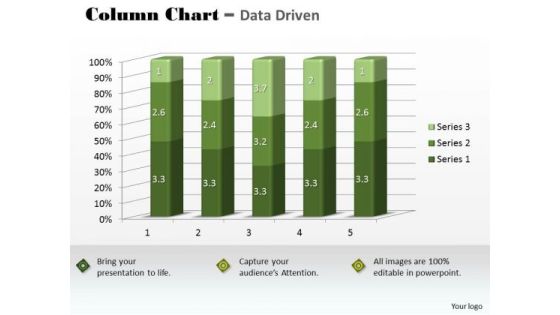
Marketing Data Analysis 3d Statistical Quality Control Chart PowerPoint Templates
Our marketing data analysis 3d statistical quality control chart Powerpoint Templates Abhor Doodling. They Never Let The Interest Flag.
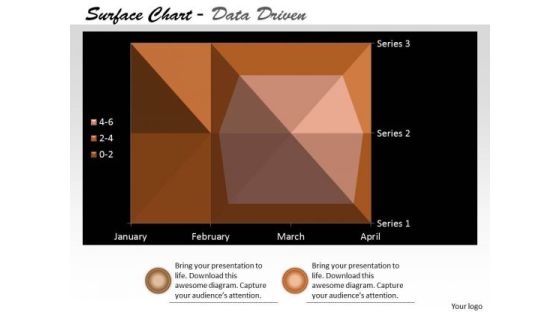
Multivariate Data Analysis Surface Chart Plots Trends PowerPoint Templates
Our multivariate data analysis surface chart plots trends Powerpoint Templates Heighten Concentration. Your Audience Will Be On The Edge.
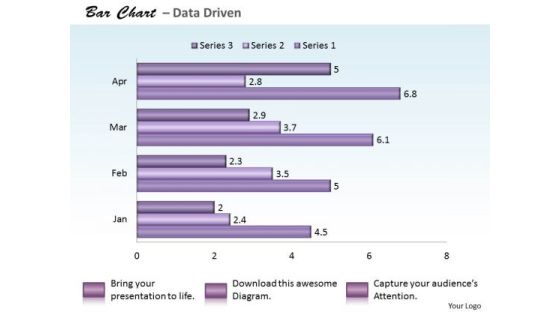
Quantitative Data Analysis Bar Chart For PowerPoint Templates
Reduce The Drag With Our quantitative data analysis bar chart for Powerpoint Templates . Give More Lift To Your Thoughts.

Data Analysis Techniques 3d Effective Display Chart PowerPoint Templates
Dribble Away With Our data analysis techniques 3d effective display chart Powerpoint Templates . Score A Goal With Your Ideas.
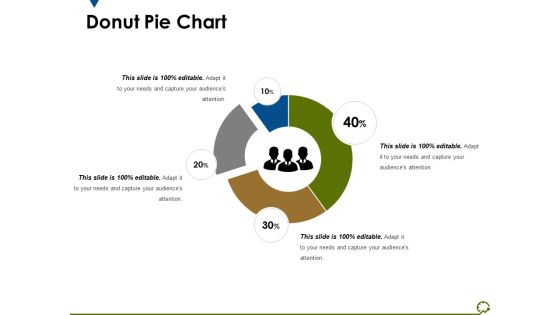
Donut Pie Chart Ppt PowerPoint Presentation Show Styles
This is a donut pie chart ppt powerpoint presentation show styles. This is a four stage process. The stages in this process are chart, business, process, management, percentage.
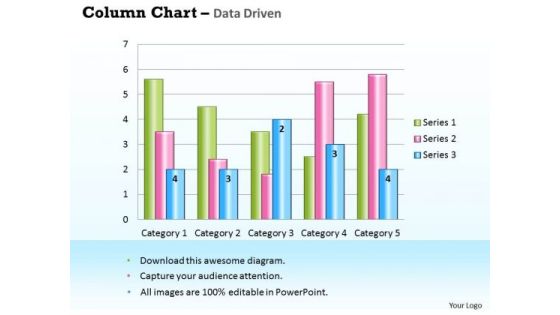
Business Data Analysis Chart For Case Studies PowerPoint Templates
Get Out Of The Dock With Our business data analysis chart for case studies Powerpoint Templates. Your Mind Will Be Set Free.
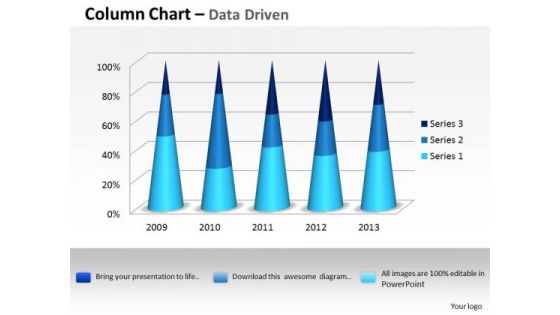
Data Analysis Excel 3d Process Variation Column Chart PowerPoint Templates
Put In A Dollop Of Our data analysis excel 3d process variation column chart Powerpoint Templates. Give Your Thoughts A Distinctive Flavor.

Data Analysis Excel Bubble Chart For Business Tasks PowerPoint Templates
Doll Up Your Thoughts With Our data analysis excel bubble chart for business tasks Powerpoint Templates. They Will Make A Pretty Picture.
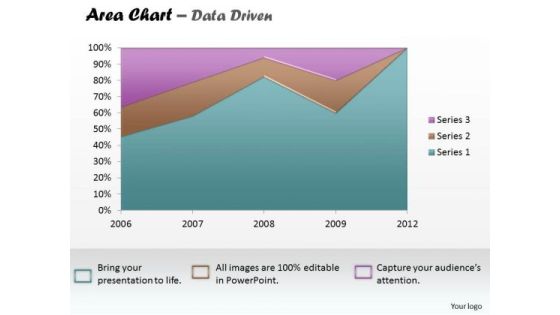
Data Analysis Excel Business Reporting Area Chart PowerPoint Templates
Establish The Dominance Of Your Ideas. Our data analysis excel business reporting area chart Powerpoint Templates Will Put Them On Top.

Data Analysis In Excel 3d Classification Of Chart PowerPoint Templates
With Our data analysis in excel 3d classification of chart Powerpoint Templates You Will Be Doubly Sure. They Possess That Stamp Of Authority.
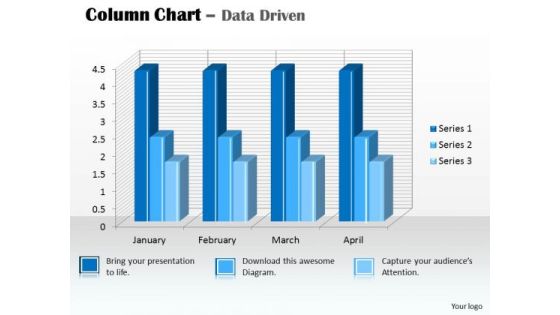
Data Analysis In Excel 3d Column Chart For PowerPoint Templates
Our data analysis in excel 3d column chart for Powerpoint Templates And Your Ideas Make A Great Doubles Pair. Play The Net With Assured Hands.

Data Analysis In Excel Of Stock Chart PowerPoint Templates
Plan Your Storyboard With Our data analysis in excel of stock chart Powerpoint Templates . Give An Outline To The Solutions You Have.

Data Analysis Programs 3d Bar Chart To Dispaly PowerPoint Templates
Lower The Drawbridge With Our data analysis programs 3d bar chart to dispaly Powerpoint Templates . Capture The Minds Of Your Audience.
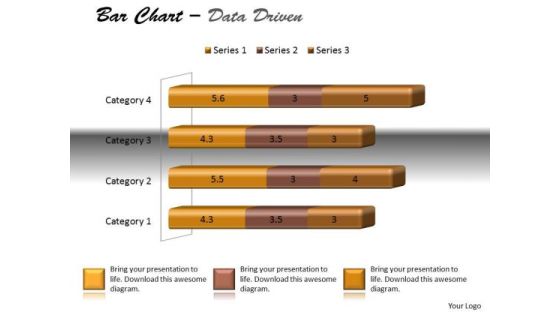
Data Analysis Techniques 3d Bar Chart For Modification PowerPoint Templates
Dreams Generate Thoughts, Thoughts Generate Ideas. Give Them Life With Our data analysis techniques 3d bar chart for modification Powerpoint Templates .

Data Analysis Techniques 3d In Segments Pie Chart PowerPoint Templates
Drink To The Success Of Your Campaign. Our data analysis techniques 3d in segments pie chart Powerpoint Templates Will Raise A Toast.

Data Analysis Template Driven Visualization Area Chart PowerPoint Slides Templates
Draw On The Energy Of Our data analysis template driven visualization area chart powerpoint slides Templates . Your Thoughts Will Perk Up.

Data Analysis Template Forex Market Bar Chart PowerPoint Templates
Attract A Crowd With Our data analysis template forex market bar chart Powerpoint Templates . They Will Drop It All And Come To Hear You.

Financial Data Analysis Area Chart For Showing Trends PowerPoint Templates
Document Your Views On Our financial data analysis area chart for showing trends Powerpoint Templates . They Will Create A Strong Impression.
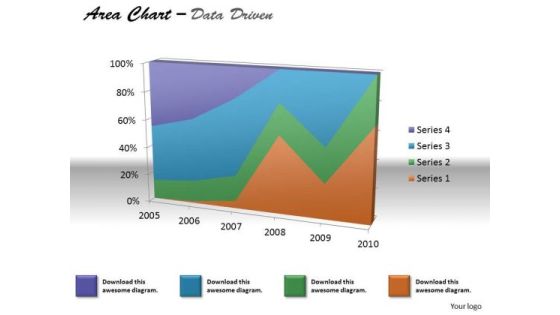
Financial Data Analysis Area Chart For Various Values PowerPoint Templates
Document The Process On Our financial data analysis area chart for various values Powerpoint Templates . Make A Record Of Every Detail.
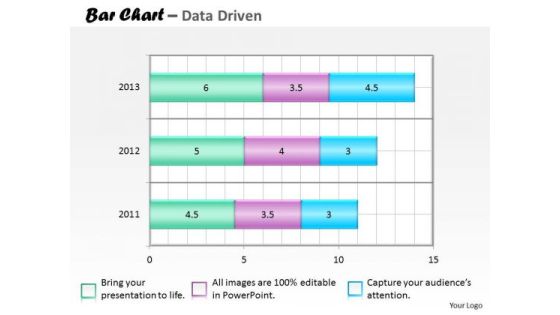
Financial Data Analysis Bar Chart For Collection Of PowerPoint Templates
Our financial data analysis bar chart for collection of Powerpoint Templates Team Are A Dogged Lot. They Keep At It Till They Get It Right.

Financial Data Analysis Currency Trading Bar Chart PowerPoint Templates
Put In A Dollop Of Our financial data analysis currency trading bar chart Powerpoint Templates . Give Your Thoughts A Distinctive Flavor.
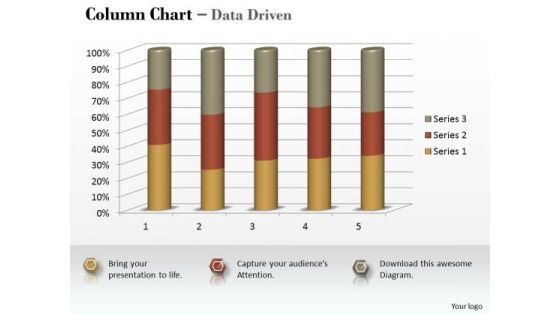
Marketing Data Analysis 3d Statistical Process Column Chart PowerPoint Templates
Be A Donor Of Great Ideas. Display Your Charity On Our marketing data analysis 3d statistical process column chart Powerpoint Templates .

Marketing Data Analysis 3d Statistical Process Control Chart PowerPoint Templates
Open Up Doors That Lead To Success. Our marketing data analysis 3d statistical process control chart Powerpoint Templates Provide The Handles.
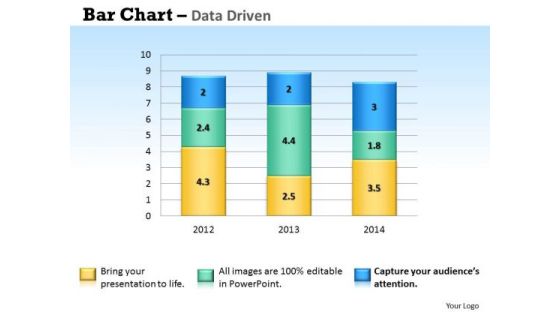
Microsoft Excel Data Analysis Bar Chart To Handle PowerPoint Templates
Our microsoft excel data analysis bar chart to handle Powerpoint Templates And Your Ideas Make A Great Doubles Pair. Play The Net With Assured Hands.
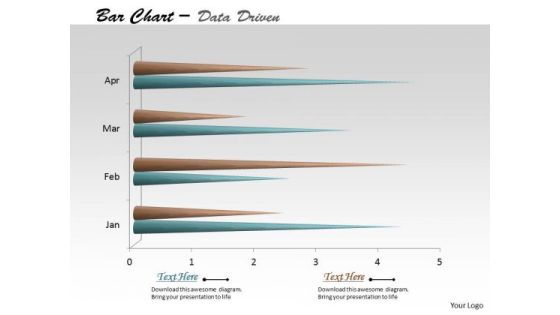
Multivariate Data Analysis Time Based Bar Chart PowerPoint Templates
Edit Your Work With Our multivariate data analysis time based bar chart Powerpoint Templates . They Will Help You Give The Final Form.
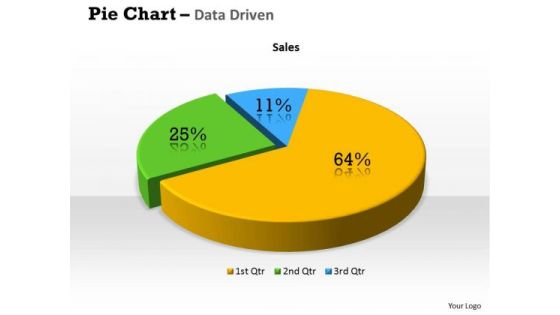
Quantitative Data Analysis 3d Percentage Ratio Pie Chart PowerPoint Templates
Plan Your Storyboard With Our quantitative data analysis 3d percentage ratio pie chart Powerpoint Templates . Give An Outline To The Solutions You Have.

Quantitative Data Analysis Bar Chart For Different Categories PowerPoint Templates
Make Some Dough With Our quantitative data analysis bar chart for different categories Powerpoint Templates . Your Assets Will Rise Significantly.

Quantitative Data Analysis Bar Chart For Financial Markets PowerPoint Templates
Draft It Out On Our quantitative data analysis bar chart for financial markets Powerpoint Templates . Give The Final Touches With Your Ideas.

Consulting PowerPoint Template Gantt Charts For Business Analysis Ppt Templates
Be the dramatist with our consulting PowerPoint template gantt charts for business analysis ppt templates. Script out the play of words. Put our Competition PowerPoint Templates into the draw. Your thoughts will win the lottery. Add some dramatization to your thoughts. Our Org Charts PowerPoint Templates make useful props.

Portative Analysis Bubble Chart Ppt PowerPoint Presentation Slide
This is a portative analysis bubble chart ppt powerpoint presentation slide. This is a six stage process. The stages in this process are portative, analysis, business, graph, bubble chart.

Column Chart Ppt PowerPoint Presentation Ideas Designs Download
This is a column chart ppt powerpoint presentation ideas designs download. This is a six stage process. The stages in this process are business, strategy, analysis, planning, column chart, financial.

Area Chart Ppt PowerPoint Presentation Infographics Graphics Tutorials
This is a area chart ppt powerpoint presentation infographics graphics tutorials. This is a two stage process. The stages in this process are product, area chart, sales in percentage.

Bar Chart Ppt PowerPoint Presentation Slides Design Ideas
This is a bar chart ppt powerpoint presentation slides design ideas. This is a six stage process. The stages in this process are product, bar chart, sales in percentage.
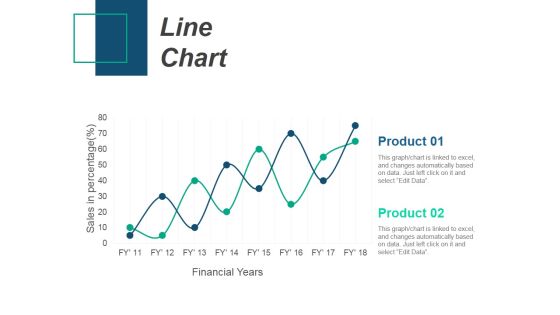
Line Chart Ppt PowerPoint Presentation Infographic Template Introduction
This is a line chart ppt powerpoint presentation infographic template introduction. This is a two stage process. The stages in this process are product, sales in percentage, financial years, line chart.
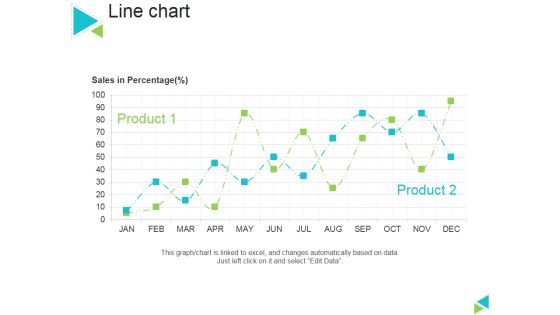
Line Chart Ppt PowerPoint Presentation Gallery Master Slide
This is a line chart ppt powerpoint presentation gallery master slide. This is a two stage process. The stages in this process are sales in percentage, product, line chart.
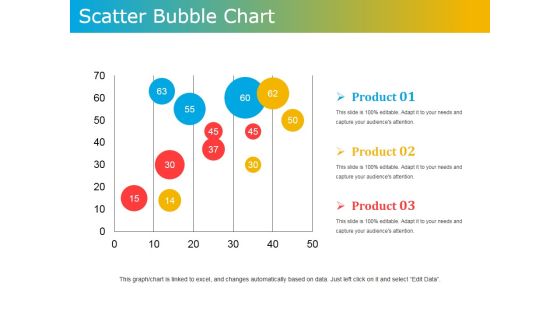
Scatter Bubble Chart Ppt PowerPoint Presentation Ideas Design Templates
This is a scatter bubble chart ppt powerpoint presentation ideas design templates. This is a three stage process. The stages in this process are product, scatter, bubble chart, business, marketing.

Donut Pie Chart Ppt PowerPoint Presentation Professional Format Ideas
This is a donut pie chart ppt powerpoint presentation professional format ideas. This is a three stage process. The stages in this process are donut pie chart, marketing, strategy, analysis, business.

Stacked Line Chart Ppt PowerPoint Presentation Model Show
This is a stacked line chart ppt powerpoint presentation model show. This is a two stage process. The stages in this process are stacked line chart, product, profit, percentage, growth.
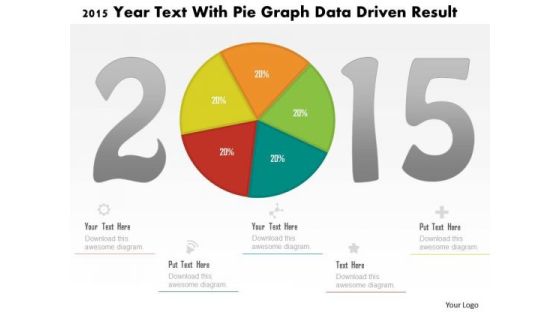
Business Diagram 2015 Year Text With Pie Graph Data Driven Result PowerPoint Slide
This business diagram displays 2015 year numbers with pie chart. This diagram is suitable to display business strategy for year 2015. Download this professional slide to present information in an attractive manner
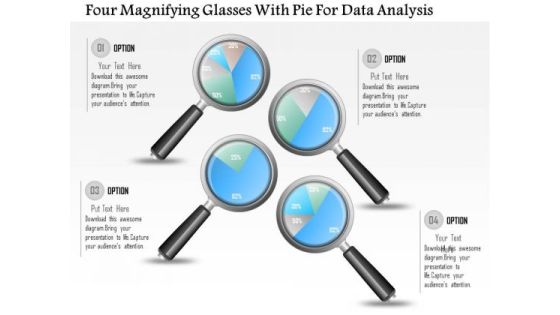
Business Diagram Four Magnifying Glasses With Pie For Data Analysis PowerPoint Slide
This business diagram displays graphic of pie charts in shape of magnifying glasses This business slide is suitable to present and compare business data. Use this diagram to build professional presentations for your viewers.

Business Diagram Tablet With Pie And Business Bar Graph For Result Analysis PowerPoint Slide
This PowerPoint template displays technology gadgets with various business charts. Use this diagram slide, in your presentations to make business reports for statistical analysis. You may use this diagram to impart professional appearance to your presentations.
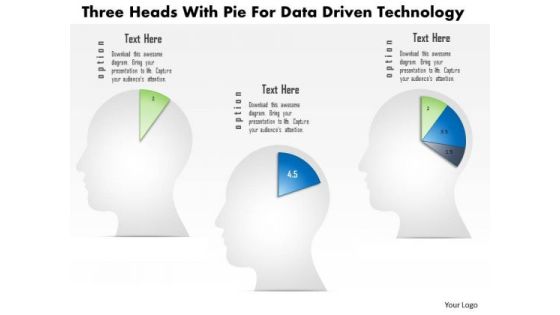
Business Diagram Three Heads With Pie For Data Driven Technology PowerPoint Slide
This business diagram displays three human faces with pie charts. This Power Point template has been designed to compare and present business data. You may use this diagram to impart professional appearance to your presentations.

Business Diagram Two Tablets With Growth Bar Graph Data Driven PowerPoint Slide
This business diagram has been designed with comparative charts on tablets. This slide suitable for data representation. You can also use this slide to present business reports and information. Use this diagram to present your views in a wonderful manner.

Business Data Analysis Chart Comparing Multiple Entities PowerPoint Templates
Analyze Ailments On Our business data analysis chart comparing multiple entities Powerpoint Templates. Bring Out The Thinking Doctor In You. Dock Your Thoughts With Our Financial Analysis . They Will Launch Them Into Orbit.
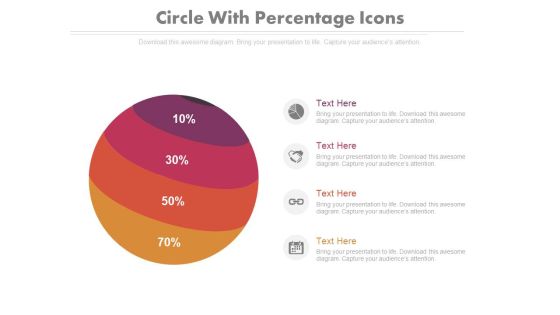
Four Parts Circle Chart With Percentage Ratio Powerpoint Slides
This PowerPoint template contains four parts circle chart with percentage ratio. You may download this PPT slide design to display your ideas in visual manner. You can easily customize this template to make it more unique as per your need.

Quantitative Data Analysis Driven Economic Status Line Chart PowerPoint Slides Templates
Be The Dramatist With Our quantitative data analysis driven economic status line chart powerpoint slides Templates . Script Out The Play Of Words.

Quantitative Data Analysis Driven Economic With Column Chart PowerPoint Slides Templates
Add Some Dramatization To Your Thoughts. Our quantitative data analysis driven economic with column chart powerpoint slides Templates Make Useful Props.

Volume High Low Close Chart Ppt PowerPoint Presentation Show
This is a volume high low close chart ppt powerpoint presentation show. This is a five stage process. The stages in this process are high, volume, low.

Stock Chart Ppt PowerPoint Presentation Inspiration Graphics Design
This is a stock chart ppt powerpoint presentation inspiration graphics design. This is a five stage process. The stages in this process are high, volume, low.

Volume Open High Low Close Chart Ppt PowerPoint Presentation Sample
This is a volume open high low close chart ppt powerpoint presentation sample. This is a five stage process. The stages in this process are close, volume, high, low, open.
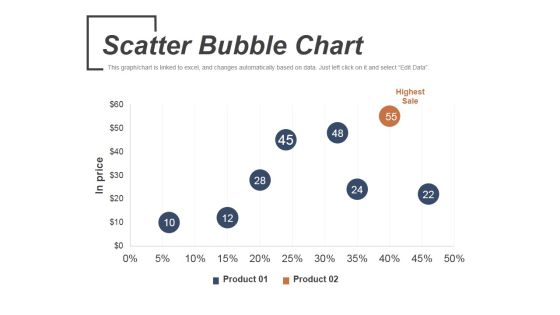
Scatter Bubble Chart Ppt PowerPoint Presentation Infographic Template Graphics
This is a scatter bubble chart ppt powerpoint presentation infographic template graphics. This is a two stage process. The stages in this process are highest sale, product, in price.
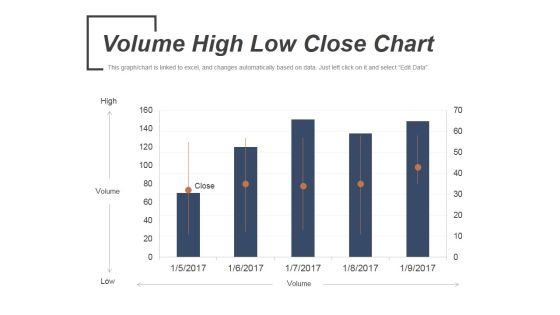
Volume High Low Close Chart Ppt PowerPoint Presentation Slides Portrait
This is a volume high low close chart ppt powerpoint presentation slides portrait. This is a five stage process. The stages in this process are volume, low, high, open, close.

Clustered Column Line Chart Ppt PowerPoint Presentation File Pictures
This is a clustered column line chart ppt powerpoint presentation file pictures. This is a four stage process. The stages in this process are clustered bar, product, planning, business, sales in percentage.
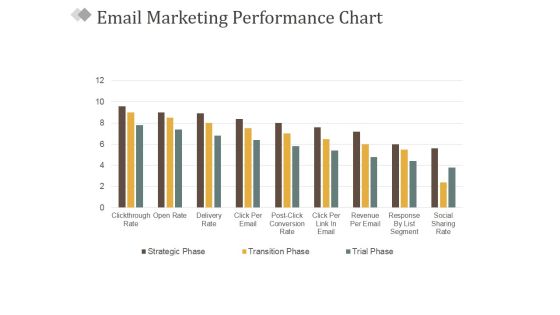
Email Marketing Performance Chart Ppt PowerPoint Presentation Gallery Elements
This is a email marketing performance chart ppt powerpoint presentation gallery elements. This is a nine stage process. The stages in this process are business, marketing, success, management, bar graph.

Line Bubble Chart Ppt PowerPoint Presentation Portfolio Slide Portrait
This is a line bubble chart ppt powerpoint presentation portfolio slide portrait. This is a six stage process. The stages in this process are highest profit, financial year, profit in sales, growth, business.

Column Chart Financial Ppt PowerPoint Presentation Outline Design Templates
This is a column chart financial ppt powerpoint presentation outline design templates. This is a two stage process. The stages in this process are financial, business, marketing, planning, strategy.
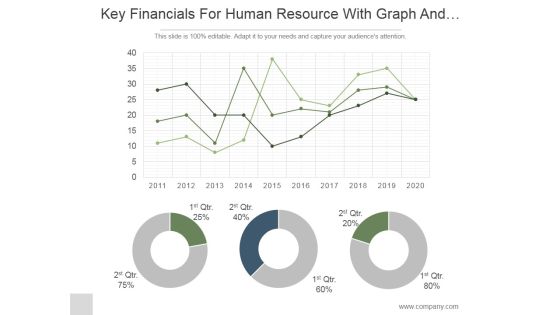
Key Financials For Human Resource With Graph And Pie Chart Ppt PowerPoint Presentation Ideas
This is a key financials for human resource with graph and pie chart ppt powerpoint presentation ideas. This is a three stage process. The stages in this process are business, strategy, marketing, analysis, donut, growth.
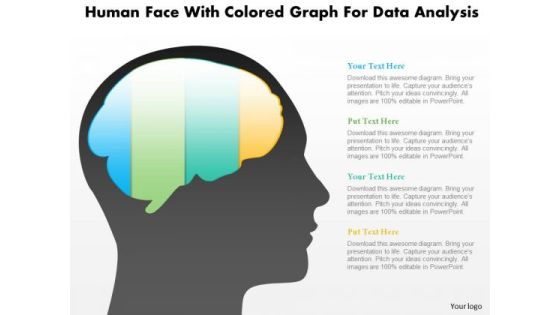
Business Diagram Human Face With Colored Graph For Data Analysis PowerPoint Slide
This diagram displays human face graphic with colored graph. This diagram can be used to represent strategy, planning, thinking of business plan. Display business options in your presentations by using this creative diagram.

X Bar And R Chart Ppt PowerPoint Presentation Background Designs
This is a x bar and r chart ppt powerpoint presentation background designs. This is a two stage process. The stages in this process are chart, business, marketing, strategy, success.
