AI PPT Maker
Templates
PPT Bundles
Design Services
Business PPTs
Business Plan
Management
Strategy
Introduction PPT
Roadmap
Self Introduction
Timelines
Process
Marketing
Agenda
Technology
Medical
Startup Business Plan
Cyber Security
Dashboards
SWOT
Proposals
Education
Pitch Deck
Digital Marketing
KPIs
Project Management
Product Management
Artificial Intelligence
Target Market
Communication
Supply Chain
Google Slides
Research Services
 One Pagers
All Categories
-
Home
- Customer Favorites
- Finance Icons
Finance Icons

Clustered Column Ppt PowerPoint Presentation Ideas Show
This is a clustered column ppt powerpoint presentation ideas show. This is a two stage process. The stages in this process are product, percentage, finance, business, bar graph.
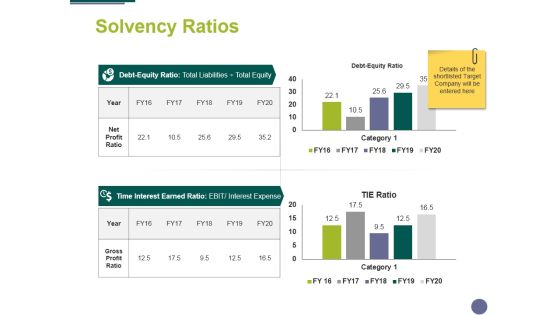
Solvency Ratios Ppt PowerPoint Presentation Infographics Portrait
This is a solvency ratios ppt powerpoint presentation infographics portrait. This is a two stage process. The stages in this process are compere, finance, marketing, analysis, business.

Clustered Bar Ppt PowerPoint Presentation Pictures Demonstration
This is a clustered bar ppt powerpoint presentation pictures demonstration. This is a two stage process. The stages in this process are clustered bar, finance, marketing, analysis, business.
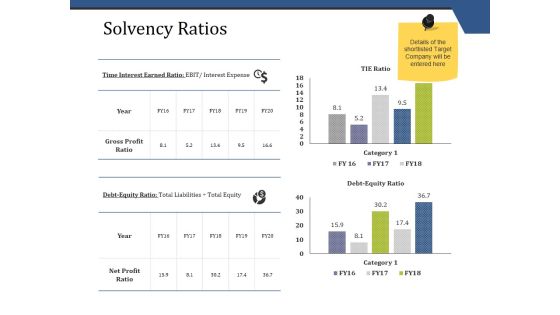
Solvency Ratios Ppt PowerPoint Presentation Summary Samples
This is a solvency ratios ppt powerpoint presentation summary samples. This is a two stage process. The stages in this process are business, compare, finance, marketing, strategy, analysis.

Solvency Ratios Ppt PowerPoint Presentation Summary Shapes
This is a solvency ratios ppt powerpoint presentation summary shapes. This is a two stage process. The stages in this process are compere, analysis, finance, business, marketing.

Clustered Column Ppt PowerPoint Presentation Layouts Ideas
This is a clustered column ppt powerpoint presentation layouts ideas. This is a two stage process. The stages in this process are product, profit, bar graph, growth, finance.
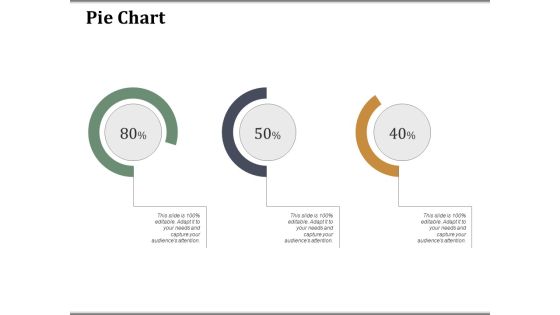
Pie Chart Companys Business Model Canvas Ppt PowerPoint Presentation Ideas Show
This is a pie chart companys business model canvas ppt powerpoint presentation ideas show. This is a three stage process. The stages in this process are pie chart, finance, marketing, analysis, business.

Customer Trends Template 1 Ppt PowerPoint Presentation Diagrams
This is a customer trends template 1 ppt powerpoint presentation diagrams. This is a five stage process. The stages in this process are business, marketing, bar graph, finance, management.
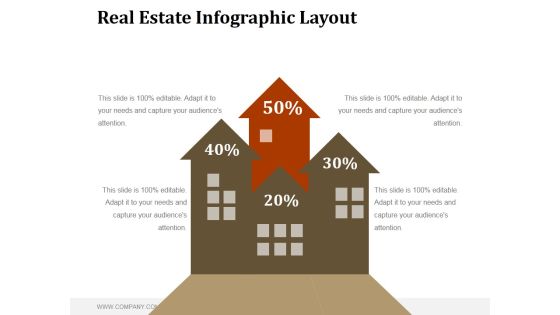
Real Estate Infographic Layout Ppt PowerPoint Presentation Diagrams
This is a real estate infographic layout ppt powerpoint presentation diagrams. This is a four stage process. The stages in this process are business, marketing, finance, sales plan, management.
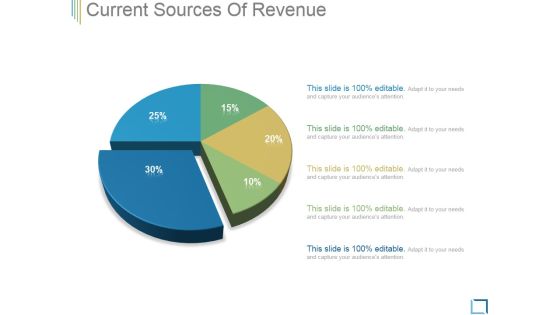
Current Sources Of Revenue Ppt PowerPoint Presentation Deck
This is a current sources of revenue ppt powerpoint presentation deck. This is a five stage process. The stages in this process are pie chart, marketing, finance, investment, business, success.

Monthly Financial Planning And Budgeting Process Ppt PowerPoint Presentation Visuals
This is a monthly financial planning and budgeting process ppt powerpoint presentation visuals. This is a six stage process. The stages in this process are growth, finance, development, financial development, economic growth, data analysis.

Portfolio Evaluation Ppt PowerPoint Presentation Infographics Objects
This is a portfolio evaluation ppt powerpoint presentation infographics objects. This is a two stage process. The stages in this process are business, finance, bar graph, pie chart, marketing, analysis, investment.
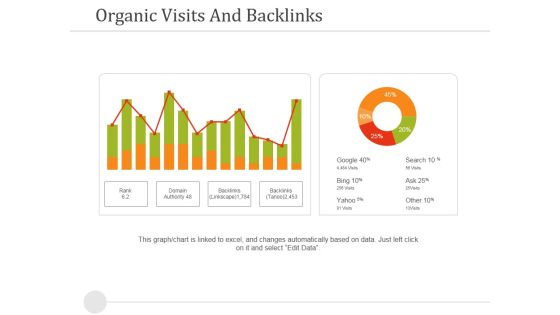
Organic Visits And Backlinks Ppt PowerPoint Presentation Professional File Formats
This is a organic visits and backlinks ppt powerpoint presentation professional file formats. This is a two stage process. The stages in this process are organic visits and backlinks, finance, success, strategy.
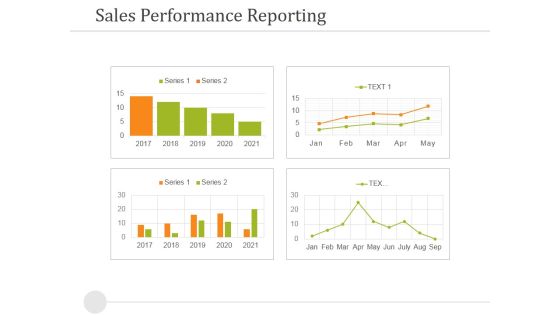
Sales Performance Reporting Ppt PowerPoint Presentation Outline Outfit
This is a sales performance reporting ppt powerpoint presentation outline outfit. This is a four stage process. The stages in this process are sales performance reporting, business, success, strategy, finance.

Bar Graph Ppt PowerPoint Presentation Styles Model
This is a bar graph ppt powerpoint presentation styles model. This is a four stage process. The stages in this process are bar graph, finance, marketing, analysis, investment, business.

Profitability Ratios Template 2 Ppt PowerPoint Presentation Outline Graphics Pictures
This is a profitability ratios template 2 ppt powerpoint presentation outline graphics pictures. This is a two stage process. The stages in this process are business, finance, marketing, analysis, investment.
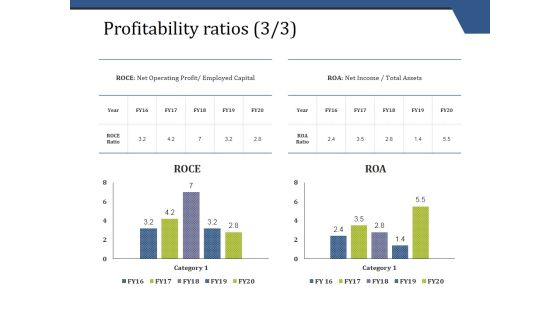
Profitability Ratios Template 3 Ppt PowerPoint Presentation Infographic Template Visual Aids
This is a profitability ratios template 3 ppt powerpoint presentation infographic template visual aids. This is a two stage process. The stages in this process are business, finance, marketing, analysis, investment.

Clustered Column Ppt PowerPoint Presentation Layouts Deck
This is a clustered column ppt powerpoint presentation layouts deck. This is a two stage process. The stages in this process are clustered column, finance, marketing, strategy, investment, business.

Portfolio Evaluation Template 1 Ppt PowerPoint Presentation Designs Download
This is a portfolio evaluation template 1 ppt powerpoint presentation designs download. This is a five stage process. The stages in this process are business, strategy, marketing, analysis, finance, chart and graph.
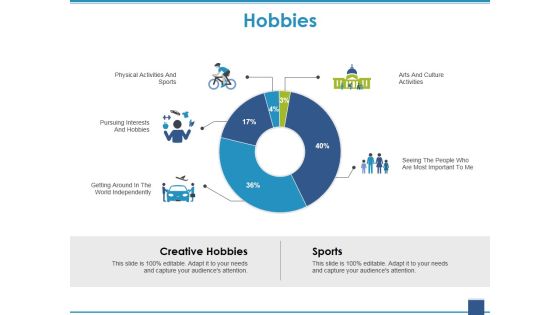
Hobbies Ppt PowerPoint Presentation Styles Outline
This is a hobbies ppt powerpoint presentation styles outline. This is a five stage process. The stages in this process are creative hobbies, sports, donut chart, finance, marketing, business.
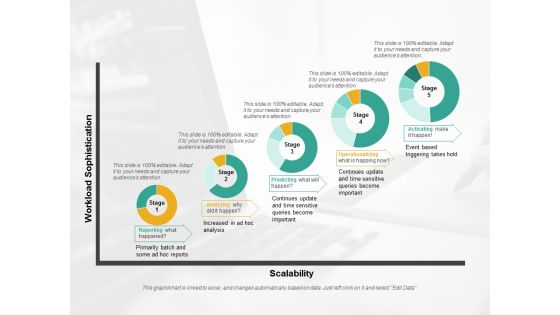
Predictive Analytics Stages Ppt PowerPoint Presentation Infographic Template Structure
This is a predictive analytics stages ppt powerpoint presentation infographic template structure. This is a five stage process. The stages in this process are business, donut chart, finance, marketing, strategy.

Organic Visits And Backlinks Ppt PowerPoint Presentation Graphics
This is a organic visits and backlinks ppt powerpoint presentation graphics. This is a two stage process. The stages in this process are business, finance, pie chart, marketing, strategy, success.

Geographical Reach By Region Template 1 Ppt PowerPoint Presentation Show Picture
This is a geographical reach by region template 1 ppt powerpoint presentation show picture. This is a five stage process. The stages in this process are ocation, geography, information, donut chart, success, finance.
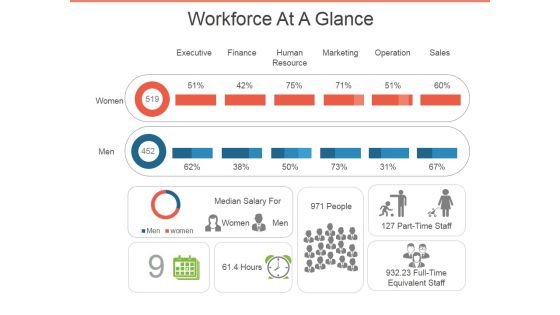
Workforce At A Glance Ppt PowerPoint Presentation Infographic Template Topics
This is a workforce at a glance ppt powerpoint presentation infographic template topics. This is a eight stage process. The stages in this process are executive, finance, human resource, marketing, operation, sales.
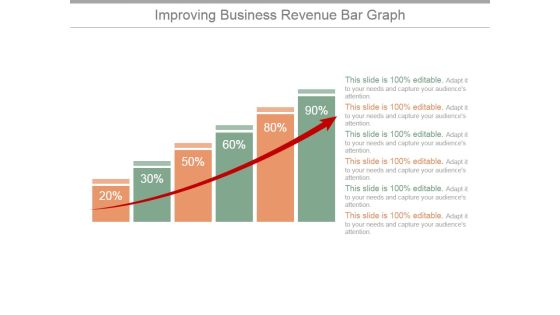
Improving Business Revenue Bar Graph Ppt PowerPoint Presentation Infographic Template
This is a improving business revenue bar graph ppt powerpoint presentation infographic template. This is a six stage process. The stages in this process are graph, arrow, finance, percentage, success.

Crm Dashboard Leads By Source Ppt PowerPoint Presentation Example File
This is a crm dashboard leads by source ppt powerpoint presentation example file. This is a five stage process. The stages in this process are pie, division, finance, dashboard, percent.

Bar Graph Ppt PowerPoint Presentation Gallery Example Topics
This is a bar graph ppt powerpoint presentation gallery example topics. This is a four stage process. The stages in this process are business, strategy, marketing, analysis, finance, bar graph.

Sales Forecasting Template 1 Ppt PowerPoint Presentation Infographic Template Maker
This is a sales forecasting template 1 ppt powerpoint presentation infographic template maker. This is a two stage process. The stages in this process are business, strategy, marketing, analysis, finance.

Company Sales And Performance Dashboard Ppt PowerPoint Presentation Slides Grid
This is a company sales and performance dashboard ppt powerpoint presentation slides grid. This is a four stage process. The stages in this process are business, strategy, marketing, finance, analysis.
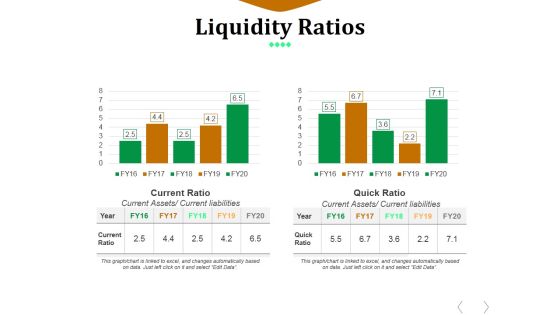
Liquidity Ratios Template 1 Ppt PowerPoint Presentation Styles Inspiration
This is a liquidity ratios template 1 ppt powerpoint presentation styles inspiration. This is a two stage process. The stages in this process are business, finance, management, current ratio, quick ratio.

Stacked Area Clustered Column Ppt PowerPoint Presentation Styles Gridlines
This is a stacked area clustered column ppt powerpoint presentation styles gridlines. This is a three stage process. The stages in this process are dollars, in percentage, finance, growth strategy, business, strategy.
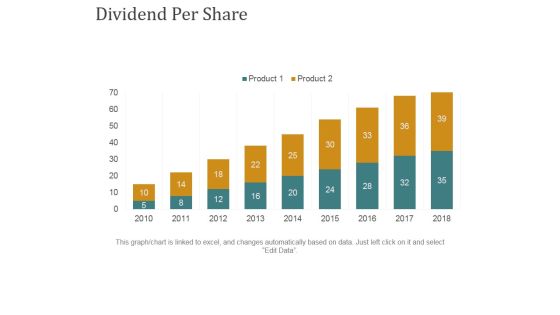
Dividend Per Share Ppt PowerPoint Presentation Summary Rules
This is a dividend per share ppt powerpoint presentation summary rules. This is a nine stage process. The stages in this process are business, bar graph, finance, marketing, strategy, growth.

Bar Graph Ppt PowerPoint Presentation File Graphic Tips
This is a bar graph ppt powerpoint presentation file graphic tips. This is a two stage process. The stages in this process are bar graph, finance, marketing, strategy, sales, business.
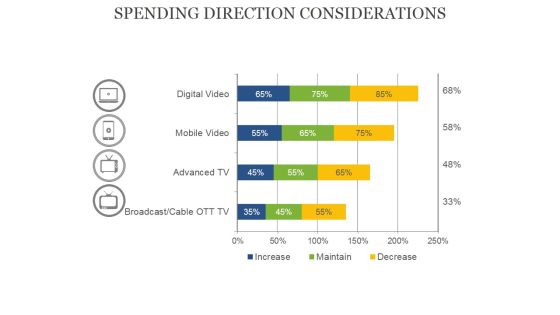
Spending Direction Considerations Ppt PowerPoint Presentation Portfolio Graphics Template
This is a spending direction considerations ppt powerpoint presentation portfolio graphics template. This is a four stage process. The stages in this process are bar graph, business, presentation, percentage, finance.

Market Insights Template 1 Ppt PowerPoint Presentation Ideas Topics
This is a market insights template 1 ppt powerpoint presentation ideas topics. This is a three stage process. The stages in this process are insight, finance, percentage, business, marketing, graph.

2016 Sales By Region Ppt PowerPoint Presentation Ideas Structure
This is a 2016 sales by region ppt powerpoint presentation ideas structure. This is a four stage process. The stages in this process are business, finance, strategy, management, location.

Business And Financial Overview Ppt PowerPoint Presentation Summary Format
This is a business and financial overview ppt powerpoint presentation summary format. This is a two stage process. The stages in this process are finance, analysis, marketing, business, compere.
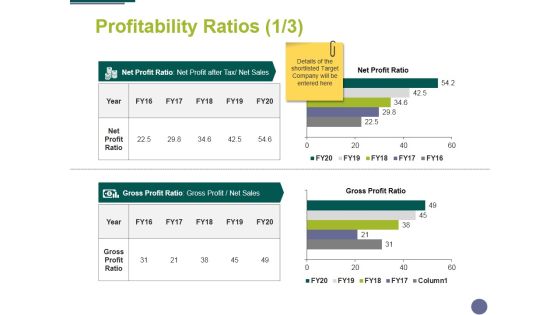
Profitability Ratios Template 1 Ppt PowerPoint Presentation Professional Skills
This is a profitability ratios template 1 ppt powerpoint presentation professional skills. This is a two stage process. The stages in this process are compere, finance, marketing, analysis, business.

Profitability Ratios Template 3 Ppt PowerPoint Presentation Ideas Skills
This is a profitability ratios template 3 ppt powerpoint presentation ideas skills. This is a two stage process. The stages in this process are compere, finance, marketing, analysis, business.

Profitability Ratios Template 1 Ppt PowerPoint Presentation Infographics Mockup
This is a profitability ratios template 1 ppt powerpoint presentation infographics mockup. This is a two stage process. The stages in this process are business, finance, marketing, strategy, analysis.

Profitability Ratios Template 2 Ppt PowerPoint Presentation File Graphics
This is a profitability ratios template 2 ppt powerpoint presentation file graphics. This is a two stage process. The stages in this process are finance, analysis, compere, strategy, business.

Profitability Ratios Template 3 Ppt PowerPoint Presentation Styles Introduction
This is a profitability ratios template 3 ppt powerpoint presentation styles introduction. This is a two stage process. The stages in this process are finance, analysis, compere, strategy, business.

Competitor Analysis Template 2 Ppt PowerPoint Presentation Styles Background Designs
This is a competitor analysis template 2 ppt powerpoint presentation styles background designs. This is a four stage process. The stages in this process are competitor analysis, finance, marketing, strategy, business.
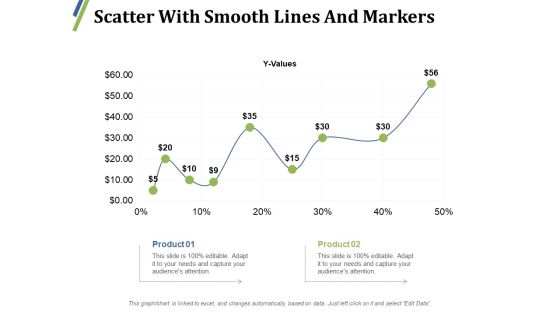
Scatter With Smooth Lines And Markers Ppt PowerPoint Presentation Outline Inspiration
This is a scatter with smooth lines and markers ppt powerpoint presentation outline inspiration. This is a two stage process. The stages in this process are product, percentage, finance, growth, line graph.
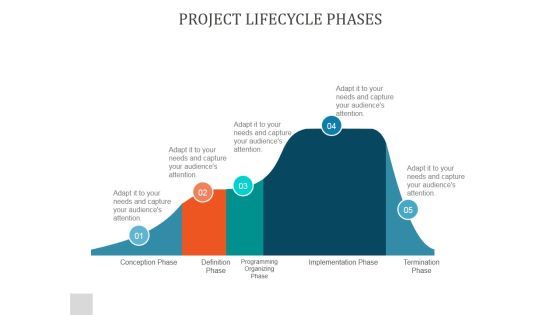
Project Lifecycle Phases Ppt PowerPoint Presentation Information
This is a project lifecycle phases ppt powerpoint presentation information. This is a five stage process. The stages in this process are conception phase, definition phase , programming organizing phase, implementation phase, termination phase.

Key Driver Analytics Ppt PowerPoint Presentation Visuals
This is a key driver analytics ppt powerpoint presentation visuals. This is a four stage process. The stages in this process are icons, management, currency, technology, business.
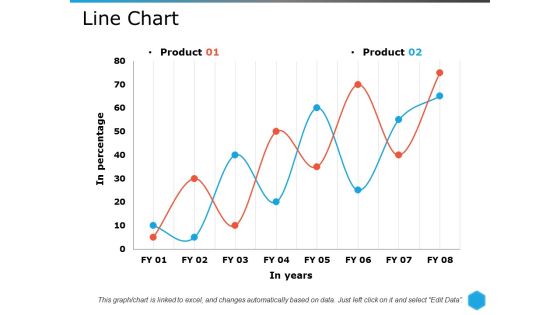
Line Chart Ppt PowerPoint Presentation Pictures Themes
This is a line chart ppt powerpoint presentation pictures themes. This is a two stage process. The stages in this process are line chart, growth, strategy, marketing, strategy, business.
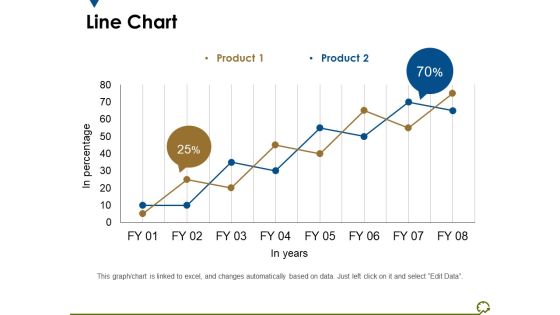
Line Chart Ppt PowerPoint Presentation Outline Diagrams
This is a line chart ppt powerpoint presentation outline diagrams. This is a two stage process. The stages in this process are in percentage, in years, percentage, business, marketing.

Rupee Growth Indication Chart Powerpoint Template
This business diagram displays rupee growth chart. This business diagram has been designed to implement strategic plan. Use this diagram to depict financial planning process in your presentations.

Business Diagram Colored Column Chart For Result Analysis PowerPoint Slide
This Power Point diagram has been designed with graphic of column chart. It contains diagram of bar char depicting annual business progress report. Use this diagram to build professional presentations for your viewers.
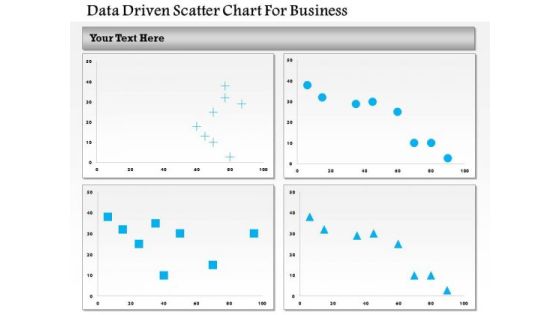
Business Diagram Data Driven Scatter Chart For Business PowerPoint Slide
This business diagram has been designed with four comparative charts. This slide suitable for data representation. You can also use this slide to present business analysis and reports. Use this diagram to present your views in a wonderful manner.

Business Diagram Laptop With Data Driven Area Chart PowerPoint Slide
This diagram has been designed with laptop and data driven area chart. Download this diagram to give your presentations more effective look. It helps in clearly conveying your message to clients and audience.

Business Diagram Flask With Data Driven Chart PowerPoint Slide
This data driven diagram has been designed with flask graphics. Download this diagram to give your presentations more effective look. It helps in clearly conveying your message to clients and audience.
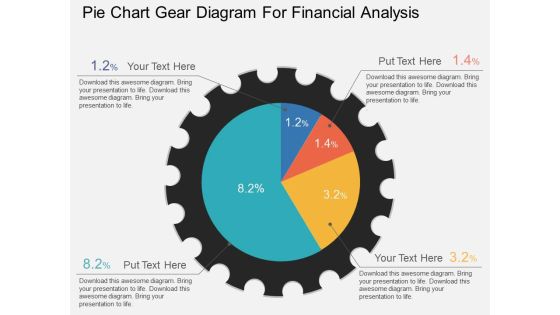
Pie Chart Gear Diagram For Financial Analysis Powerpoint Template
This PowerPoint template has been designed with graphic of pie chart gear diagram. This PPT slide can be used to display financial analysis. Download this PPT diagram slide to make your presentations more effective.

Commercial Expenditure Process Flow Chart Ppt PowerPoint Presentation Microsoft
This is a commercial expenditure process flow chart ppt powerpoint presentation microsoft. This is a four stage process. The stages in this process are investment, guaranteed return investment, non guaranteed return investment, fixed deposit, equity, diversified equity fund, sectorial equity fund, gold.
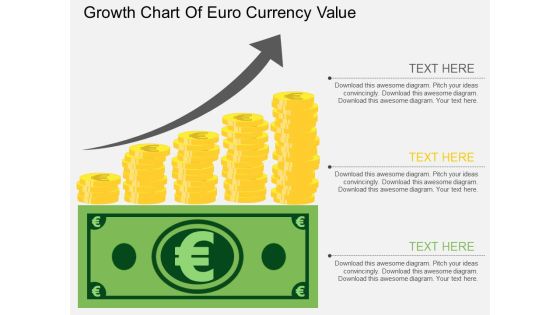
Growth Chart Of Euro Currency Value Powerpoint Template
The above PPT template displays growth chart of Euro currency. This diagram helps to exhibit Euro currency value growth. Adjust the above diagram in your business presentations to visually support your content.
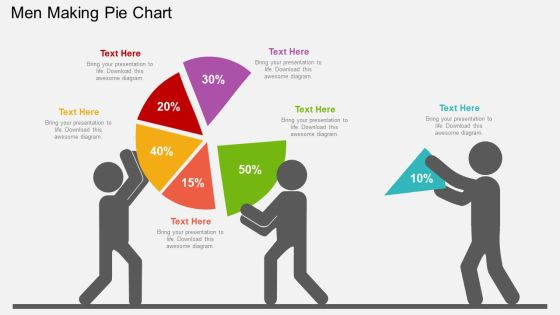
Men Making Pie Chart Powerpoint Templates
Our professionally designed business diagram is as an effective tool for communicating ideas and planning. It contains graphics of business man making pie chart. Design management function in strategic planning with this diagram slide. It will amplify the strength of your logic.
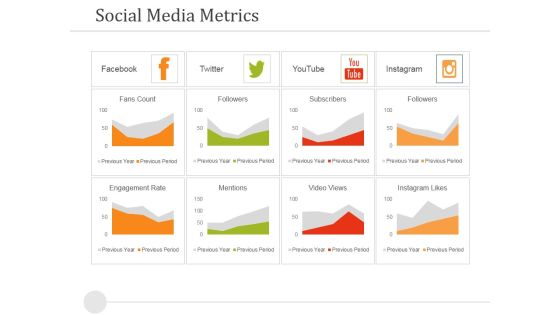
Social Media Metrics Ppt PowerPoint Presentation Layouts Designs Download
This is a social media metrics ppt powerpoint presentation layouts designs download. This is a eight stage process. The stages in this process are facebook, twitter, youtube, instagram.
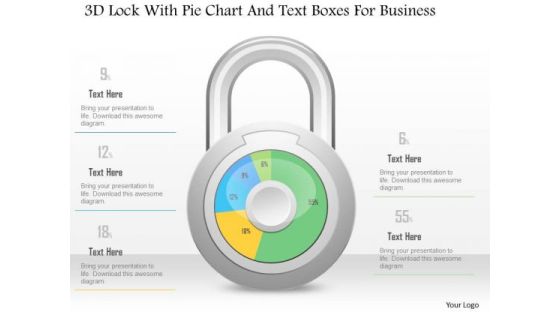
Business Diagram 3d Lock With Pie Chart And Text Boxes For Business PowerPoint Slide
This Power Point diagram has been crafted with pie chart in shape of lock. It contains diagram of lock pie chart to compare and present data in an effective manner. Use this diagram to build professional presentations for your viewers.

Business Diagram Six Staged Pie Charts For Text Representation PowerPoint Slide
This slide displays graphic six staged pie charts. Download this diagram to present and compare business data. Use this diagram to display business process workflows in any presentation.
