AI PPT Maker
Templates
PPT Bundles
Design Services
Business PPTs
Business Plan
Management
Strategy
Introduction PPT
Roadmap
Self Introduction
Timelines
Process
Marketing
Agenda
Technology
Medical
Startup Business Plan
Cyber Security
Dashboards
SWOT
Proposals
Education
Pitch Deck
Digital Marketing
KPIs
Project Management
Product Management
Artificial Intelligence
Target Market
Communication
Supply Chain
Google Slides
Research Services
 One Pagers
All Categories
-
Home
- Customer Favorites
- Finance Icons
Finance Icons

Business Integration Strategy Spoke Process 5 Stages Flow Chart Ppt Management
We present our business integration strategy spoke process 5 stages flow chart ppt management.Present our Competition PowerPoint Templates because you can Add colour to your speech with our PowerPoint Templates and Slides. Your presentation will leave your audience speechless. Download and present our Marketing PowerPoint Templates because Our PowerPoint Templates and Slides are topically designed to provide an attractive backdrop to any subject. Download and present our Arrows PowerPoint Templates because It can Leverage your style with our PowerPoint Templates and Slides. Charm your audience with your ability. Present our Business PowerPoint Templates because Our PowerPoint Templates and Slides will effectively help you save your valuable time. They are readymade to fit into any presentation structure. Use our Circle Charts PowerPoint Templates because Our PowerPoint Templates and Slides are innately eco-friendly. Their high recall value negate the need for paper handouts.Use these PowerPoint slides for presentations relating to Achievement, arrow, business, chart, communication, competition, development, diagram, direction, financial, forward, graphic, growth, increase, investment, leadership, management, marketing, moving, organization, presentation, profit, progress, report, representation, shape, sign, stakeholder, success, symbol, target, teamwork, tool, upwards, way, win. The prominent colors used in the PowerPoint template are Blue, Black, White.

Business Charts For Market Statistical Analysis Ppt PowerPoint Presentation Slides Summary PDF
Presenting business charts for market statistical analysis ppt powerpoint presentation slides summary pdf to dispense important information. This template comprises three stages. It also presents valuable insights into the topics including business charts for market statistical analysis. This is a completely customizable PowerPoint theme that can be put to use immediately. So, download it and address the topic impactfully.

3D Pie Chart For Data Comparison Ppt Infographic Template Vector PDF
Presenting 3d pie chart for data comparison ppt infographic template vector pdf. to dispense important information. This template comprises three stages. It also presents valuable insights into the topics including data analysis solution, 3d pie chart for data comparison. This is a completely customizable PowerPoint theme that can be put to use immediately. So, download it and address the topic impactfully.

Pie Chart Infographic With Percentage Share Ppt Infographic Template Inspiration PDF
Presenting pie chart infographic with percentage share ppt infographic template inspiration pdf. to dispense important information. This template comprises three stages. It also presents valuable insights into the topics including pie chart infographic with percentage share. This is a completely customizable PowerPoint theme that can be put to use immediately. So, download it and address the topic impactfully.

Scatter Chart Illustrating Data Analysis Ppt PowerPoint Presentation Show Graphic Tips PDF
Presenting scatter chart illustrating data analysis ppt powerpoint presentation show graphic tips pdf to dispense important information. This template comprises three stages. It also presents valuable insights into the topics including scatter chart illustrating data analysis. This is a completely customizable PowerPoint theme that can be put to use immediately. So, download it and address the topic impactfully.

Scatter Chart With Upward Arrows Ppt PowerPoint Presentation Outline Tips PDF
Presenting scatter chart with upward arrows ppt powerpoint presentation outline tips pdf to dispense important information. This template comprises three stages. It also presents valuable insights into the topics including scatter chart with upward arrows. This is a completely customizable PowerPoint theme that can be put to use immediately. So, download it and address the topic impactfully.

Line Chart Illustrating Business Statistical Trends Ppt PowerPoint Presentation Outline Deck PDF
Presenting line chart illustrating business statistical trends ppt powerpoint presentation outline deck pdf to dispense important information. This template comprises three stages. It also presents valuable insights into the topics including line chart illustrating business statistical trends. This is a completely customizable PowerPoint theme that can be put to use immediately. So, download it and address the topic impactfully.
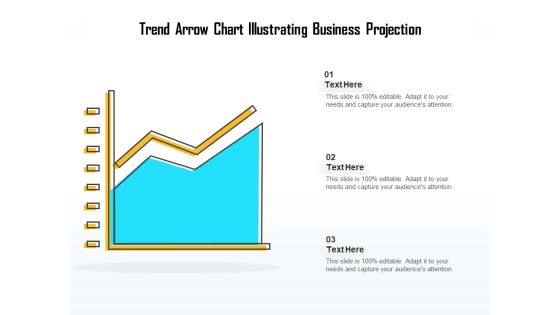
Trend Arrow Chart Illustrating Business Projection Ppt PowerPoint Presentation Ideas Sample PDF
Presenting trend arrow chart illustrating business projection ppt powerpoint presentation ideas sample pdf to dispense important information. This template comprises three stages. It also presents valuable insights into the topics including trend arrow chart illustrating business projection. This is a completely customizable PowerPoint theme that can be put to use immediately. So, download it and address the topic impactfully.

Chart Showing Growth In Property Value Ppt PowerPoint Presentation File Background Designs PDF
Presenting chart showing growth in property value ppt powerpoint presentation file background designs pdf to dispense important information. This template comprises three stages. It also presents valuable insights into the topics including chart showing growth in property value. This is a completely customizable PowerPoint theme that can be put to use immediately. So, download it and address the topic impactfully.

Cost And Benefits Of New Product Ppt PowerPoint Presentation Inspiration Diagrams
This is a cost and benefits of new product ppt powerpoint presentation inspiration diagrams. This is a three stage process. The stages in this process are recurrent costs, cost decreasing, revenue increasing, benefits, costs.
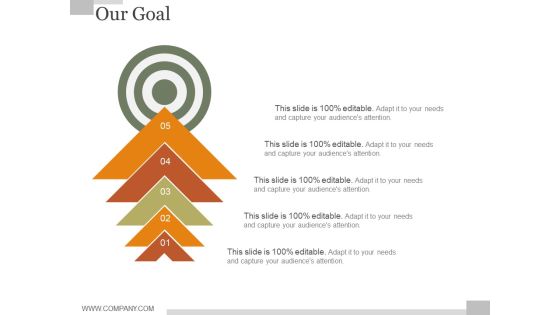
Our Goal Ppt PowerPoint Presentation Themes
This is a our goal ppt powerpoint presentation themes. This is a five stage process. The stages in this process are our goal, marketing, strategy, business, success.

Disaster Statistics Ppt PowerPoint Presentation Themes
This is a disaster statistics ppt powerpoint presentation themes. This is a seven stage process. The stages in this process are weather, geophysical, average .

Extended Marketing Mix Ppt PowerPoint Presentation Themes
This is a extended marketing mix ppt powerpoint presentation themes. This is a three stage process. The stages in this process are process, people, physical evidence.
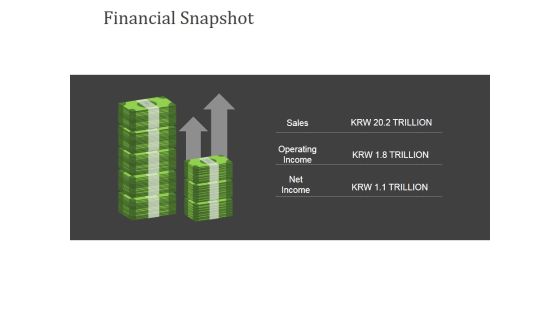
Financial Snapshot Ppt PowerPoint Presentation Model Themes
This is a financial snapshot ppt powerpoint presentation model themes. This is a two stage process. The stages in this process are sales, operating income, net income.

Our Goal Ppt PowerPoint Presentation Pictures Themes
This is a our goal ppt powerpoint presentation pictures themes. This is a three stage process. The stages in this process are our goal, target, business, marketing, strategy.
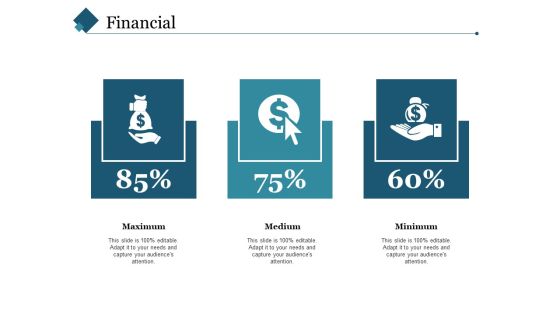
Financial Ppt PowerPoint Presentation Professional Themes
This is a financial ppt powerpoint presentation professional themes. This is a three stage process. The stages in this process are maximum, medium, minimum.
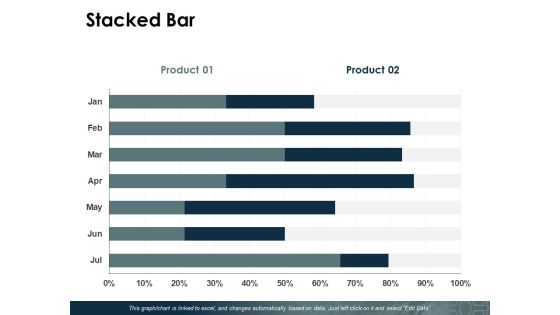
Stacked Bar Ppt PowerPoint Presentation Ideas Themes
This is a stacked bar ppt powerpoint presentation ideas themes. This is a two stage process. The stages in this process are product, percentage, management, marketing.
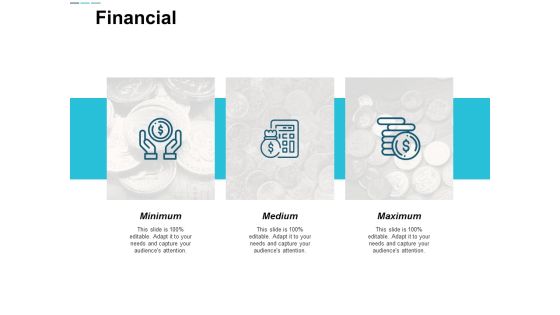
Financial Maximum Ppt Powerpoint Presentation Themes
This is a financial maximum ppt powerpoint presentation themes. This is a three stage process. The stages in this process are financial, minimum, maximum, marketing, strategy.
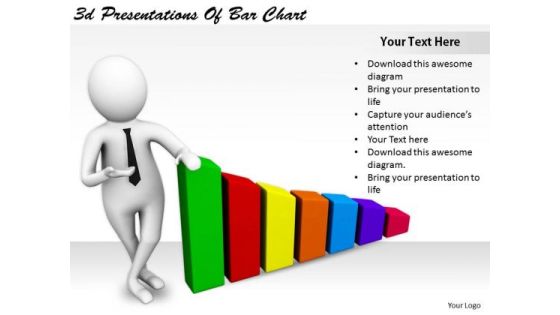
Business Strategy Innovation 3d Presentations Of Bar Chart Character Modeling
Your Thoughts Will Be The Main Course. Provide The Dressing With Our business strategy innovation 3d presentations of bar chart character modeling Powerpoint Templates. Dress Up Your Views With Our Marketing Powerpoint Templates. Deliver Your Ideas With Aplomb.
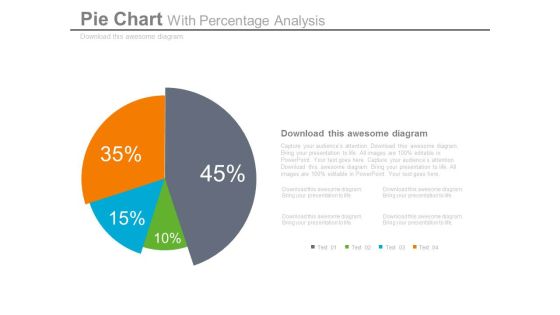
Pie Chart Dashboard Style For Percentage Analysis Powerpoint Slides
This dashboard PPT template contains graphics of pie chart. This dashboard PowerPoint template helps to display percentage analysis in a visual manner. Download this PPT slide for quick decision-making.
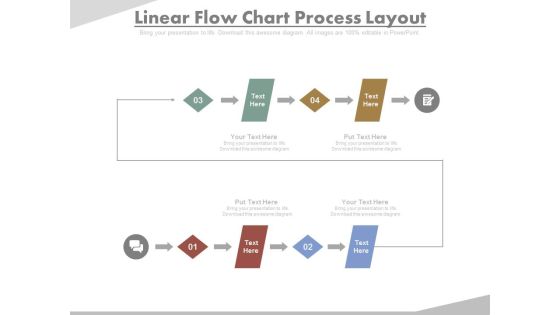
Four Steps In Linear Flow Chart Powerpoint Slides
This PowerPoint template contains design of four steps flow chart. You may download this slide to display workflow and processes. You can easily customize this template to make it more unique as per your need.

Bar Graph With Line Chart For Analysis Powerpoint Slides
This PowerPoint template contains design of bar graph with line chart. You may download this slide to display strategy steps for business growth. You can easily customize this template to make it more unique as per your need.
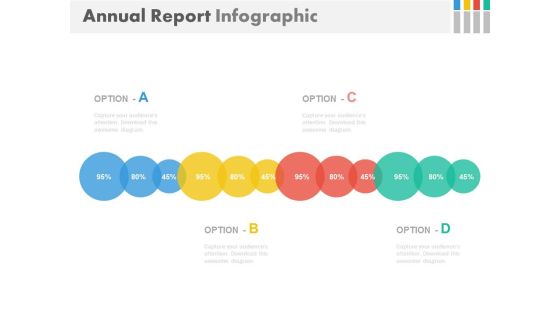
Linear Chart For Annual Business Report Powerpoint Slides
This PowerPoint template contains graphics of linear circle chart. You may download this PPT slide design to display annual business report. You can easily customize this template to make it more unique as per your need.

Two Table Charts For Business Data Powerpoint Slides
This PowerPoint template contains two tables chart. You may download this PPT slide to display statistical analysis. You can easily customize this template to make it more unique as per your need.

Pie Charts For Percentage Value Analysis Powerpoint Slides
Our above PPT slide displays graphics of Pie charts. This PowerPoint template may be used to display percentage value analysis. Download this template to leave permanent impression on your audience.

Sales And Marketing Plan Gantt Chart Ppt Examples Slides
This is a sales and marketing plan gantt chart ppt examples slides. This is a three stage process. The stages in this process are sales goal, sales actual, banner ads, newspaper, in store marketing.

Charts For Portfolio Evaluation Techniques Example Ppt Presentation
This is a charts for portfolio evaluation techniques example ppt presentation. This is a five stage process. The stages in this process are peso govt debt securities, foreign govt debt securities, peso corporate debt securities, dollar corporate debt securities, equity.
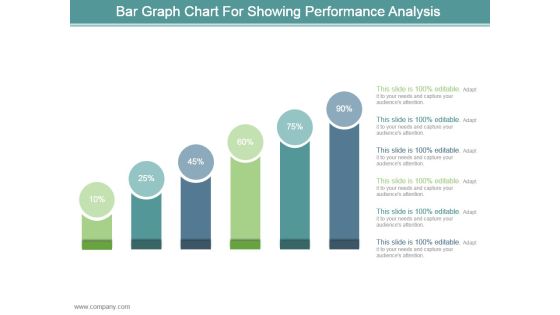
Bar Graph Chart For Showing Performance Analysis Ppt Design
This is a bar graph chart for showing performance analysis ppt design. This is a six stage process. The stages in this process are business, marketing, process, success, presentation.

Improved Customer Service Experience Pie Charts Ppt PowerPoint Presentation Templates
This is a improved customer service experience pie charts ppt powerpoint presentation templates. This is a four stage process. The stages in this process are increased efficiency, better business decision making, improved customer experience and engagement, achieved financial savings.

Hierarchy Chart Sample Templates Ppt PowerPoint Presentation Background Designs
This is a hierarchy chart sample templates ppt powerpoint presentation background designs. This is a two stage process. The stages in this process are business, marketing, management, communication, planning.

Xbar And R Chart Ppt PowerPoint Presentation Example 2015
This is a xbar and r chart ppt powerpoint presentation example 2015. This is a two stage process. The stages in this process are business, strategy, marketing, success, growth strategy.

data collection and analysis flow chart ppt powerpoint presentation microsoft
This is a data collection and analysis flow chart ppt powerpoint presentation microsoft. This is a nine stage process. The stages in this process are business, planning, marketing, strategy, management.

Data Collection And Analysis Control Chart Ppt PowerPoint Presentation Visuals
This is a data collection and analysis control chart ppt powerpoint presentation visuals. This is a ten stage process. The stages in this process are upper limit, centerline, lower limit, plotted points.

Column Chart Ppt PowerPoint Presentation Infographic Template Graphic Images
This is a column chart ppt powerpoint presentation infographic template graphic images. This is a nine stage process. The stages in this process are business, marketing, growth, product, management.

Bar Chart Ppt PowerPoint Presentation Pictures Background Image
This is a bar chart ppt powerpoint presentation pictures background image. This is a seven stage process. The stages in this process are financial years, sales in percentage, graph, business.

Donut Pie Chart Ppt PowerPoint Presentation Infographic Template Sample
This is a donut pie chart ppt powerpoint presentation infographic template sample. This is a six stage process. The stages in this process are business, pie, process, planning, strategy.

Scatter Bubble Chart Ppt PowerPoint Presentation Inspiration Backgrounds
This is a scatter bubble chart ppt powerpoint presentation inspiration backgrounds. This is a five stage process. The stages in this process are highest sale, in price, business, marketing, success.

Area Chart Ppt PowerPoint Presentation Layouts Graphics Example
This is a area chart ppt powerpoint presentation layouts graphics example. This is a two stage process. The stages in this process are sales in percentage, financial year, business, marketing, presentation.

Line Chart Ppt Powerpoint Presentation Infographic Template Format
This is a line chart ppt powerpoint presentation infographic template format. This is a two stage process. The stages in this process are jan, feb, mar, apr, may, financial.

High Low Close Chart Ppt PowerPoint Presentation Professional Background Images
This is a high low close chart ppt powerpoint presentation professional background images. This is a five stage process. The stages in this process are close, high, volume, low, open.
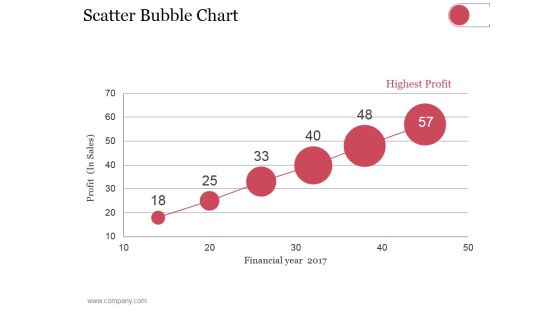
Scatter Bubble Chart Ppt PowerPoint Presentation Summary Pictures
This is a scatter bubble chart ppt powerpoint presentation summary pictures. This is a six stage process. The stages in this process are highest profit, financial year, profit in sales.

Volume High Low Close Chart Ppt PowerPoint Presentation Outline Examples
This is a volume high low close chart ppt powerpoint presentation outline examples. This is a five stage process. The stages in this process are high, low, volume, graph, business.

Combo Chart Ppt PowerPoint Presentation Infographic Template Brochure
This is a combo chart ppt powerpoint presentation infographic template brochure. This is a eight stage process. The stages in this process are product, market size, strategy, business, marketing.
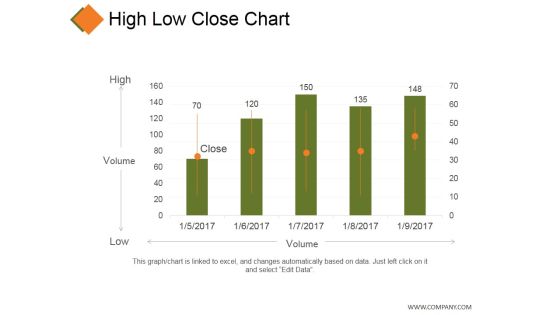
High Low Close Chart Ppt PowerPoint Presentation Model Grid
This is a high low close chart ppt powerpoint presentation model grid. This is a five stage process. The stages in this process are business, high, volume, low, marketing.

Donut Pie Chart Ppt PowerPoint Presentation Inspiration Background Image
This is a donut pie chart ppt powerpoint presentation inspiration background image. This is a three stage process. The stages in this process are product, percentage, business, marketing, process.
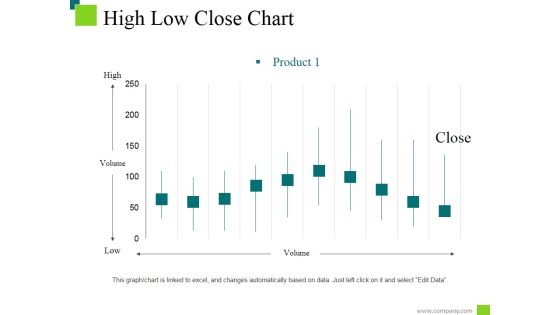
High Low Close Chart Ppt PowerPoint Presentation Styles Information
This is a high low close chart ppt powerpoint presentation styles information. This is a ten stage process. The stages in this process are low, high, product, volume, close.
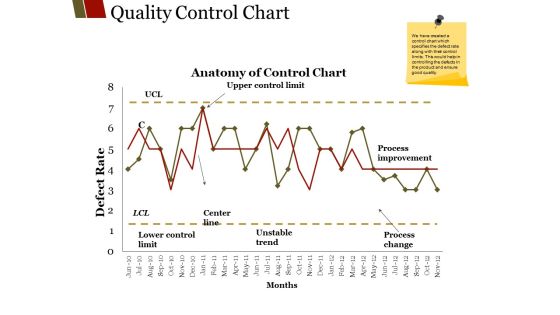
Quality Control Chart Ppt PowerPoint Presentation File Graphics Design
This is a quality control chart ppt powerpoint presentation file graphics design. This is a two stage process. The stages in this process are unstable trend, months center line, lower control limit, process improvement.
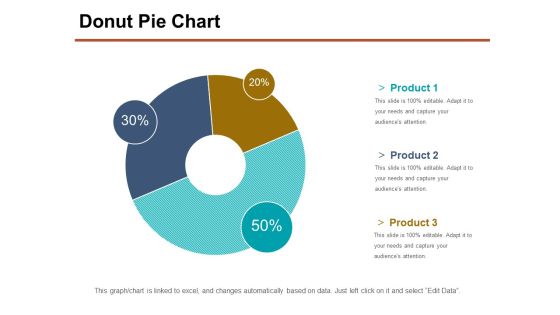
Donut Pie Chart Ppt PowerPoint Presentation Professional Slide Portrait
This is a donut pie chart ppt powerpoint presentation professional slide portrait. This is a three stage process. The stages in this process are product, percentage, business, management, process.
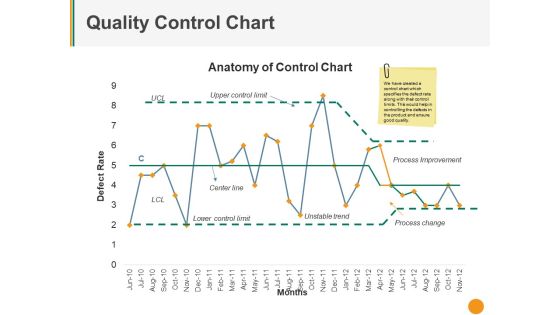
Quality Control Chart Ppt PowerPoint Presentation Pictures Deck
This is a quality control chart ppt powerpoint presentation pictures deck. This is a one stage process. The stages in this process are upper control limit, center line, unstable trend, process improvement, process change.
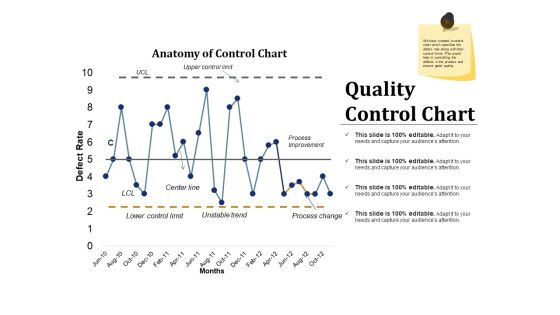
Quality Control Chart Ppt PowerPoint Presentation Inspiration Example Introduction
This is a quality control chart ppt powerpoint presentation inspiration example introduction. This is a two stage process. The stages in this process are process improvement, process change, unstable trend, lower control limit, center line.

Line Chart Ppt PowerPoint Presentation Portfolio Design Templates
This is a line chart ppt powerpoint presentation portfolio design templates. This is a two stage process. The stages in this process are in percentage, in years, percentage, business, graph.
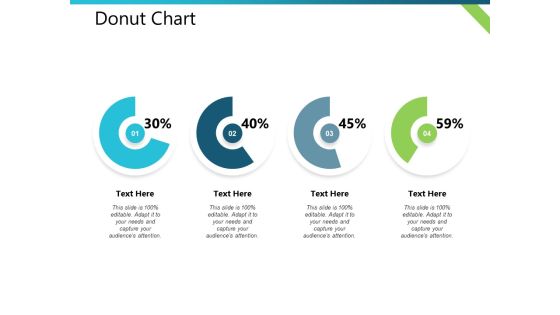
Donut Chart Distribution Plan Ppt PowerPoint Presentation Visual Aids Outline
This is a donut chart distribution plan ppt powerpoint presentation visual aids outline. This is a four stage process. The stages in this process are business, management, financial, marketing, strategy.

Bar Chart Ppt PowerPoint Presentation Infographic Template Graphics Design
This is a bar chart ppt powerpoint presentation infographic template graphics design. This is a five stage process. The stages in this process are management, marketing, business, percentage, product.
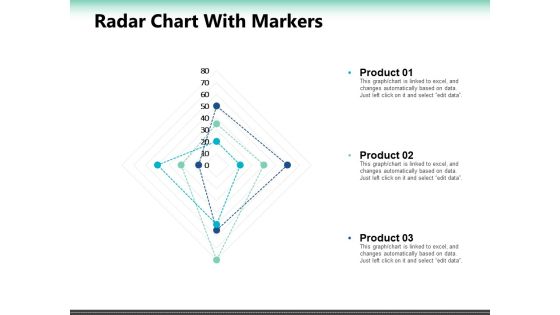
Radar Chart With Markers Ppt PowerPoint Presentation Summary Slide Portrait
This is a radar chart with markers ppt powerpoint presentation summary slide portrait. This is a seven stage process. The stages in this process are percentage, product, business, marketing.

Cash Payment Management Flow Chart Ppt PowerPoint Presentation Styles Professional
This is a cash payment management flow chart ppt powerpoint presentation styles professional. This is a seven stage process. The stages in this process are liquidity, cash assets, solvency.
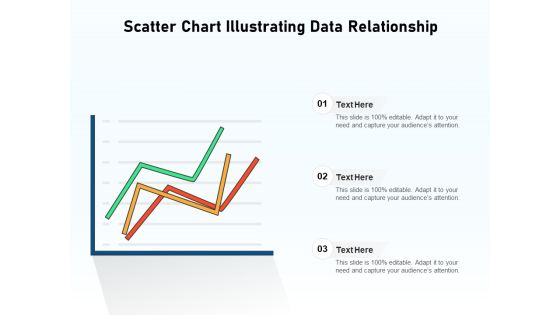
Scatter Chart Illustrating Data Relationship Ppt PowerPoint Presentation Microsoft PDF
Persuade your audience using this scatter chart illustrating data relationship ppt powerpoint presentation microsoft pdf. This PPT design covers three stages, thus making it a great tool to use. It also caters to a variety of topics including scatter chart illustrating data relationship. Download this PPT design now to present a convincing pitch that not only emphasizes the topic but also showcases your presentation skills.
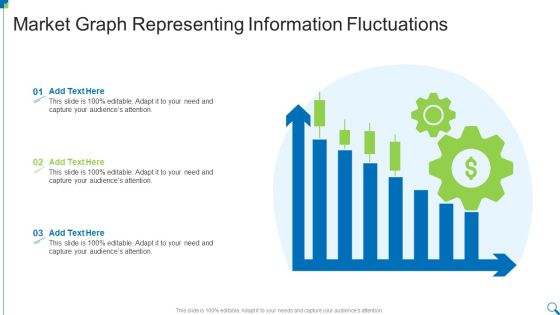
Market Graph Representing Information Fluctuations Diagrams PDF
Presenting Market Graph Representing Information Fluctuations Diagrams PDF to dispense important information. This template comprises three stages. It also presents valuable insights into the topics including Market Graph, Representing, Information Fluctuations This is a completely customizable PowerPoint theme that can be put to use immediately. So, download it and address the topic impactfully.

Financial Analysis Ratios Ppt Slide Themes
This is a financial analysis ratios ppt slide themes. This is a five stage process. The stages in this process are liquidity ratio, asset turnover ratios, financial leverage ratios, profitability ratios, dividend policy ratios.

Corporate Business Diversity Communication Plan Themes PDF
The following slide showcases communication strategy for business that brings fresh ideas which lead to innovation and creativity. It presents information related to enterprise, operational, etc. Presenting Corporate Business Diversity Communication Plan Themes PDF to dispense important information. This template comprises five stages. It also presents valuable insights into the topics including Enterprise, Business Unit Strategy, Operational Strategy. This is a completely customizable PowerPoint theme that can be put to use immediately. So, download it and address the topic impactfully.
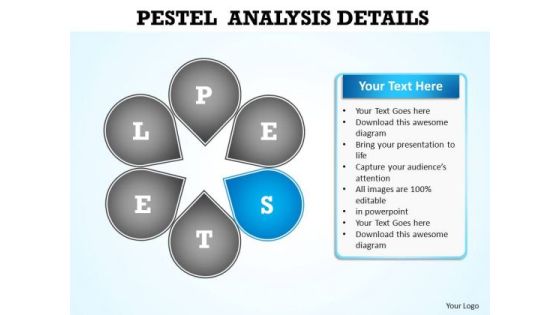
PowerPoint Slide Layout Chart Pestel Analysis Ppt Design
PowerPoint Slide layout Chart Pestel Analysis PPT Design-The Circle of Life - a concept embedded in our minds and hence easy to comprehend. Life and Business is made up of processes comprising stages that flow from one to another. An excellent graphic to attract the attention of and understanding by your audience to improve earnings.
