Finance Executive Summary
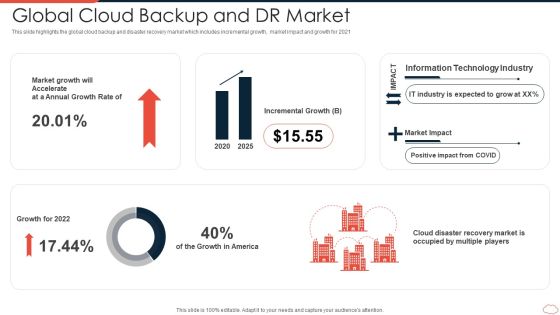
Global Cloud Backup And DR Market Topics PDF
This slide highlights the global cloud backup and disaster recovery market which includes incremental growth, market impact and growth for 2021 Pitch your topic with ease and precision using this global cloud backup and dr market topics pdf. This layout presents information on growth, market, rate. It is also available for immediate download and adjustment. So, changes can be made in the color, design, graphics or any other component to create a unique layout.

Customer Support Kpi Dashboard For Evaluating Sales Business Process Outsourcing Performance Slides PDF
Pitch your topic with ease and precision using this customer support kpi dashboard for evaluating sales business process outsourcing performance slides pdf. This layout presents information on customer support kpi dashboard for evaluating sales business process outsourcing performance. It is also available for immediate download and adjustment. So, changes can be made in the color, design, graphics or any other component to create a unique layout.

Potential Market Demographic For Social Media Campaign Microsoft PDF
This slide illustrates different age based demographics of target customers on social media. It includes different demographic such as age gender and education.Pitch your topic with ease and precision using this potential market demographic for social media campaign microsoft pdf This layout presents information on potential market demographic for social media campaign It is also available for immediate download and adjustment. So, changes can be made in the color, design, graphics or any other component to create a unique layout.
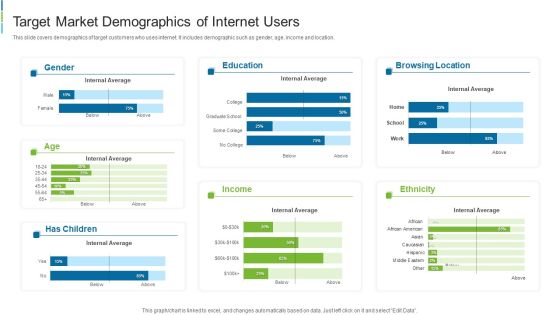
Target Market Demographics Of Internet Users Themes PDF
This slide covers demographics of target customers who uses internet. It includes demographic such as gender, age, income and location. Pitch your topic with ease and precision using this target market demographics of internet users themes pdf This layout presents information on target market demographics of internet users It is also available for immediate download and adjustment. So, changes can be made in the color, design, graphics or any other component to create a unique layout.

Corporate Earnings And Risk Metrics Dashboard Guidelines PDF
This slide illustrates graphical representation of risk key performance indicators. It includes financial risks, operational risk and risk expenditure etc. Pitch your topic with ease and precision using this Corporate Earnings And Risk Metrics Dashboard Guidelines PDF. This layout presents information on Financial Risk, Operational Risk Expenditure. It is also available for immediate download and adjustment. So, changes can be made in the color, design, graphics or any other component to create a unique layout.

Third Party Vendors Risk Metrics Performance Indicators Dashboard Topics PDF
This slide illustrates graphical representation of risk key performance indicators. It includes third party vendors trust score, impact score and risk score. Pitch your topic with ease and precision using this Third Party Vendors Risk Metrics Performance Indicators Dashboard Topics PDF. This layout presents information on Third Party Vendors Risk Metrics Performance Indicators Dashboard. It is also available for immediate download and adjustment. So, changes can be made in the color, design, graphics or any other component to create a unique layout.

Email Product By Firm Depicting Impressive Performance Guidelines PDF
This slide caters details about effective email offerings by firm showcasing impressive performance with rise in shares of user per usage type. Pitch your topic with ease and precision using this Email Product By Firm Depicting Impressive Performance Guidelines PDF. This layout presents information on Email Product By Firm Depicting Impressive Performance. It is also available for immediate download and adjustment. So, changes can be made in the color, design, graphics or any other component to create a unique layout.

Digital Dashboard Indicating Insurance Agent Sales Performance Portrait PDF
This slide illustrates insurance agent sales performance digital dashboard. It provides information about total proposals, policies, accident, claims, sales revenue, rewards, etc. Pitch your topic with ease and precision using this Digital Dashboard Indicating Insurance Agent Sales Performance Portrait PDF. This layout presents information on Sales Revenue, Reward And Recognition. It is also available for immediate download and adjustment. So, changes can be made in the color, design, graphics or any other component to create a unique layout.

Clinical Risk Assessment Dashboard For Improving Quality And Safety In Healthcare Brochure PDF
This slide illustrates key initiatives taken by HR department for resolving global team conflicts. Pitch your topic with ease and precision using this Clinical Risk Assessment Dashboard For Improving Quality And Safety In Healthcare Brochure PDF This layout presents information on Ward Administration, Patient Experience, Risk Assessment It is also available for immediate download and adjustment. So, changes can be made in the color, design, graphics or any other component to create a unique layout.

Insurance Business Model Of Healthcare Insurance Industry Dashboard Slides PDF
Following slide showcases the dashboard of healthcare insurance industrys claim model. It indicates the no. of claims paid, rejections, trends of claims paid etc.Pitch your topic with ease and precision using this Insurance Business Model Of Healthcare Insurance Industry Dashboard Slides PDF This layout presents information on Rejections, Reimbursement, Account Payable It is also available for immediate download and adjustment. So, changes can be made in the color, design, graphics or any other component to create a unique layout.
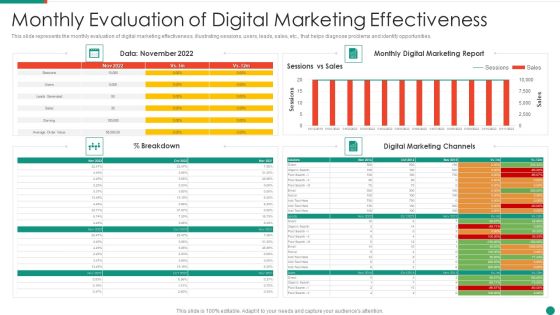
Monthly Evaluation Of Digital Marketing Effectiveness Demonstration PDF
This slide represents the monthly evaluation of digital marketing effectiveness, illustrating sessions, users, leads, sales, etc., that helps diagnose problems and identify opportunities.Pitch your topic with ease and precision using this Metrics To Measure Content Marketing Effectiveness Guidelines PDF This layout presents information on Monthly Evaluation, Digital Marketing, Effectiveness It is also available for immediate download and adjustment. So, changes can be made in the color, design, graphics or any other component to create a unique layout.
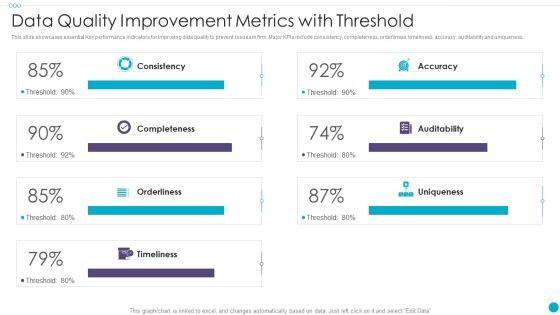
Data Quality Improvement Metrics With Threshold Formats PDF
This slide showcases essential Key performance indicators for improving data quality to prevent issues in firm. Major KPIs include consistency, completeness, orderliness, timeliness, accuracy, auditability and uniqueness. Pitch your topic with ease and precision using this Data Quality Improvement Metrics With Threshold Formats PDF This layout presents information on Auditability, Completeness, Consistency It is also available for immediate download and adjustment. So, changes can be made in the color, design, graphics or any other component to create a unique layout.

Employee Key Performance Indicators With Scores Themes PDF
The following slide highlights the staff key performance Indicators with scores illustrating key headings which includes staff performance , average scores and team result areas Pitch your topic with ease and precision using this Employee Key Performance Indicators With Scores Themes PDF This layout presents information on Staff Performance, Average Scores, Team Result It is also available for immediate download and adjustment. So, changes can be made in the color, design, graphics or any other component to create a unique layout.
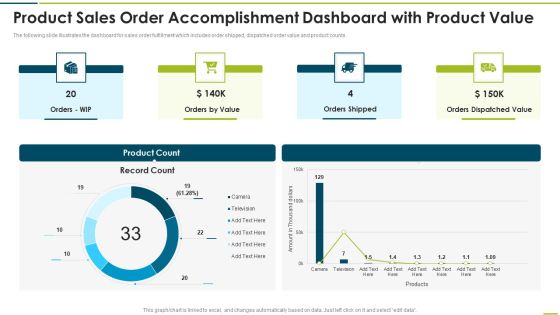
Product Sales Order Accomplishment Dashboard With Product Value Themes PDF
The following slide illustrates the dashboard for sales order fulfillment which includes order shipped, dispatched order value and product counts.Pitch your topic with ease and precision using this Product Sales Order Accomplishment Dashboard With Product Value Themes PDF This layout presents information on Orders Shipped, Dispatched Value, Orders Value It is also available for immediate download and adjustment. So, changes can be made in the color, design, graphics or any other component to create a unique layout.
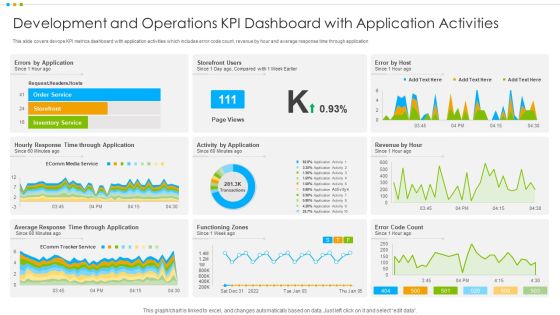
Development And Operations KPI Dashboard With Application Activities Information PDF
This slide covers devops KPI metrics dashboard with application activities which includes error code count, revenue by hour and average response time through application.Pitch your topic with ease and precision using this Development And Operations KPI Dashboard With Application Activities Information PDF This layout presents information on Development Operations Kpi Dashboard, Application Activities It is also available for immediate download and adjustment. So, changes can be made in the color, design, graphics or any other component to create a unique layout.

Development And Operations KPI Dashboard With Traffic Volume Professional PDF
This slide covers about backend errors, anomalies, traffic volume with production errors on hourly basis due as expected.Pitch your topic with ease and precision using this Development And Operations KPI Dashboard With Traffic Volume Professional PDF This layout presents information on Anomalies, Traffics Volume, Production Errors It is also available for immediate download and adjustment. So, changes can be made in the color, design, graphics or any other component to create a unique layout.

Talent Acquisition And Multinational Hiring KPI Dashboard Mockup PDF
The slide highlights the talent acquisition and multinational recruitment dash board depicting number of positions, open positions by location, candidate pipeline, interview and compliance.Pitch your topic with ease and precision using this Talent Acquisition And Multinational Hiring KPI Dashboard Mockup PDF This layout presents information on Candidate Ranking, Positions, Contingent It is also available for immediate download and adjustment. So, changes can be made in the color, design, graphics or any other component to create a unique layout.

Online Marketing Analytics Performance Report Microsoft PDF
This slide shows the digital marketing analytics performance report such as social media, blog and public relation performance with website health.Pitch your topic with ease and precision using this Online Marketing Analytics Performance Report Microsoft PDF This layout presents information on Blog Performance, Media Performance, Effective Engagement It is also available for immediate download and adjustment. So, changes can be made in the color, design, graphics or any other component to create a unique layout.
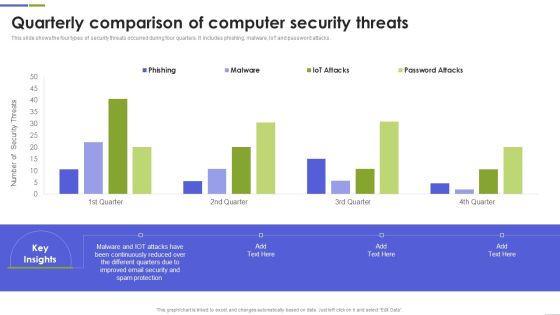
Quarterly Comparison Of Computer Security Threats Mockup PDF
This slide shows the four types of security threats occurred during four quarters. It includes phishing, malware, IoT and password attacks. Pitch your topic with ease and precision using this Quarterly Comparison Of Computer Security Threats Mockup PDF This layout presents information on Continuously Reduced, Different Quarters, Spam Protection It is also available for immediate download and adjustment. So, changes can be made in the color, design, graphics or any other component to create a unique layout.
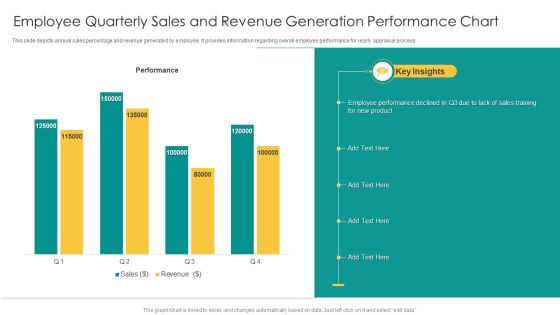
Employee Quarterly Sales And Revenue Generation Performance Chart Mockup PDF
This slide depicts annual sales percentage and revenue generated by employee. It provides information regarding overall employee performance for yearly appraisal process. Pitch your topic with ease and precision using this Employee Quarterly Sales And Revenue Generation Performance Chart Mockup PDF. This layout presents information on Performance, Sales, Revenue. It is also available for immediate download and adjustment. So, changes can be made in the color, design, graphics or any other component to create a unique layout.
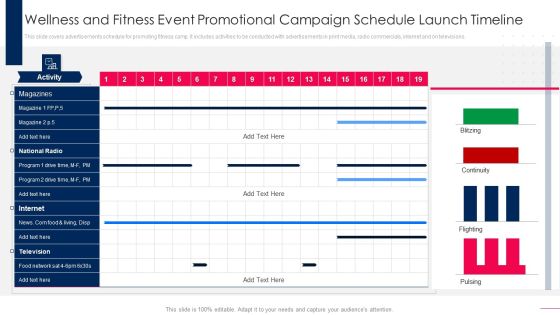
Wellness And Fitness Event Promotional Campaign Schedule Launch Timeline Formats PDF
This slide covers advertisements schedule for promoting fitness camp. It includes activities to be conducted with advertisements in print media, radio commercials, internet and on televisions. Pitch your topic with ease and precision using this Wellness And Fitness Event Promotional Campaign Schedule Launch Timeline Formats PDF. This layout presents information on Internet, National Radio. It is also available for immediate download and adjustment. So, changes can be made in the color, design, graphics or any other component to create a unique layout.
Marketing And Operation KPI Dashboard To Increase Efficiency Icons PDF
This slide covers sales and operations KPI dashboard to increase efficiency. It involves performance, increase in profit, target, monthly profit and quarterly revenue trend. Pitch your topic with ease and precision using this Marketing And Operation KPI Dashboard To Increase Efficiency Icons PDF. This layout presents information on Profit By Monthly, Target, Performance. It is also available for immediate download and adjustment. So, changes can be made in the color, design, graphics or any other component to create a unique layout.

Retail Store Marketing And Operations Dashboard Mockup PDF
This slide covers retail store sales and operation dashboard. It involves revenue by sales, number if customers, average transaction price, average units per consumer etc. Pitch your topic with ease and precision using this Retail Store Marketing And Operations Dashboard Mockup PDF. This layout presents information on Revenue By Sales, Customer, Average Transaction Price. It is also available for immediate download and adjustment. So, changes can be made in the color, design, graphics or any other component to create a unique layout.

Impact Of Personnel Workplace Conflict Stats Rules PDF
This slide illustrates the outcome of conflict among employees at workplace. It includes personal insults, absence, departmental arguments, bullying, resignations, terminations, project failure and change in departments.Pitch your topic with ease and precision using this Impact Of Personnel Workplace Conflict Stats Rules PDF. This layout presents information on Personal Attacks, Training Is Advantageous, Conflict Resolution. It is also available for immediate download and adjustment. So, changes can be made in the color, design, graphics or any other component to create a unique layout.

Packaging And Delivering Dashboard With Monthly Key Performance Metrics Microsoft PDF
The following slide showcases dashboard of supply chain with order status key metrics. Main KPIs covered are volume today, global financial performance and inventory. Pitch your topic with ease and precision using this Packaging And Delivering Dashboard With Monthly Key Performance Metrics Microsoft PDF. This layout presents information on Customer, Global Financial Performance, Inventory Distribution. It is also available for immediate download and adjustment. So, changes can be made in the color, design, graphics or any other component to create a unique layout.
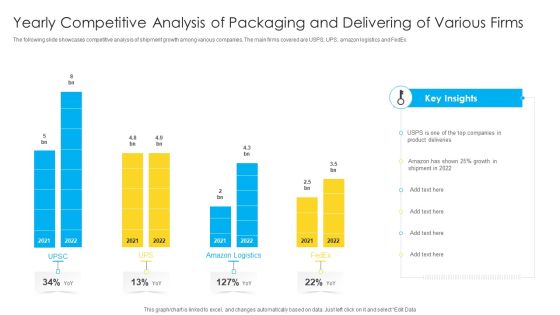
Yearly Competitive Analysis Of Packaging And Delivering Of Various Firms Professional PDF
The following slide showcases competitive analysis of shipment growth among various companies. The main firms covered are USPS, UPS, amazon logistics and FedEx. Pitch your topic with ease and precision using this Yearly Competitive Analysis Of Packaging And Delivering Of Various Firms Professional PDF. This layout presents information on Product Deliveries, Growth. It is also available for immediate download and adjustment. So, changes can be made in the color, design, graphics or any other component to create a unique layout.

Enterprise Marketing Activities KPI Dashboard To Track Performance Across Various Platforms Ideas PDF
This slide covers enterprise marketing dashboard to track performance across various platforms. It involves total insights connected, engagement from Facebook, twitter and Instagram.Pitch your topic with ease and precision using this Enterprise Marketing Activities KPI Dashboard To Track Performance Across Various Platforms Ideas PDF. This layout presents information on Instagram Engagement, Comments, Returning. It is also available for immediate download and adjustment. So, changes can be made in the color, design, graphics or any other component to create a unique layout.

Education Dashboard With Absenteeism And Grade Details Metrics Diagrams PDF
This slide covers dashboard for tracking causes and rates of student absenteeism. It also include metrics such as average grades by subject and department. Pitch your topic with ease and precision using this Education Dashboard With Absenteeism And Grade Details Metrics Diagrams PDF. This layout presents information on Grade Department, English Proficiency, Medical Abs. It is also available for immediate download and adjustment. So, changes can be made in the color, design, graphics or any other component to create a unique layout.
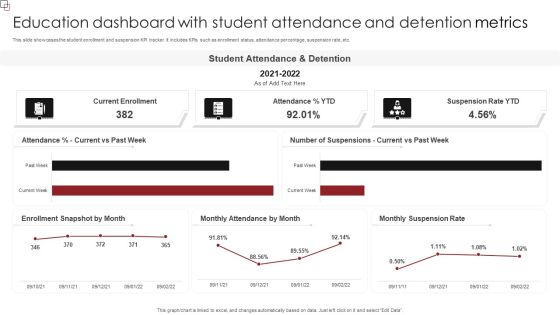
Education Dashboard With Student Attendance And Detention Metrics Inspiration PDF
This slide showcases the student enrollment and suspension KPI tracker. It includes KPIs such as enrollment status, attendance percentage, suspension rate, etc. Pitch your topic with ease and precision using this Education Dashboard With Student Attendance And Detention Metrics Inspiration PDF. This layout presents information on Student Attendance, Suspension Rate YTD, Current Enrollment. It is also available for immediate download and adjustment. So, changes can be made in the color, design, graphics or any other component to create a unique layout.
Training And Education Metrics Tracking Dashboard Guidelines PDF
This slide showcases dashboard for tracking training programs details. It include metrics such as training to invited percentage, unique trained, training man-days, total program names, etc. Pitch your topic with ease and precision using this Training And Education Metrics Tracking Dashboard Guidelines PDF. This layout presents information on Location Wise Training, Training Concerning Vertical, Tennessee. It is also available for immediate download and adjustment. So, changes can be made in the color, design, graphics or any other component to create a unique layout.
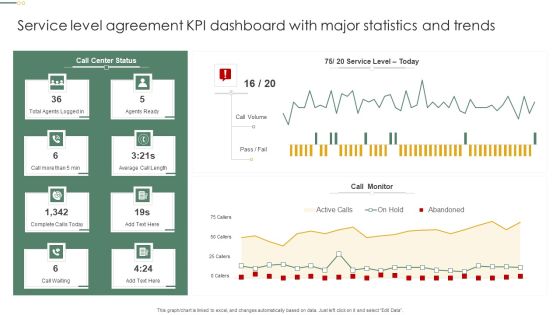
Service Level Agreement KPI Dashboard With Major Statistics And Trends Pictures PDF
This graph or chart is linked to excel, and changes automatically based on data. Just left click on it and select Edit Data. Pitch your topic with ease and precision using this Service Level Agreement KPI Dashboard With Major Statistics And Trends Pictures PDF. This layout presents information on Call Monitor, Call Volume, Agents Ready. It is also available for immediate download and adjustment. So, changes can be made in the color, design, graphics or any other component to create a unique layout.
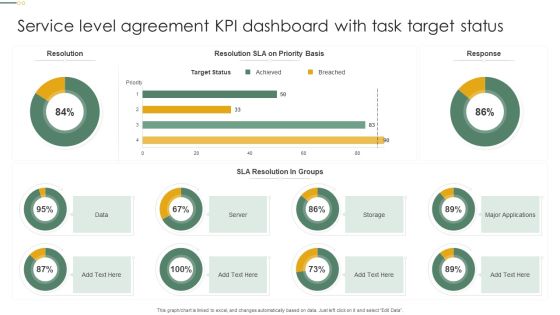
Service Level Agreement KPI Dashboard With Task Target Status Microsoft PDF
This graph or chart is linked to excel, and changes automatically based on data. Just left click on it and select Edit Data. Pitch your topic with ease and precision using this Service Level Agreement KPI Dashboard With Task Target Status Microsoft PDF. This layout presents information on Target Status, Sla Resolution, Groups, Server. It is also available for immediate download and adjustment. So, changes can be made in the color, design, graphics or any other component to create a unique layout.
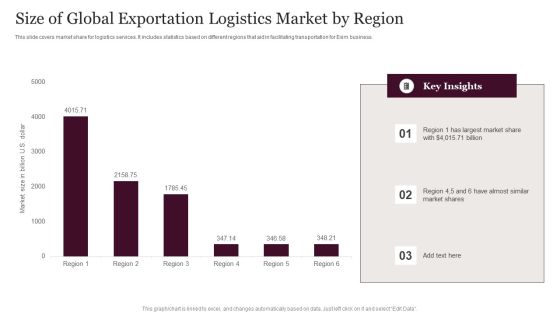
Size Of Global Exportation Logistics Market By Region Information PDF
This slide covers market share for logistics services. It includes statistics based on different regions that aid in facilitating transportation for Exim business. Pitch your topic with ease and precision using this Size Of Global Exportation Logistics Market By Region Information PDF. This layout presents information on Global Exportation Logistics, Market By Region. It is also available for immediate download and adjustment. So, changes can be made in the color, design, graphics or any other component to create a unique layout.

Yearly Staff Engagement Trend Statistics Demonstration PDF
This slide represents the line graph for analyzing employee engagement trend . It includes the statistics such as percentage of engaged and actively disengaged employees. Pitch your topic with ease and precision using this Yearly Staff Engagement Trend Statistics Demonstration PDF. This layout presents information on Team, Employees, Average. It is also available for immediate download and adjustment. So, changes can be made in the color, design, graphics or any other component to create a unique layout.

Team Distrust Barrier To Business Effective Communication Infographics PDF
The following slide showcases team distrust that affect workforce communication. Main problems faced by employee are that they dont receive clear instructions, inability to collaborate etc. Pitch your topic with ease and precision using this Team Distrust Barrier To Business Effective Communication Infographics PDF. This layout presents information on Team Distrust Barrier, Business Effective Communication. It is also available for immediate download and adjustment. So, changes can be made in the color, design, graphics or any other component to create a unique layout.

Increment In Social Media Engagement Through Campaign Metrics Professional PDF
This slide covers increment in social media engagement through campaign KPI which include lead break breakdown, online analytics of web traffic and key conversion metrics. Pitch your topic with ease and precision using this Increment In Social Media Engagement Through Campaign Metrics Professional PDF. This layout presents information on Quality, Key Conversion Metrics, Social Media. It is also available for immediate download and adjustment. So, changes can be made in the color, design, graphics or any other component to create a unique layout.

Opportunity Analysis Dashboard Indicating Business Performance Information Rules PDF
This slide shows opportunity analysis dashboard indicating market performance which contains opportunity count by size, sales stage, region, revenue and average revenue. Pitch your topic with ease and precision using this Opportunity Analysis Dashboard Indicating Business Performance Information Rules PDF. This layout presents information on Opportunity Count, Revenue, Sales. It is also available for immediate download and adjustment. So, changes can be made in the color, design, graphics or any other component to create a unique layout.

Electronics Production Annual Market Growth Graphics PDF
This slide contains the information related to the growth of electronic devices manufacturing in the market. Pitch your topic with ease and precision using this Electronics Production Annual Market Growth Graphics PDF. This layout presents information on hnology Advancements, Electronics Market, Demand. It is also available for immediate download and adjustment. So, changes can be made in the color, design, graphics or any other component to create a unique layout.
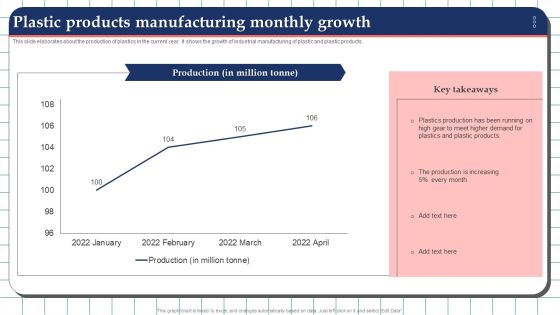
Plastic Products Manufacturing Monthly Growth Guidelines PDF
This slide elaborates about the production of plastics in the current year. It shows the growth of industrial manufacturing of plastic and plastic products. Pitch your topic with ease and precision using this Plastic Products Manufacturing Monthly Growth Guidelines PDF. This layout presents information on Production, Demand, Manufacturing Monthly Growth. It is also available for immediate download and adjustment. So, changes can be made in the color, design, graphics or any other component to create a unique layout.

Production Growth Of Green Building Materials By Product Formats PDF
This slide elaborates the manufacturing growth of green building materials over the last years with the product wise divisions. The product divisions include structural, interior, exterior, etc. Pitch your topic with ease and precision using this Production Growth Of Green Building Materials By Product Formats PDF. This layout presents information on Manufacturing, Materials, Global Crisis. It is also available for immediate download and adjustment. So, changes can be made in the color, design, graphics or any other component to create a unique layout.
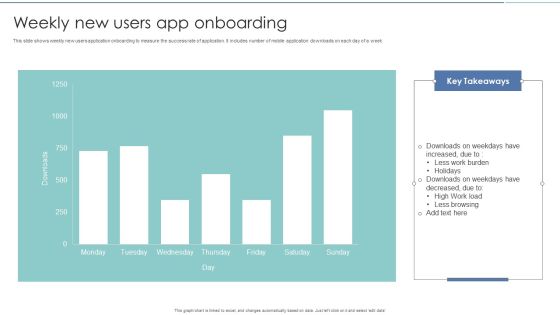
Weekly New Users App Onboarding Diagrams PDF
This slide shows weekly new users application onboarding to measure the success rate of application. It includes number of mobile application downloads on each day of a week. Pitch your topic with ease and precision using this Weekly New Users App Onboarding Diagrams PDF. This layout presents information on Weekly New Users, App Onboarding. It is also available for immediate download and adjustment. So, changes can be made in the color, design, graphics or any other component to create a unique layout.

Chart Illustrating Manufacturing Plant Energy Consumption Statistics Slides PDF
This graph or chart is linked to excel, and changes automatically based on data. Just left click on it and select edit data. Pitch your topic with ease and precision using this Chart Illustrating Manufacturing Plant Energy Consumption Statistics Slides PDF. This layout presents information on Equipment Inefficiency, Process Heating, Energy Export. It is also available for immediate download and adjustment. So, changes can be made in the color, design, graphics or any other component to create a unique layout.

CRM Software Dashboard For Sales Comparison Mockup PDF
This slide represents the sales dashboard of CRM software. It includes KPIs such as profit, number of sales and expenses incurred. Pitch your topic with ease and precision using this CRM Software Dashboard For Sales Comparison Mockup PDF. This layout presents information on Profit, Sales Dashboard, Expenses Incurred. It is also available for immediate download and adjustment. So, changes can be made in the color, design, graphics or any other component to create a unique layout.

Doughnut Graph Depicting ROI From Multiple Marketing Activities Rules PDF
This graph or chart is linked to excel, and changes automatically based on data. Just left click on it and select Edit Data. Pitch your topic with ease and precision using this Doughnut Graph Depicting ROI From Multiple Marketing Activities Rules PDF. This layout presents information on Total ROI, Field Campaigns, Print Media, Display Ads. It is also available for immediate download and adjustment. So, changes can be made in the color, design, graphics or any other component to create a unique layout.

Doughnut Graph With Online Employee Recruitment Via Multiple Portals Mockup PDF
This graph or chart is linked to excel, and changes automatically based on data. Just left click on it and select Edit Data. Pitch your topic with ease and precision using this Doughnut Graph With Online Employee Recruitment Via Multiple Portals Mockup PDF. This layout presents information on ABC Employment, Multiple Portals, 2020 To 2022. It is also available for immediate download and adjustment. So, changes can be made in the color, design, graphics or any other component to create a unique layout.
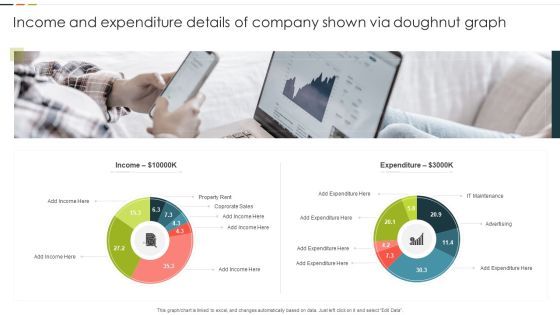
Income And Expenditure Details Of Company Shown Via Doughnut Graph Graphics PDF
This graph or chart is linked to excel, and changes automatically based on data. Just left click on it and select Edit Data. Pitch your topic with ease and precision using this Income And Expenditure Details Of Company Shown Via Doughnut Graph Graphics PDF. This layout presents information on Property Rent, Corporate Sales, Expenditure. It is also available for immediate download and adjustment. So, changes can be made in the color, design, graphics or any other component to create a unique layout.
Enterprise Saas Vendor Market Share And Earnings Growth Icons PDF
This slide covers saas vendors comparative market share report. It also includes percentage of total annual revenue growth. Pitch your topic with ease and precision using this Enterprise Saas Vendor Market Share And Earnings Growth Icons PDF. This layout presents information on Annual Growth, Market Share, Revenue. It is also available for immediate download and adjustment. So, changes can be made in the color, design, graphics or any other component to create a unique layout.
Five Years Sales Projection And Analysis Dashboard Icons PDF
This slide defines the dashboard for five years sales forecast and analysis . It includes information related to the estimated and actual sales. Pitch your topic with ease and precision using this Five Years Sales Projection And Analysis Dashboard Icons PDF. This layout presents information on Forecast Value, Forecast Accuracy, Won Opportunities. It is also available for immediate download and adjustment. So, changes can be made in the color, design, graphics or any other component to create a unique layout.

Media Company Quarterly Revenue Projection Dashboard Mockup PDF
This slide depicts estimation and actual revenue generated for a quarter. It also includes top ten customers, revenue by product and entity for media company. Pitch your topic with ease and precision using this Media Company Quarterly Revenue Projection Dashboard Mockup PDF. This layout presents information on Total Revenue, Quarterly Revenue Entity, Top 10 Customers. It is also available for immediate download and adjustment. So, changes can be made in the color, design, graphics or any other component to create a unique layout.

KPI Dashboard To Measure Strategic Monetary Performance Graphics PDF
This slide shows KPI dashboard to measure strategic monetary performance. It includes gross profit margin, opex ratio, operating profit margin, revenue, etc. Pitch your topic with ease and precision using this KPI Dashboard To Measure Strategic Monetary Performance Graphics PDF. This layout presents information on Gross Profit Margin, Opex Ratio, Operating Profit Margin. It is also available for immediate download and adjustment. So, changes can be made in the color, design, graphics or any other component to create a unique layout.
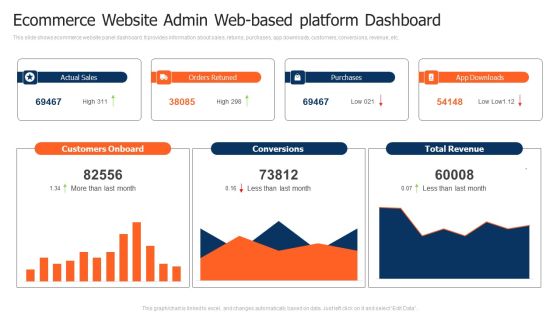
Ecommerce Website Admin Web Based Platform Dashboard Pictures PDF
This slide shows ecommerce website panel dashboard. It provides information about sales, returns, purchases, app downloads, customers, conversions, revenue, etc. Pitch your topic with ease and precision using this Ecommerce Website Admin Web Based Platform Dashboard Pictures PDF. This layout presents information on Customers Onboard, Purchases, Total Revenue. It is also available for immediate download and adjustment. So, changes can be made in the color, design, graphics or any other component to create a unique layout.
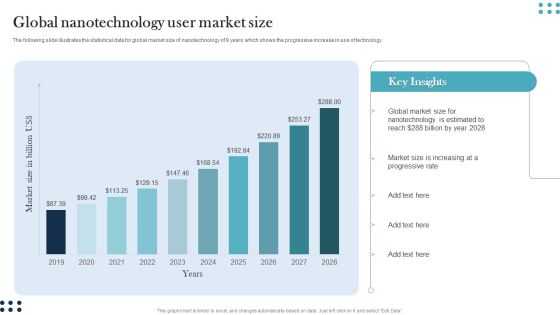
Global Nanotechnology User Market Size Guidelines PDF
The following slide illustrates the statistical data for global market size of nanotechnology of 9 years which shows the progressive increase in use of technology. Pitch your topic with ease and precision using this Global Nanotechnology User Market Size Guidelines PDF. This layout presents information on Global Market Size, Nanotechnology, Estimated To Reach. It is also available for immediate download and adjustment. So, changes can be made in the color, design, graphics or any other component to create a unique layout.

Carbon Emissions Of Countries Bar Graph Professional PDF
This slide depicts emissions chart of various countries to avoid the worst impacts of climate change. It includes countries and carbon emissions in million metric tons. Pitch your topic with ease and precision using this Carbon Emissions Of Countries Bar Graph Professional PDF. This layout presents information on Maximum Production, Consumer Goods, Carbon Emissions. It is also available for immediate download and adjustment. So, changes can be made in the color, design, graphics or any other component to create a unique layout.
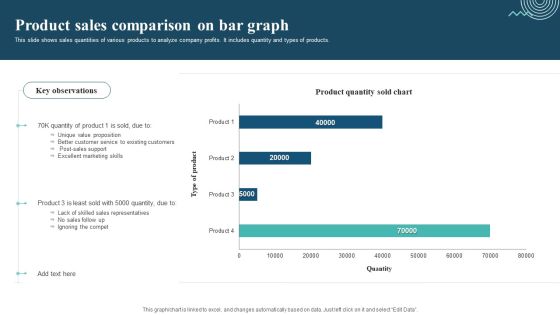
Product Sales Comparison On Bar Graph Sample PDF
This slide shows sales quantities of various products to analyze company profits. It includes quantity and types of products. Pitch your topic with ease and precision using this Product Sales Comparison On Bar Graph Sample PDF. This layout presents information on Unique Value Proposition, Excellent Marketing Skills, Ignoring The Compet. It is also available for immediate download and adjustment. So, changes can be made in the color, design, graphics or any other component to create a unique layout.
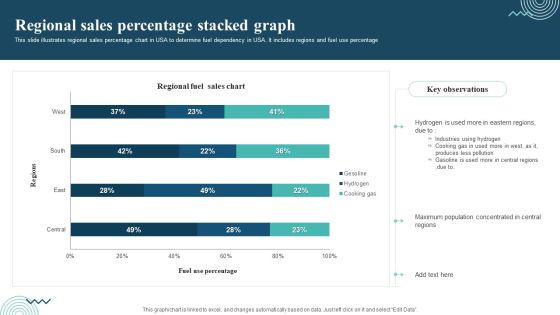
Regional Sales Percentage Stacked Graph Themes PDF
This slide illustrates regional sales percentage chart in USA to determine fuel dependency in USA. It includes regions and fuel use percentage. Pitch your topic with ease and precision using this Regional Sales Percentage Stacked Graph Themes PDF. This layout presents information on Regional Sales, Industries Using Hydrogen, Cooking Gas. It is also available for immediate download and adjustment. So, changes can be made in the color, design, graphics or any other component to create a unique layout.

Annual Customer Sales Performance Comparison Graph Portrait PDF
This slide shows the annual sales comparison chart. It also includes total and monthly sales target. Pitch your topic with ease and precision using this Annual Customer Sales Performance Comparison Graph Portrait PDF. This layout presents information on Total Sales Target, Sales Target, Achievement. It is also available for immediate download and adjustment. So, changes can be made in the color, design, graphics or any other component to create a unique layout.

KPI Dashboard Of Customer And Product Sales Performance Comparison Information PDF
This slide shows the KPI dashboard of client and product sales comparison. It also includes sales by location and total sales. Pitch your topic with ease and precision using this KPI Dashboard Of Customer And Product Sales Performance Comparison Information PDF. This layout presents information on Product Sales, Client Sales, Tim Santana. It is also available for immediate download and adjustment. So, changes can be made in the color, design, graphics or any other component to create a unique layout.
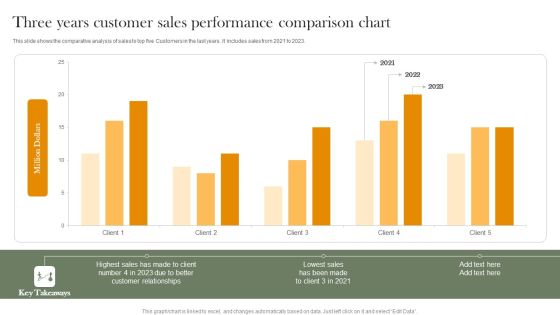
Three Years Customer Sales Performance Comparison Chart Professional PDF
This slide shows the comparative analysis of sales to top five Customers in the last years. It includes sales from 2021 to 2023. Pitch your topic with ease and precision using this Three Years Customer Sales Performance Comparison Chart Professional PDF. This layout presents information on Highest Sales, Customer Relationships, Lowest Sales. It is also available for immediate download and adjustment. So, changes can be made in the color, design, graphics or any other component to create a unique layout.

Target Market Assessment With Audience Demographics Inspiration PDF
This slide covers the dashboard for target audience analysis. It includes demographics based on gender, age, region, population density, household structure, and income. Pitch your topic with ease and precision using this Target Market Assessment With Audience Demographics Inspiration PDF. This layout presents information on Target Market Assessment, Audience Demographics . It is also available for immediate download and adjustment. So, changes can be made in the color, design, graphics or any other component to create a unique layout.
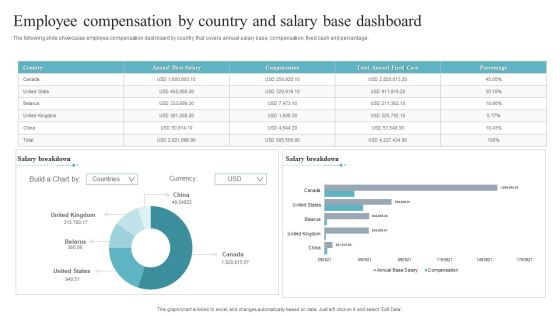
Employee Compensation By Country And Salary Base Dashboard Mockup PDF
The following slide showcases employee compensation dashboard by country that covers annual salary base, compensation, fixed cash and percentage. Pitch your topic with ease and precision using this Employee Compensation By Country And Salary Base Dashboard Mockup PDF. This layout presents information on Employee Compensation, Country Salary Base Dashboard. It is also available for immediate download and adjustment. So, changes can be made in the color, design, graphics or any other component to create a unique layout.


 Continue with Email
 Sign up for an account
 Home
Home


