Finance Executive Summary
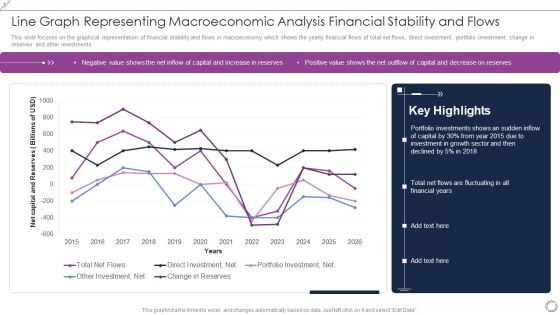
Line Graph Representing Macroeconomic Analysis Financial Stability And Flows Rules PDF
This slide focuses on the graphical representation of financial stability and flows in macroeconomy which shows the yearly financial flows of total net flows, direct investment, portfolio investment, change in reserves and other investments. Showcasing this set of slides titled Line Graph Representing Macroeconomic Analysis Financial Stability And Flows Rules PDF. The topics addressed in these templates are Total Net Flows, Direct Investment, Net, Portfolio Investment, Net. All the content presented in this PPT design is completely editable. Download it and make adjustments in color, background, font etc. as per your unique business setting.

Core Components Of Strategic Brand Administration Brand Asset Valuator Power Template PDF
This slide provides information regarding brand asset valuator power grid to analyze overall brand health. It caters details about new, unfocused, eroding, power, declining or niche brands. Find a pre-designed and impeccable Core Components Of Strategic Brand Administration Brand Asset Valuator Power Template PDF. The templates can ace your presentation without additional effort. You can download these easy-to-edit presentation templates to make your presentation stand out from others. So, what are you waiting for Download the template from Slidegeeks today and give a unique touch to your presentation.

Buzz Marketing Strategies To Expand Campaign Reach Analyzing Impact Of Viral Marketing Strategies Template PDF
The following slide shows assessing affect of viral marketing techniques. It provides details about TikTok, Pinterest, Reddit, Facebook, Twitter, Instagram, virality coefficient, follower growth, user generated content, benefits, etc. Find a pre designed and impeccable Buzz Marketing Strategies To Expand Campaign Reach Analyzing Impact Of Viral Marketing Strategies Template PDF. The templates can ace your presentation without additional effort. You can download these easy to edit presentation templates to make your presentation stand out from others. So, what are you waiting for Download the template from Slidegeeks today and give a unique touch to your presentation.
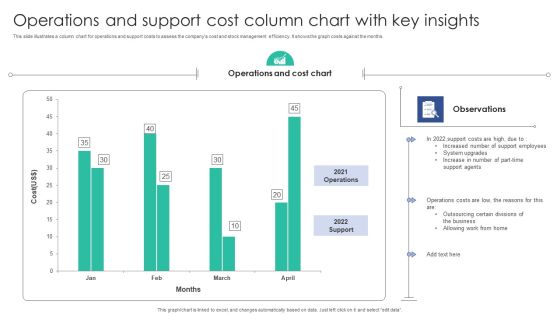
Operations And Support Cost Column Chart With Key Insights Background PDF
This slide illustrates a column chart for operations and support costs to assess the companys cost and stock management efficiency. It shows the graph costs against the months.Showcasing this set of slides titled Operations And Support Cost Column Chart With Key Insights Background PDF. The topics addressed in these templates are Operations Cost, Support Agents, Support Employees. All the content presented in this PPT design is completely editable. Download it and make adjustments in color, background, font etc. as per your unique business setting.
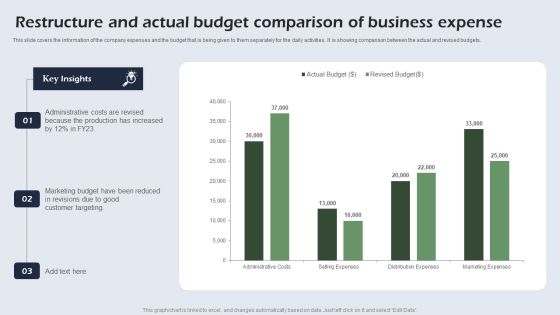
Restructure And Actual Budget Comparison Of Business Expense Portrait PDF
This slide covers the information of the company expenses and the budget that is being given to them separately for the daily activities. It is showing comparison between the actual and revised budgets. Showcasing this set of slides titled Restructure And Actual Budget Comparison Of Business Expense Portrait PDF. The topics addressed in these templates are Administrative Costs, Marketing Budget, Customer Targeting. All the content presented in this PPT design is completely editable. Download it and make adjustments in color, background, font etc. as per your unique business setting.

Post Budget Analysis Of Business Event Elements PDF
This slide showcases analysis of budget that can help to evaluate the actual vs estimated expenses incurred during the conduction of corporate event. Its key components are event name, event date, visual analysis of budget and cost breakup. Showcasing this set of slides titled Post Budget Analysis Of Business Event Elements PDF. The topics addressed in these templates are Marketing, Visual Analysis, Team Building Event. All the content presented in this PPT design is completely editable. Download it and make adjustments in color, background, font etc. as per your unique business setting.

Employee Recruitment Analysis KPI Dashboard Slides PDF
The following slide presents a hiring assessment dashboard to manage HR metrics. It includes KPIs such as average time taken, cost required in hiring process along with the major sources of recruitment etc. Pitch your topic with ease and precision using this Employee Recruitment Analysis KPI Dashboard Slides PDF. This layout presents information on Agile Hiring, Non Agile Hiring, Hiring Cost Assessment. It is also available for immediate download and adjustment. So, changes can be made in the color, design, graphics or any other component to create a unique layout.

Smarketing Alignment Technologies Used By Business Ppt Show Visual Aids PDF
This slide shows various technologies used by business which can be used in sales and marketing alignment. It includes digital asset management, content calendar artificial intelligence, etc. Showcasing this set of slides titled Smarketing Alignment Technologies Used By Business Ppt Show Visual Aids PDF. The topics addressed in these templates are Email Marketing, Sales Enablement Platform, Content Management. All the content presented in this PPT design is completely editable. Download it and make adjustments in color, background, font etc. as per your unique business setting.

Dashboard For Successful FSM System Ppt Visual Aids Infographics PDF
Showcasing this set of slides titled dashboard for successful fsm system ppt visual aids infographics pdf. The topics addressed in these templates are resource percentage, duration compliance, priority. All the content presented in this PPT design is completely editable. Download it and make adjustments in color, background, font etc. as per your unique business setting.

Comprehensive Guide To Acquire Customers Average Customer Acquisition Cost By Industry Clipart PDF
This slide covers a graphical representation of client acquisition costs incurred by various industries such as travel, retail, consumer goods, manufacturing, transportation, marketing agency, financial, real estate, banking, telecom, and technology hardware and software.Get a simple yet stunning designed Comprehensive Guide To Acquire Customers Average Customer Acquisition Cost By Industry Clipart PDF. It is the best one to establish the tone in your meetings. It is an excellent way to make your presentations highly effective. So, download this PPT today from Slidegeeks and see the positive impacts. Our easy-to-edit Comprehensive Guide To Acquire Customers Average Customer Acquisition Cost By Industry Clipart PDF can be your go-to option for all upcoming conferences and meetings. So, what are you waiting for Grab this template today.

Colorful Business Concepts Model PowerPoint Templates Ppt Backgrounds For Slides 0713
Touch base with our Colorful Business Concepts Model PowerPoint Templates PPT Backgrounds For Slides. Review your growth with your audience. Take a deep dive with our Leadership PowerPoint Templates. Get into the nitty-gritty of it all. Plan your storyboard with our Cubes PowerPoint Templates. Give an outline to the solutions you have.

3d Men With Their Mentors PowerPoint Templates Ppt Backgrounds For Slides 0713
Touch base with our 3d Men With Their Mentors PowerPoint Templates PPT Backgrounds For Slides. Review your growth with your audience. Take a deep dive with our Education PowerPoint Templates. Get into the nitty-gritty of it all. Plan your storyboard with our Business PowerPoint Templates. Give an outline to the solutions you have.

Strategic Ecommerce Plan For B2B Enterprises Share Of B2b Buyers Purchase From Social Media And Metaverse Topics PDF
This slide represents share of B2b buyers making purchase due to social media and metaverse. It covers social media ads, live demonstration, video posts etc. Presenting this PowerPoint presentation, titled Strategic Ecommerce Plan For B2B Enterprises Share Of B2b Buyers Purchase From Social Media And Metaverse Topics PDF, with topics curated by our researchers after extensive research. This editable presentation is available for immediate download and provides attractive features when used. Download now and captivate your audience. Presenting this Strategic Ecommerce Plan For B2B Enterprises Share Of B2b Buyers Purchase From Social Media And Metaverse Topics PDF. Our researchers have carefully researched and created these slides with all aspects taken into consideration. This is a completely customizable Strategic Ecommerce Plan For B2B Enterprises Share Of B2b Buyers Purchase From Social Media And Metaverse Topics PDF that is available for immediate downloading. Download now and make an impact on your audience. Highlight the attractive features available with our PPTs.

Marketing Budgetary Trends Comparison Pre And Post COVID 19 Background PDF
This slide shows investment by marketers in different areas. Some are hoping increase in the areas others are not willing to invest more due to uncertainty.Pitch your topic with ease and precision using this Marketing Budgetary Trends Comparison Pre And Post COVID 19 Background PDF. This layout presents information on Content Marketing, Influencer Marketing, Content Marketing. It is also available for immediate download and adjustment. So, changes can be made in the color, design, graphics or any other component to create a unique layout.
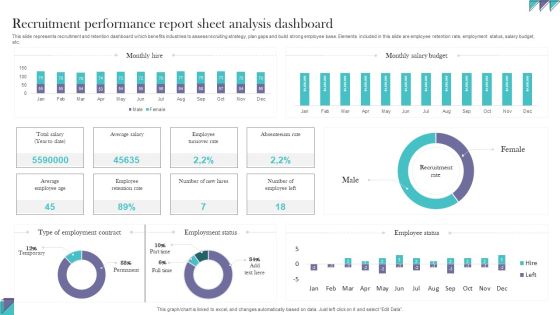
Recruitment Performance Report Sheet Analysis Dashboard Information PDF
This slide represents recruitment and retention dashboard which benefits industries to assess recruiting strategy, plan gaps and build strong employee base. Elements included in this slide are employee retention rate, employment status, salary budget, etc. Pitch your topic with ease and precision using this Recruitment Performance Report Sheet Analysis Dashboard Information PDF. This layout presents information onRecruitment Performance, Report Sheet Analysis. It is also available for immediate download and adjustment. So, changes can be made in the color, design, graphics or any other component to create a unique layout.

Search Engine Optimization Services Dashboard With Google Ranking Ppt Gallery Demonstration PDF
This slide covers the different SEO services and the impact of them on the business. It includes the number of website visitors, Google ranking , site audit score, audience growth graph and many more things. Pitch your topic with ease and precision using this Search Engine Optimization Services Dashboard With Google Ranking Ppt Gallery Demonstration PDF. This layout presents information on Audience Growth Paid, Adwords Conversions Score. It is also available for immediate download and adjustment. So, changes can be made in the color, design, graphics or any other component to create a unique layout.
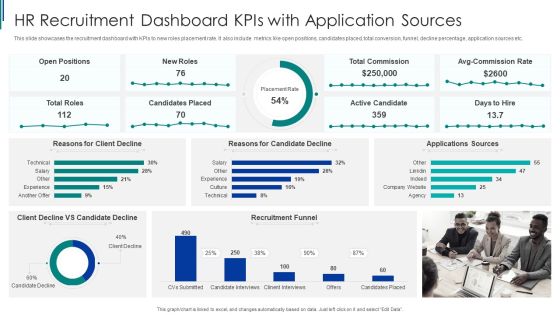
HR Recruitment Dashboard Kpis With Application Sources Ppt Pictures Styles PDF
This slide showcases the recruitment dashboard with KPIs to new roles placement rate. It also include metrics like open positions, candidates placed, total conversion, funnel, decline percentage, application sources etc. Pitch your topic with ease and precision using this HR Recruitment Dashboard Kpis With Application Sources Ppt Pictures Styles PDF. This layout presents information on Recruitment Funnel, HR Recruitment, Dashboard Kpis. It is also available for immediate download and adjustment. So, changes can be made in the color, design, graphics or any other component to create a unique layout.

HR Recruitment Dashboard Kpis With Hires Per Month Ppt Slides Portfolio PDF
This slide showcases the recruitment dashboard of KPIs to know hiring from different sources. It include metrics like hires by department, per month, candidate feedback, offer acceptance rate, interview activity. Pitch your topic with ease and precision using this HR Recruitment Dashboard Kpis With Hires Per Month Ppt Slides Portfolio PDF. This layout presents information on HR Recruitment, Dashboard Kpis, Business Development. It is also available for immediate download and adjustment. So, changes can be made in the color, design, graphics or any other component to create a unique layout.
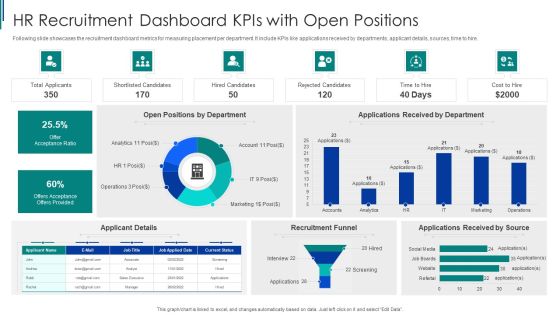
HR Recruitment Dashboard Kpis With Open Positions Ppt Model Good PDF
Following slide showcases the recruitment dashboard metrics for measuring placement per department. It include KPIs like applications received by departments, applicant details, sources, time to hire. Pitch your topic with ease and precision using this HR Recruitment Dashboard Kpis With Open Positions Ppt Model Good PDF. This layout presents information on Offer Acceptance Ratio, Recruitment Funnel, Applicant Details. It is also available for immediate download and adjustment. So, changes can be made in the color, design, graphics or any other component to create a unique layout.
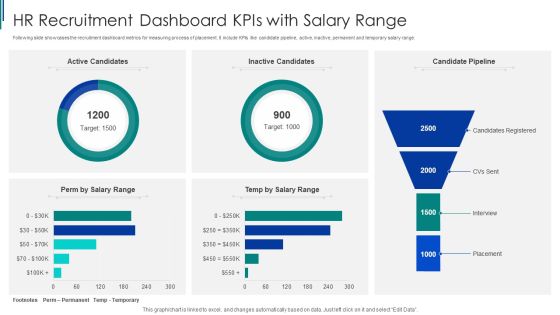
HR Recruitment Dashboard Kpis With Salary Range Ppt Inspiration Rules PDF
Following slide showcases the recruitment dashboard metrics for measuring process of placement. It include KPIs like candidate pipeline, active, inactive, permanent and temporary salary range. Pitch your topic with ease and precision using this HR Recruitment Dashboard Kpis With Salary Range Ppt Inspiration Rules PDF. This layout presents information on HR Recruitment, Dashboard Kpis, Salary Range. It is also available for immediate download and adjustment. So, changes can be made in the color, design, graphics or any other component to create a unique layout.
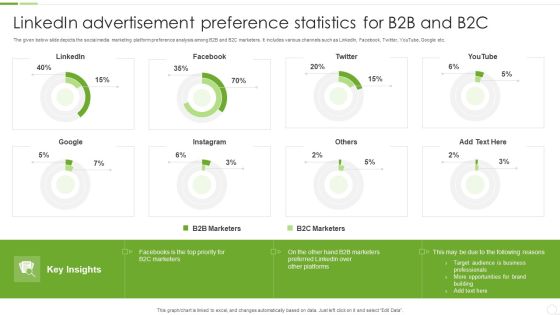
Linkedin Advertisement Preference Statistics For B2B And B2C Ppt Visual Aids Professional PDF
The given below slide depicts the social media marketing platform preference analysis among B2B and B2C marketers. It includes various channels such as LinkedIn, Facebook, Twitter, YouTube, Google etc. Pitch your topic with ease and precision using this Linkedin Advertisement Preference Statistics For B2B And B2C Ppt Visual Aids Professional PDF. This layout presents information on B2B Marketers, B2C Marketers, Target Audience. It is also available for immediate download and adjustment. So, changes can be made in the color, design, graphics or any other component to create a unique layout.

Client Helpline Dashboard At Valet Information Dsk Ppt Gallery Slide Portrait PDF
This graph or chart is linked to excel, and changes automatically based on data. Just left click on it and select Edit Data. Pitch your topic with ease and precision using this Client Helpline Dashboard At Valet Information Dsk Ppt Gallery Slide Portrait PDF. This layout presents information on Valet Damage Claims, Valet Wait Times, Information Desk. It is also available for immediate download and adjustment. So, changes can be made in the color, design, graphics or any other component to create a unique layout.

Firm KPI Dashboard With Average Click Through Rate Ppt Inspiration Sample PDF
This graph or chart is linked to excel, and changes automatically based on data. Just left click on it and select Edit Data. Pitch your topic with ease and precision using this Firm KPI Dashboard With Average Click Through Rate Ppt Inspiration Sample PDF. This layout presents information on Total Clicks, Total Impressive, Average CTR, Average Position. It is also available for immediate download and adjustment. So, changes can be made in the color, design, graphics or any other component to create a unique layout.
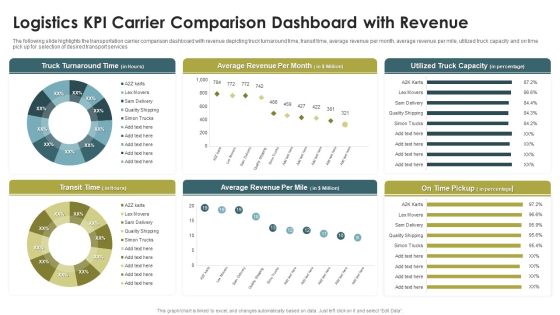
Logistics KPI Carrier Comparison Dashboard With Revenue Ppt Infographics Portfolio PDF
The following slide highlights the transportation carrier comparison dashboard with revenue depicting truck turnaround time, transit time, average revenue per month, average revenue per mile, utilized truck capacity and on time pick up for selection of desired transport services. Pitch your topic with ease and precision using this Logistics KPI Carrier Comparison Dashboard With Revenue Ppt Infographics Portfolio PDF. This layout presents information on Truck Turnaround Time, Average Revenue, Per Month, Transit Time. It is also available for immediate download and adjustment. So, changes can be made in the color, design, graphics or any other component to create a unique layout.
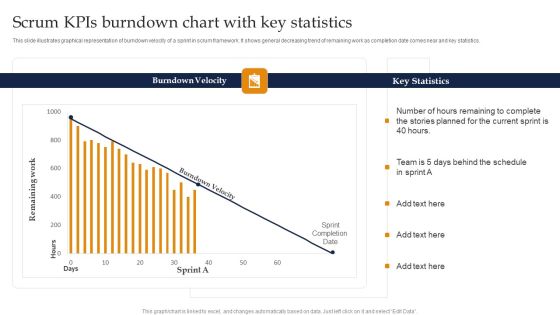
Scrum Kpis Burndown Chart With Key Statistics Ppt Pictures Visual Aids PDF
This slide illustrates graphical representation of burndown velocity of a sprint in scrum framework. It shows general decreasing trend of remaining work as completion date comes near and key statistics. Pitch your topic with ease and precision using this Scrum Kpis Burndown Chart With Key Statistics Ppt Pictures Visual Aids PDF. This layout presents information on Burndown Velocity, Key Statistics, Current Sprint. It is also available for immediate download and adjustment. So, changes can be made in the color, design, graphics or any other component to create a unique layout.
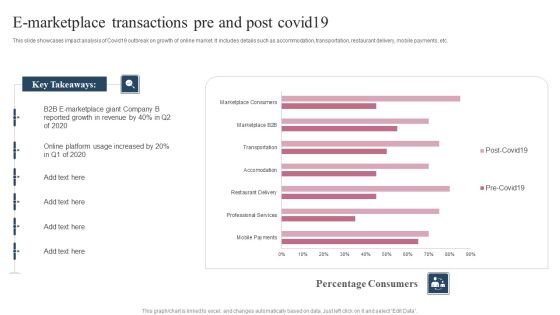
E Marketplace Transactions Pre And Post Covid19 Ppt Pictures Files PDF
This slide showcases impact analysis of Covid19 outbreak on growth of online market. It includes details such as accommodation, transportation, restaurant delivery, mobile payments, etc. Pitch your topic with ease and precision using this E Marketplace Transactions Pre And Post Covid19 Ppt Pictures Files PDF. This layout presents information on Key Takeaways, B2B E Marketplace, Online Platform. It is also available for immediate download and adjustment. So, changes can be made in the color, design, graphics or any other component to create a unique layout.
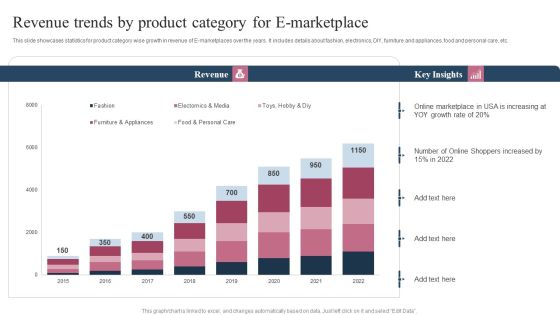
Revenue Trends By Product Category For E Marketplace Ppt Pictures Slide Portrait PDF
This slide showcases statistics for product category wise growth in revenue of E-marketplaces over the years. It includes details about fashion, electronics, DIY, furniture and appliances, food and personal care, etc. Pitch your topic with ease and precision using this Revenue Trends By Product Category For E Marketplace Ppt Pictures Slide Portrait PDF. This layout presents information on Revenue, Online Marketplace, Number Online, Shoppers Increased, 2015 To 2022. It is also available for immediate download and adjustment. So, changes can be made in the color, design, graphics or any other component to create a unique layout.

Video Promotion Techniques To Enhance Customer Engagement Rate Ppt Portfolio Images PDF
This slide signifies the key statistics on video promotion techniques to increase customer engagement rate. It covers information regarding to Twitter, Facebook, YouTube, Instagram and Snapchat. Pitch your topic with ease and precision using this Video Promotion Techniques To Enhance Customer Engagement Rate Ppt Portfolio Images PDF. This layout presents information on Facebook, Snapchat, Instagram, YouTube. It is also available for immediate download and adjustment. So, changes can be made in the color, design, graphics or any other component to create a unique layout.

Customer Behavior Analytics Dashboard To Improve Satisfaction Ppt File Infographics PDF
The following slide provides an insight of websites performance that includes date parameters. The dashboard includes sessions, users, pageviews, bounce rate and percentage of new sessions. Pitch your topic with ease and precision using this Customer Behavior Analytics Dashboard To Improve Satisfaction Ppt File Infographics PDF. This layout presents information on Session, Avg Session Duration, Bounce Rate. It is also available for immediate download and adjustment. So, changes can be made in the color, design, graphics or any other component to create a unique layout.

Customer Client Referral Program Performance Dashboard Ppt File Visual Aids PDF
This slide covers customer referral program performance evaluating dashboard. It involves participation rate by referrals, number of referred customers, conversion rate and total revenue generated. Pitch your topic with ease and precision using this Customer Client Referral Program Performance Dashboard Ppt File Visual Aids PDF. This layout presents information on Participation Rate Referrals, Number Referred Customers, Referral Conversion Rate. It is also available for immediate download and adjustment. So, changes can be made in the color, design, graphics or any other component to create a unique layout.

Employee Risk Key Performance Indicator Dashboard With Case Incident Rate Ppt Professional Information PDF
The following slide highlights the employee safety key performance indicator dashboard with case incident rate illustrating total case occurrence rate, last reported case, days without reported, causing items, corrective actions, incident pyramid, incident by month and major causes. Pitch your topic with ease and precision using this Employee Risk Key Performance Indicator Dashboard With Case Incident Rate Ppt Professional Information PDF. This layout presents information on Total Case, Incident Rate, Last Incident Reported, Incident Causing Items. It is also available for immediate download and adjustment. So, changes can be made in the color, design, graphics or any other component to create a unique layout.

3 Vendor Comparison Based On Survey Results Ppt Ideas Graphic Tips PDF
The following slide showcases rank of supplier comparison on the basis of responses obtained from customers. The comparison parameters covered are responsiveness, customer service and focus, reputation, knowledge, on time delivery, service and product quality. Pitch your topic with ease and precision using this 3 Vendor Comparison Based On Survey Results Ppt Ideas Graphic Tips PDF. This layout presents information on Survey Results, Key Insights, Parameters. It is also available for immediate download and adjustment. So, changes can be made in the color, design, graphics or any other component to create a unique layout.
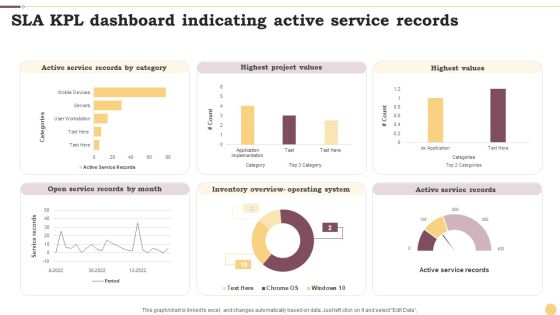
SLA KPL Dashboard Indicating Active Service Records Ppt Professional Graphics Example PDF
This graph or chart is linked to excel, and changes automatically based on data. Just left click on it and select Edit Data. Pitch your topic with ease and precision using this SLA KPL Dashboard Indicating Active Service Records Ppt Professional Graphics Example PDF. This layout presents information on Active Service Records, Highest Project Values, Highest Values. It is also available for immediate download and adjustment. So, changes can be made in the color, design, graphics or any other component to create a unique layout.

Customer Service KPI Dashboard For Technical Support Ppt Model Vector PDF
This slide covers customer service KPI dashboard for technical support. It involves details such as total number of issues arise daily, overall average response time, number of issues by channel and top performing technical engineers. Pitch your topic with ease and precision using this Customer Service KPI Dashboard For Technical Support Ppt Model Vector PDF. This layout presents information on Overall Average, Response Time, Total Number, Issues Arise Daily. It is also available for immediate download and adjustment. So, changes can be made in the color, design, graphics or any other component to create a unique layout.
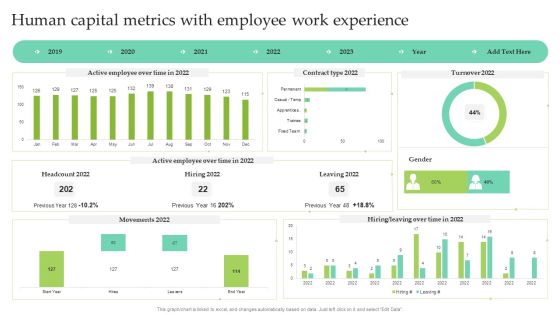
Human Capital Metrics With Employee Work Experience Ppt Show Images PDF
This graph or chart is linked to excel, and changes automatically based on data. Just left click on it and select Edit Data. Pitch your topic with ease and precision using this Human Capital Metrics With Employee Work Experience Ppt Show Images PDF. This layout presents information on Active Employee, Over Time, Contract Type 2022, Leaving 2022. It is also available for immediate download and adjustment. So, changes can be made in the color, design, graphics or any other component to create a unique layout.

Construction Industry Market Share Chart Comparison Of Big Players Ppt Portfolio Shapes PDF
This slide shows the year over year market share comparison of major construction firms. It also illustrates that market share of brand B has increased by slight margin. Pitch your topic with ease and precision using this Construction Industry Market Share Chart Comparison Of Big Players Ppt Portfolio Shapes PDF. This layout presents information on Market Share Percentage, 2022 To 2023, Market Share. It is also available for immediate download and adjustment. So, changes can be made in the color, design, graphics or any other component to create a unique layout.

Usage Trend Chart Of Skincare Product Market Ppt Slides Graphics Download PDF
This slide shows market trend graph of skincare product usage in four quarters. It also indicates that product A is most preferred by the customers. Pitch your topic with ease and precision using this Usage Trend Chart Of Skincare Product Market Ppt Slides Graphics Download PDF. This layout presents information on Trend Product, Skincare Product, Quarter Due. It is also available for immediate download and adjustment. So, changes can be made in the color, design, graphics or any other component to create a unique layout.

Customer NPS Metric Dashboard For Call Centers Ppt Inspiration Smartart PDF
This slide shows net promoter score dashboard for call centers which contains occupancy rate, tickets unassigned, opened tickets, completed tickets and raised tickets. It also has details on resolution rate on first call, enquiries, etc. Pitch your topic with ease and precision using this Customer NPS Metric Dashboard For Call Centers Ppt Inspiration Smartart PDF. This layout presents information on Occupancy Rate, Resolution Rate, Net Promoter Score. It is also available for immediate download and adjustment. So, changes can be made in the color, design, graphics or any other component to create a unique layout.
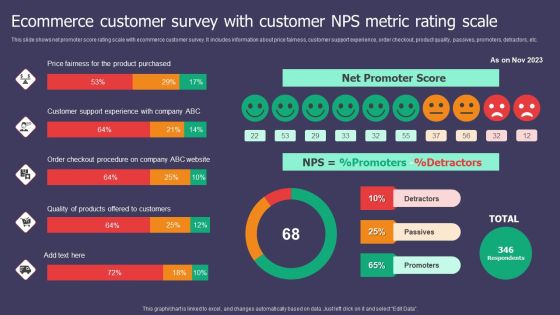
Ecommerce Customer Survey With Customer NPS Metric Rating Scale Ppt Inspiration Visual Aids PDF
This slide shows net promoter score rating scale with ecommerce customer survey. It includes information about price fairness, customer support experience, order checkout, product quality, passives, promoters, detractors, etc. Pitch your topic with ease and precision using this Ecommerce Customer Survey With Customer NPS Metric Rating Scale Ppt Inspiration Visual Aids PDF. This layout presents information on Net Promoter Score, Price Fairness, Product Purchased. It is also available for immediate download and adjustment. So, changes can be made in the color, design, graphics or any other component to create a unique layout.

Sales Performance Monitoring Dashboard With Customer Details Ppt Infographics Themes PDF
This slide illustrates sales performance tracking dashboard with critical information. It provides information about customer details, invoice, earnings, leads, pending delivery, revenue, etc. Pitch your topic with ease and precision using this Sales Performance Monitoring Dashboard With Customer Details Ppt Infographics Themes PDF. This layout presents information on Todays Revenue, Today Delivered, Pending Delivery, Total Leads. It is also available for immediate download and adjustment. So, changes can be made in the color, design, graphics or any other component to create a unique layout.

Brand Equity Valuation Of Top 10 IT Companies Ppt Portfolio Rules PDF
This slide showcase top 10 information technology companies brand value comparison chart understanding their position in market. It includes elements such as companies name, brand value, and key insights. Pitch your topic with ease and precision using this Brand Equity Valuation Of Top 10 IT Companies Ppt Portfolio Rules PDF. This layout presents information on Highest Market Value, Total Value, Brand Valuation. It is also available for immediate download and adjustment. So, changes can be made in the color, design, graphics or any other component to create a unique layout.
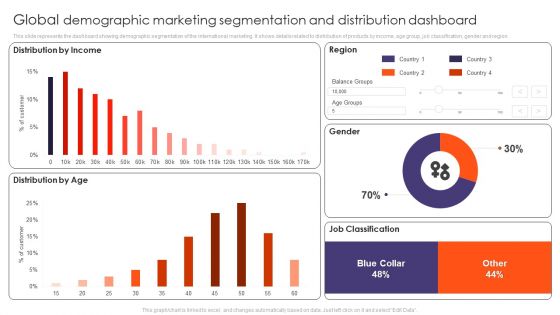
Global Demographic Marketing Segmentation And Distribution Dashboard Ppt Gallery Tips PDF
This slide represents the dashboard showing demographic segmentation of the international marketing. It shows details related to distribution of products by income, age group, job classification, gender and region. Pitch your topic with ease and precision using this Global Demographic Marketing Segmentation And Distribution Dashboard Ppt Gallery Tips PDF. This layout presents information on Distribution Income, Distribution Age, Region, Gender, Job Classification. It is also available for immediate download and adjustment. So, changes can be made in the color, design, graphics or any other component to create a unique layout.
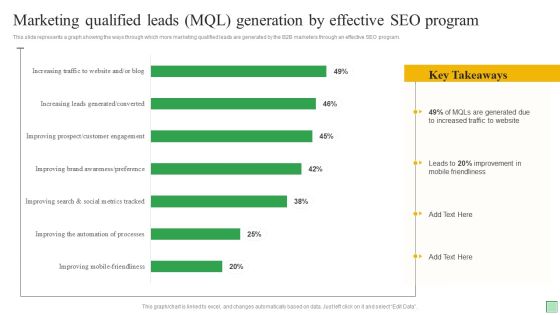
Marketing Qualified Leads MQL Generation By Effective SEO Program Ppt Slides Example Topics PDF
This slide represents a graph showing the ways through which more marketing qualified leads are generated by the B2B marketers through an effective SEO program. Pitch your topic with ease and precision using this Marketing Qualified Leads MQL Generation By Effective SEO Program Ppt Slides Example Topics PDF. This layout presents information on Mobile Friendliness, Due To Increased, Traffic To Website. It is also available for immediate download and adjustment. So, changes can be made in the color, design, graphics or any other component to create a unique layout.

Digital And Offline Marketing Campaign Comparison Dashboard Ppt Inspiration Microsoft PDF
This slide showcases analysis of offline and online marketing in a dashboard covering key metrics. Performance indicators involved are purchases, free trial pay up rate and sign ups and monthly visitors. Pitch your topic with ease and precision using this Digital And Offline Marketing Campaign Comparison Dashboard Ppt Inspiration Microsoft PDF. This layout presents information on Online Marketing, Offline Marketing, Free Trial Sign, UPS. It is also available for immediate download and adjustment. So, changes can be made in the color, design, graphics or any other component to create a unique layout.
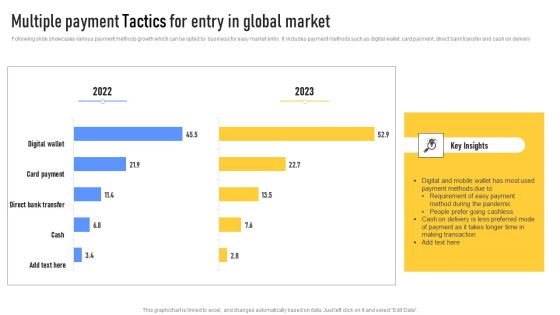
Multiple Payment Tactics For Entry In Global Market Mockup PDF
Following slide showcases various payment methods growth which can be opted by business for easy market entry. It includes payment methods such as digital wallet, card payment, direct bank transfer and cash on delivery. Showcasing this set of slides titled Multiple Payment Tactics For Entry In Global Market Mockup PDF. The topics addressed in these templates are Digital Wallet, Card Payment, Direct Bank Transfer, Cash On Delivery. All the content presented in this PPT design is completely editable. Download it and make adjustments in color, background, font etc. as per your unique business setting.
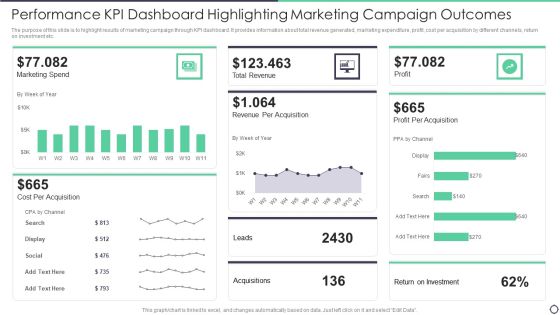
Performance Kpi Dashboard Highlighting Marketing Campaign Outcomes Topics PDF
The purpose of this slide is to highlight results of marketing campaign through KPI dashboard. It provides information about total revenue generated, marketing expenditure, profit, cost per acquisition by different channels, return on investment etc. Pitch your topic with ease and precision using this Performance Kpi Dashboard Highlighting Marketing Campaign Outcomes Topics PDF. This layout presents information on Cost, Marketing, Revenue. It is also available for immediate download and adjustment. So, changes can be made in the color, design, graphics or any other component to create a unique layout.

KPI Dashboard To Track Sales And Operations Process Of Manufacturing Enterprise Brochure PDF
This slide depicts a dashboard to track the key performance metrics in sales and operations process of a manufacturing enterprise to analyze deviations in the actual and planned output. The key performing indicators are percentage deviation, dollar deviation, inventory in hand etc.Pitch your topic with ease and precision using this KPI Dashboard To Track Sales And Operations Process Of Manufacturing Enterprise Brochure PDF. This layout presents information on Planned Output, Yearly Growth, Inventory Hand. It is also available for immediate download and adjustment. So, changes can be made in the color, design, graphics or any other component to create a unique layout.

Dashboard Of Shipment Logistics KPI With Operating Cost Ppt Styles Example Topics PDF
The following slide highlights dashboard of shipment transportation with operating cost illustrating transportation operating cost, monthly order completion rate, operating cost distribution, order completion trend, transportation by destination and transportation efficiency. Showcasing this set of slides titled Dashboard Of Shipment Logistics KPI With Operating Cost Ppt Styles Example Topics PDF. The topics addressed in these templates are Transportation Operating Cost, Monthly Order, Completion Rate, Operating Cost Distribution. All the content presented in this PPT design is completely editable. Download it and make adjustments in color, background, font etc. as per your unique business setting.

Key Challenges In Customers Segmentation Ppt File Deck PDF
This slides highlights key challenges faced by business during segmenting customers. It provides insights about challenges such as data management, data quality, emerging segmentation in business, selecting appropriate segments, keeping segments precise and cost. Slidegeeks is one of the best resources for PowerPoint templates. You can download easily and regulate Key Challenges In Customers Segmentation Ppt File Deck PDF for your personal presentations from our wonderful collection. A few clicks is all it takes to discover and get the most relevant and appropriate templates. Use our Templates to add a unique zing and appeal to your presentation and meetings. All the slides are easy to edit and you can use them even for advertisement purposes.

Comparative Analysis Of Budgeted And Actual Sales Ppt File Clipart Images PDF
The following slide depicts the analysis of projected and actual sales performance post risk management to evaluate its success. It mainly includes revenue generated during 2021 and 2022 along with gross profit margin etc. Crafting an eye catching presentation has never been more straightforward. Let your presentation shine with this tasteful yet straightforward Comparative Analysis Of Budgeted And Actual Sales Ppt File Clipart Images PDF template. It offers a minimalistic and classy look that is great for making a statement. The colors have been employed intelligently to add a bit of playfulness while still remaining professional. Construct the ideal Comparative Analysis Of Budgeted And Actual Sales Ppt File Clipart Images PDF that effortlessly grabs the attention of your audience Begin now and be certain to wow your customers.
Efficient Administration Of Product Business And Umbrella Branding Umbrella Brand Maintenance Budget Assessment Icons PDF
This slide provides information regarding umbrella brand maintenance budget assessment in terms of international marketing, local marketing, content marketing, advertising, etc. Formulating a presentation can take up a lot of effort and time, so the content and message should always be the primary focus. The visuals of the PowerPoint can enhance the presenters message, so our Efficient Administration Of Product Business And Umbrella Branding Umbrella Brand Maintenance Budget Assessment Icons PDF was created to help save time. Instead of worrying about the design, the presenter can concentrate on the message while our designers work on creating the ideal templates for whatever situation is needed. Slidegeeks has experts for everything from amazing designs to valuable content, we have put everything into Efficient Administration Of Product Business And Umbrella Branding Umbrella Brand Maintenance Budget Assessment Icons PDF.
Ecommerce Website Creation Action Steps Playbook Ecommerce Website Performance Tracking Dashboard Template PDF
Slidegeeks is here to make your presentations a breeze with Ecommerce Website Creation Action Steps Playbook Ecommerce Website Performance Tracking Dashboard Template PDF With our easy-to-use and customizable templates, you can focus on delivering your ideas rather than worrying about formatting. With a variety of designs to choose from, youre sure to find one that suits your needs. And with animations and unique photos, illustrations, and fonts, you can make your presentation pop. So whether youre giving a sales pitch or presenting to the board, make sure to check out Slidegeeks first.

Business Disaster Threat Cause Pie Chart Ppt Pictures Gallery PDF
The given below slide showcases the major causes of business disasters to assess and formulate recovery plan accordingly. It mainly includes software failure, data sabotage, ransomware, human error, hardware failure etc. Showcasing this set of slides titled Business Disaster Threat Cause Pie Chart Ppt Pictures Gallery PDF. The topics addressed in these templates are Key Insights, Few Possible Solutions, Implement Data Backup. All the content presented in this PPT design is completely editable. Download it and make adjustments in color, background, font etc. as per your unique business setting.
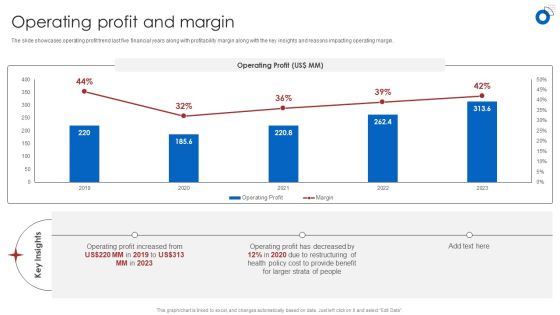
Insurance Business Financial Analysis Operating Profit And Margin Ppt Styles Structure PDF
The slide showcases operating profit trend last five financial years along with profitability margin along with the key insights and reasons impacting operating margin. Formulating a presentation can take up a lot of effort and time, so the content and message should always be the primary focus. The visuals of the PowerPoint can enhance the presenters message, so our Insurance Business Financial Analysis Operating Profit And Margin Ppt Styles Structure PDF was created to help save time. Instead of worrying about the design, the presenter can concentrate on the message while our designers work on creating the ideal templates for whatever situation is needed. Slidegeeks has experts for everything from amazing designs to valuable content, we have put everything into Insurance Business Financial Analysis Operating Profit And Margin Ppt Styles Structure PDF.

Analysing Impact Of Real Time Marketing Campaigns Ppt Show Graphic Images PDF
The following slide depicts consequences of real time marketing campaign to assess campaign results and determine areas of improvement. It includes elements such as website traffic, average engagement rate, number of followers along with key insights etc. Formulating a presentation can take up a lot of effort and time, so the content and message should always be the primary focus. The visuals of the PowerPoint can enhance the presenters message, so our Analysing Impact Of Real Time Marketing Campaigns Ppt Show Graphic Images PDF was created to help save time. Instead of worrying about the design, the presenter can concentrate on the message while our designers work on creating the ideal templates for whatever situation is needed. Slidegeeks has experts for everything from amazing designs to valuable content, we have put everything into Analysing Impact Of Real Time Marketing Campaigns Ppt Show Graphic Images PDF

Reasons Behind Poor Workplace Productivity Ppt Show Gallery PDF
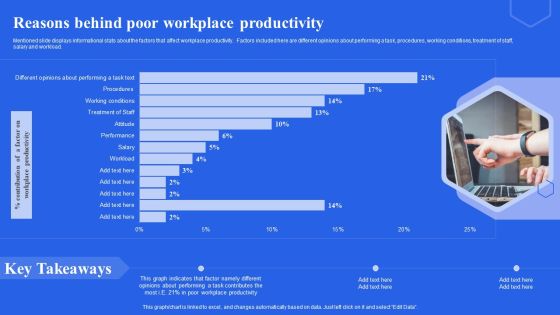
Mentioned slide displays informational stats about the factors that affect workplace productivity. Factors included here are different opinions about performing a task, procedures, working conditions, treatment of staff, salary and workload. Coming up with a presentation necessitates that the majority of the effort goes into the content and the message you intend to convey. The visuals of a PowerPoint presentation can only be effective if it supplements and supports the story that is being told. Keeping this in mind our experts created Reasons Behind Poor Workplace Productivity Ppt Show Gallery PDF to reduce the time that goes into designing the presentation. This way, you can concentrate on the message while our designers take care of providing you with the right template for the situation.

Dashboard To Measure Content Effectiveness Ppt Ideas Diagrams PDF
This slide shows the dashboard to measure content effectiveness which includes blog subscribers, opportunities to enhance rankings, click-through rate, pageviews, ad impressions, etc. Coming up with a presentation necessitates that the majority of the effort goes into the content and the message you intend to convey. The visuals of a PowerPoint presentation can only be effective if it supplements and supports the story that is being told. Keeping this in mind our experts created Dashboard To Measure Content Effectiveness Ppt Ideas Diagrams PDF to reduce the time that goes into designing the presentation. This way, you can concentrate on the message while our designers take care of providing you with the right template for the situation.
Reasons Behind Poor Workplace Productivity Ppt Infographics Rules PDF
Mentioned slide displays informational stats about the factors that affect workplace productivity. Factors included here are different opinions about performing a task, procedures, working conditions, treatment of staff, salary and workload. Coming up with a presentation necessitates that the majority of the effort goes into the content and the message you intend to convey. The visuals of a PowerPoint presentation can only be effective if it supplements and supports the story that is being told. Keeping this in mind our experts created Reasons Behind Poor Workplace Productivity Ppt Infographics Rules PDF to reduce the time that goes into designing the presentation. This way, you can concentrate on the message while our designers take care of providing you with the right template for the situation.

Dashboard For Software Defined Networking SDN Ppt Slides Images PDF
This slide depicts the dashboard for the software-defined network by covering details of bandwidth administrator, traffic quality, active flows, development tools, completed tasks, wide-area network bandwidth, and G drive. Coming up with a presentation necessitates that the majority of the effort goes into the content and the message you intend to convey. The visuals of a PowerPoint presentation can only be effective if it supplements and supports the story that is being told. Keeping this in mind our experts created Dashboard For Software Defined Networking SDN Ppt Slides Images PDF to reduce the time that goes into designing the presentation. This way, you can concentrate on the message while our designers take care of providing you with the right template for the situation.

Dashboard For Software Defined Networking SDN Ppt Icon Samples PDF
This slide depicts the dashboard for the software-defined network by covering details of bandwidth administrator, traffic quality, active flows, development tools, completed tasks, wide-area network bandwidth, and G drive. Coming up with a presentation necessitates that the majority of the effort goes into the content and the message you intend to convey. The visuals of a PowerPoint presentation can only be effective if it supplements and supports the story that is being told. Keeping this in mind our experts created Dashboard For Software Defined Networking SDN Ppt Icon Samples PDF to reduce the time that goes into designing the presentation. This way, you can concentrate on the message while our designers take care of providing you with the right template for the situation.


 Continue with Email
 Sign up for an account
 Home
Home