Feedback Loop Diagram
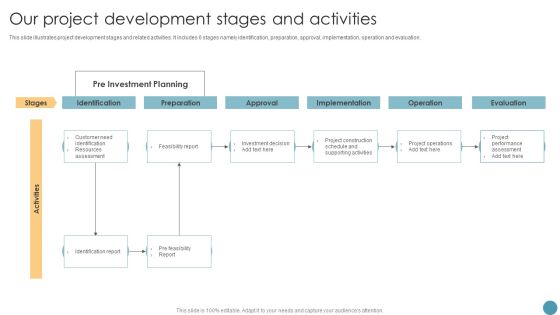
Our Project Development Stages And Activities Feasibility Analysis Report For Construction Project Diagrams PDF
This slide illustrates project development stages and related activities. It includes 6 stages namely identification, preparation, approval, implementation, operation and evaluation. This Our Project Development Stages And Activities Feasibility Analysis Report For Construction Project Diagrams PDF is perfect for any presentation, be it in front of clients or colleagues. It is a versatile and stylish solution for organizing your meetings. The Our Project Development Stages And Activities Feasibility Analysis Report For Construction Project Diagrams PDF features a modern design for your presentation meetings. The adjustable and customizable slides provide unlimited possibilities for acing up your presentation. Slidegeeks has done all the homework before launching the product for you. So, do not wait, grab the presentation templates today.
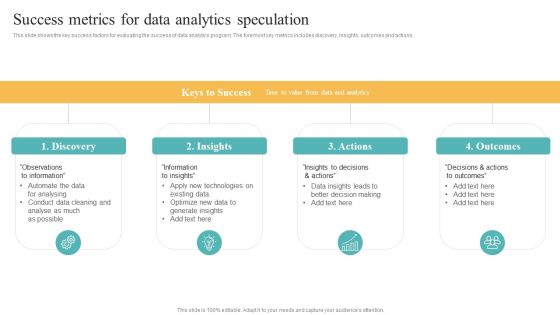
Transformation Toolkit Competitive Intelligence Information Analysis Success Metrics For Data Analytics Speculation Diagrams PDF
This slide shows the key success factors for evaluating the success of data analytics program. The foremost key metrics includes discovery, insights, outcomes and actions. Do you have to make sure that everyone on your team knows about any specific topic I yes, then you should give Transformation Toolkit Competitive Intelligence Information Analysis Success Metrics For Data Analytics Speculation Diagrams PDF a try. Our experts have put a lot of knowledge and effort into creating this impeccable Transformation Toolkit Competitive Intelligence Information Analysis Success Metrics For Data Analytics Speculation Diagrams PDF. You can use this template for your upcoming presentations, as the slides are perfect to represent even the tiniest detail. You can download these templates from the Slidegeeks website and these are easy to edit. So grab these today.

Enhancing Organic Reach Roles And Responsibilities Of Key Social Media Team Members Diagrams PDF
This slide shows roles and responsibilities of social media engagement team. It provides details such as defining campaigns, collaborating, evaluating, posting, schedule, responding, web traffic, platforms, etc. Crafting an eye-catching presentation has never been more straightforward. Let your presentation shine with this tasteful yet straightforward Enhancing Organic Reach Roles And Responsibilities Of Key Social Media Team Members Diagrams PDF template. It offers a minimalistic and classy look that is great for making a statement. The colors have been employed intelligently to add a bit of playfulness while still remaining professional. Construct the ideal Enhancing Organic Reach Roles And Responsibilities Of Key Social Media Team Members Diagrams PDF that effortlessly grabs the attention of your audience Begin now and be certain to wow your customers.

Implementing Ecommerce Marketing Services Plan E Commerce Stages In Marketing Funnel Diagrams PDF
This slide shows the pre and post purchase stages of e commerce in marketing funnel which includes engagement, education, research, evaluation, justification, etc. Do you have to make sure that everyone on your team knows about any specific topic I yes, then you should give Implementing Ecommerce Marketing Services Plan E Commerce Stages In Marketing Funnel Diagrams PDF a try. Our experts have put a lot of knowledge and effort into creating this impeccable Implementing Ecommerce Marketing Services Plan E Commerce Stages In Marketing Funnel Diagrams PDF. You can use this template for your upcoming presentations, as the slides are perfect to represent even the tiniest detail. You can download these templates from the Slidegeeks website and these are easy to edit. So grab these today.

Amazon Strategic Growth Initiative On Global Scale Potential Opportunities Attained Diagrams PDF
This slide provides information regarding SWOT analysis technique utilized by Amazon to evaluate its competitive positioning. The slide highlighting opportunities that Amazon consider to attain competitive edge in terms of voice growth, online payment gateway, etc. Do you have an important presentation coming up Are you looking for something that will make your presentation stand out from the rest Look no further than Amazon Strategic Growth Initiative On Global Scale Potential Opportunities Attained Diagrams PDF. With our professional designs, you can trust that your presentation will pop and make delivering it a smooth process. And with Slidegeeks, you can trust that your presentation will be unique and memorable. So why wait Grab Amazon Strategic Growth Initiative On Global Scale Potential Opportunities Attained Diagrams PDF today and make your presentation stand out from the rest.
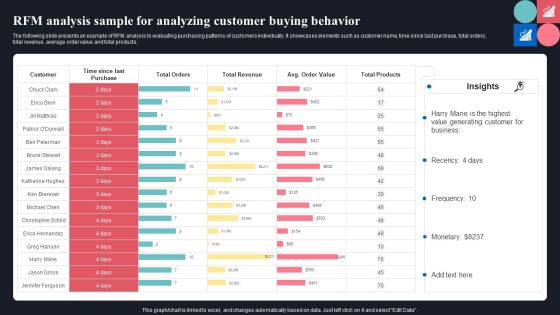
RFM Analysis Sample For Analyzing Customer Buying Behavior Ppt Gallery Diagrams PDF
The following slide presents an example of RFM analysis to evaluating purchasing patterns of customers individually. It showcases elements such as customer name, time since last purchase, total orders, total revenue, average order value and total products. Get a simple yet stunning designed RFM Analysis Sample For Analyzing Customer Buying Behavior Ppt Gallery Diagrams PDF. It is the best one to establish the tone in your meetings. It is an excellent way to make your presentations highly effective. So, download this PPT today from Slidegeeks and see the positive impacts. Our easy to edit RFM Analysis Sample For Analyzing Customer Buying Behavior Ppt Gallery Diagrams PDF can be your go to option for all upcoming conferences and meetings. So, what are you waiting for Grab this template today.

Artificial Intelligence Playbook Identifying And Understanding The AI Suitability Diagrams PDF
Following slide provides an overview about the five stage process that can be used by the organizations to determine whether AI technology is suitable for their business operations or not. Stages covered are assessment, readiness, selection, implementation and integration. Presenting artificial intelligence playbook identifying and understanding the ai suitability diagrams pdf to provide visual cues and insights. Share and navigate important information on five stages that need your due attention. This template can be used to pitch topics like assessment, readiness, selection, implementation, integration. In addtion, this PPT design contains high resolution images, graphics, etc, that are easily editable and available for immediate download.

Advantages Of Efficient Overview Of The Components Of An Effective Internal Control Diagrams PDF
This slide provides an overview of the various interrelated components that are included in an internal control system such as control environment, risk assessment, communication, monitoring etc. This is also known as Internal Control System Framework. This is a Advantages Of Efficient Overview Of The Components Of An Effective Internal Control Diagrams PDF template with various stages. Focus and dispense information on five stages using this creative set, that comes with editable features. It contains large content boxes to add your information on topics like Control Environment, Risk Assessment, Control Activities. You can also showcase facts, figures, and other relevant content using this PPT layout. Grab it now.

Brand Awareness Metrics Social Or Non-Social Media Reach Comprehensive Guide For Brand Recognition Diagrams PDF
This slide provides information regarding social or non-social media reach as brand awareness metrics. It helps in assessing brand awareness and recall. The slide also include key initiatives to enhance brand reach. Get a simple yet stunning designed Brand Awareness Metrics Social Or Non-Social Media Reach Comprehensive Guide For Brand Recognition Diagrams PDF. It is the best one to establish the tone in your meetings. It is an excellent way to make your presentations highly effective. So, download this PPT today from Slidegeeks and see the positive impacts. Our easy-to-edit Brand Awareness Metrics Social Or Non-Social Media Reach Comprehensive Guide For Brand Recognition Diagrams PDF can be your go-to option for all upcoming conferences and meetings. So, what are you waiting for Grab this template today.
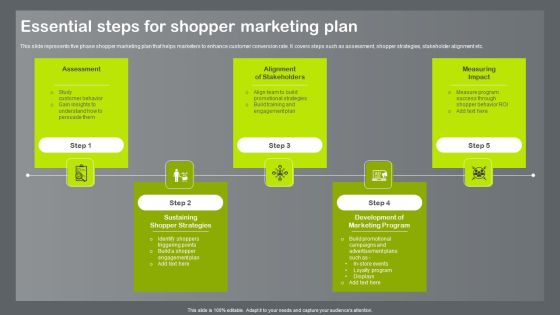
Shopper And Client Marketing Plan To Boost Sales Essential Steps For Shopper Marketing Plan Diagrams PDF
This slide represents five phase shopper marketing plan that helps marketers to enhance customer conversion rate. It covers steps such as assessment, shopper strategies, stakeholder alignment etc. Do you have an important presentation coming up Are you looking for something that will make your presentation stand out from the rest Look no further than Shopper And Client Marketing Plan To Boost Sales Essential Steps For Shopper Marketing Plan Diagrams PDF. With our professional designs, you can trust that your presentation will pop and make delivering it a smooth process. And with Slidegeeks, you can trust that your presentation will be unique and memorable. So why wait Grab Shopper And Client Marketing Plan To Boost Sales Essential Steps For Shopper Marketing Plan Diagrams PDF today and make your presentation stand out from the rest.
Digital Marketing Advisory Project Timeline Ppt PowerPoint Presentation Icon Diagrams PDF
Following slide showcase consulting project digital marketing campaign timeline which includes multiple tasks and activities such as- need assessment, target market assessment, content writing and email campaign. Pitch your topic with ease and precision using this digital marketing advisory project timeline ppt powerpoint presentation icon diagrams pdf. This layout presents information on digital marketing advisory project timeline . It is also available for immediate download and adjustment. So, changes can be made in the color, design, graphics or any other component to create a unique layout.

Agriculture Business Elevator Pitch Deck Determine Competitive Advantage Of Farming Firm Diagrams PDF
This slide caters details about competitive advantage of agriculture firm in terms of panel of experts for overall administration, data assessment in real time and expertise from leader experts. Explore a selection of the finest Agriculture Business Elevator Pitch Deck Determine Competitive Advantage Of Farming Firm Diagrams PDF here. With a plethora of professionally designed and pre made slide templates, you can quickly and easily find the right one for your upcoming presentation. You can use our Agriculture Business Elevator Pitch Deck Determine Competitive Advantage Of Farming Firm Diagrams PDF to effectively convey your message to a wider audience. Slidegeeks has done a lot of research before preparing these presentation templates. The content can be personalized and the slides are highly editable. Grab templates today from Slidegeeks.

IT System Risk Management Guide IT Risk Management Process Diagrams PDF
This slide highlights the information technology risk management process which includes risks scope, risks assessment, risk treatment and risk communication along with operations and product procedure. Crafting an eye catching presentation has never been more straightforward. Let your presentation shine with this tasteful yet straightforward IT System Risk Management Guide IT Risk Management Process Diagrams PDF template. It offers a minimalistic and classy look that is great for making a statement. The colors have been employed intelligently to add a bit of playfulness while still remaining professional. Construct the ideal IT System Risk Management Guide IT Risk Management Process Diagrams PDF that effortlessly grabs the attention of your audience Begin now and be certain to wow your customers.

Developing Brand Awareness To Gain Customer Attention Brand Reputation Management Platform Selection Diagrams PDF
This slide provides information regarding brand reputation management platform selection along with the purpose, features, duration to implement, user rating, cost. The features include real time media monitoring, sentiment assessment, podcast tracking, etc. Do you have an important presentation coming up Are you looking for something that will make your presentation stand out from the rest Look no further than Developing Brand Awareness To Gain Customer Attention Brand Reputation Management Platform Selection Diagrams PDF. With our professional designs, you can trust that your presentation will pop and make delivering it a smooth process. And with Slidegeeks, you can trust that your presentation will be unique and memorable. So why wait Grab Developing Brand Awareness To Gain Customer Attention Brand Reputation Management Platform Selection Diagrams PDF today and make your presentation stand out from the rest.

Data Governance IT Benefits Of Process Oriented Data Stewardship Model Diagrams PDF
This slide represents the benefits of the process oriented data stewardship model that includes data stewardship considered a natural extension, a robust model to establish data stewardship, and easy to assess the information quality. Create an editable Data Governance IT Benefits Of Process Oriented Data Stewardship Model Diagrams PDF that communicates your idea and engages your audience. Whether you are presenting a business or an educational presentation, pre designed presentation templates help save time. Data Governance IT Benefits Of Process Oriented Data Stewardship Model Diagrams PDF is highly customizable and very easy to edit, covering many different styles from creative to business presentations. Slidegeeks has creative team members who have crafted amazing templates. So, go and get them without any delay.

Types Of Reinforcement Learning In ML Training Program For Reinforcement Learning Diagrams PDF
This slide depicts the reinforcement learning training program for employees in the organization, including modules to be covered, mode of training, and assessment method. The module covers reinforcement learning specialization, reinforcement learning in Python, and so on.Get a simple yet stunning designed Types Of Reinforcement Learning In ML Training Program For Reinforcement Learning Diagrams PDF. It is the best one to establish the tone in your meetings. It is an excellent way to make your presentations highly effective. So, download this PPT today from Slidegeeks and see the positive impacts. Our easy to edit Types Of Reinforcement Learning In ML Training Program For Reinforcement Learning Diagrams PDF can be your go to option for all upcoming conferences and meetings. So, what are you waiting for Grab this template today.
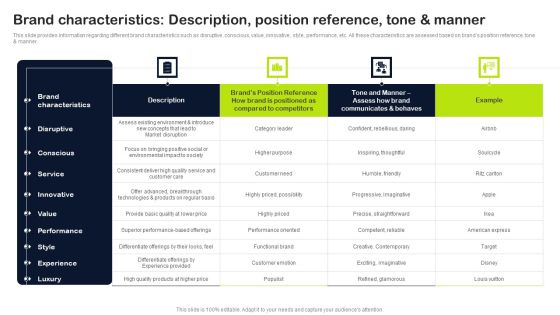
Key Elements Of Strategic Brand Administration Brand Characteristics Description Position Reference Tone Diagrams PDF
This slide provides information regarding different brand characteristics such as disruptive, conscious, value, innovative, style, performance, etc. All these characteristics are assessed based on brands position reference, tone and manner. Do you have to make sure that everyone on your team knows about any specific topic I yes, then you should give Key Elements Of Strategic Brand Administration Brand Characteristics Description Position Reference Tone Diagrams PDF a try. Our experts have put a lot of knowledge and effort into creating this impeccable Key Elements Of Strategic Brand Administration Brand Characteristics Description Position Reference Tone Diagrams PDF. You can use this template for your upcoming presentations, as the slides are perfect to represent even the tiniest detail. You can download these templates from the Slidegeeks website and these are easy to edit. So grab these today
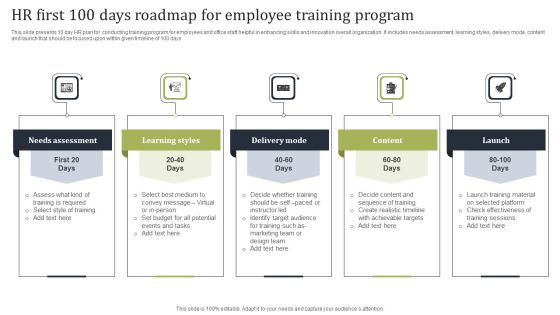
HR First 100 Days Roadmap For Employee Training Program Diagrams PDF
This slide presents 10 day HR plan for conducting training program for employees and office staff helpful in enhancing skills and innovation overall organization. It includes needs assessment, learning styles, delivery mode, content and launch that should be focused upon within given timeline of 100 days. Presenting HR First 100 Days Roadmap For Employee Training Program Diagrams PDF to dispense important information. This template comprises five stages. It also presents valuable insights into the topics including Needs Assessment, Learning Styles, Delivery Mode. This is a completely customizable PowerPoint theme that can be put to use immediately. So, download it and address the topic impactfully.
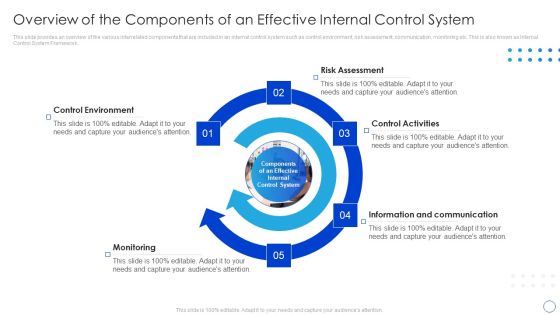
Overview Of The Components Of An Effective Internal Control System Diagrams PDF
This slide provides an overview of the various interrelated components that are included in an internal control system such as control environment, risk assessment, communication, monitoring etc. This is also known as Internal Control System Framework. Presenting Overview Of The Components Of An Effective Internal Control System Diagrams PDF to provide visual cues and insights. Share and navigate important information on five stages that need your due attention. This template can be used to pitch topics like Risk Assessment, Control Activities, Information And Communication. In addtion, this PPT design contains high resolution images, graphics, etc, that are easily editable and available for immediate download.

Business Continuity And Risk Firm Revival Action Plan Checklist Diagrams PDF
This slide depicts a checklist that compares business continuity and risk recovery strategies in order to build self-monitoring and self-assessment. The major elements are description, implementation status and remarks. Showcasing this set of slides titled Business Continuity And Risk Firm Revival Action Plan Checklist Diagrams PDF. The topics addressed in these templates are Business Continuity Strategy, Organisation Conducts, Regular Risk Assessment. All the content presented in this PPT design is completely editable. Download it and make adjustments in color, background, font etc. as per your unique business setting.

Need Of Employee Onboarding Buddy System For New Employee Ppt Infographic Template Diagrams PDF
This slide showcases need assessment for having an onboarding buddy to a new employee. It includes several benefits like provide context, boost productivity, improve new employee satisfaction, reduce initial confusion and develop relationship. Presenting Need Of Employee Onboarding Buddy System For New Employee Ppt Infographic Template Diagrams PDF to dispense important information. This template comprises five stages. It also presents valuable insights into the topics including Provide Context, Boost Productivity, Develop Relationship. This is a completely customizable PowerPoint theme that can be put to use immediately. So, download it and address the topic impactfully.
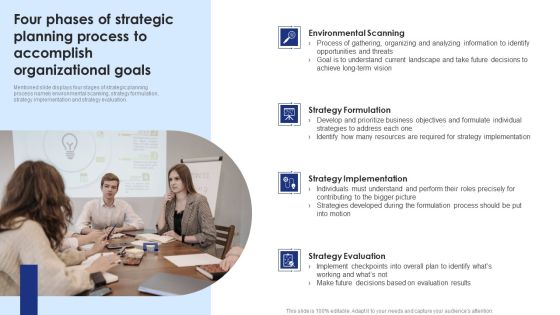
Four Phases Of Strategic Planning Process To Accomplish Organizational Goals Diagrams PDF
Mentioned slide displays four stages of strategic planning process namely environmental scanning, strategy formulation, strategy implementation and strategy evaluation. From laying roadmaps to briefing everything in detail, our templates are perfect for you. You can set the stage with your presentation slides. All you have to do is download these easy to edit and customizable templates. Four Phases Of Strategic Planning Process To Accomplish Organizational Goals Diagrams PDF will help you deliver an outstanding performance that everyone would remember and praise you for. Do download this presentation today.

Business Analysis Diagrams Of 7 Stages Activities And Relations PowerPoint Template
We present our business analysis diagrams of 7 stages activities and relations PowerPoint template.Download and present our Business PowerPoint Templates because You will get more than you ever bargained for. Present our Circle Charts PowerPoint Templates because Our PowerPoint Templates and Slides are created by a hardworking bunch of busybees. Always flitting around with solutions gauranteed to please. Download our Shapes PowerPoint Templates because Your audience will believe you are the cats whiskers. Download and present our Process and Flows PowerPoint Templates because You can Be the puppeteer with our PowerPoint Templates and Slides as your strings. Lead your team through the steps of your script. Download our Leadership PowerPoint Templates because Our PowerPoint Templates and Slides are Clear and concise. Use them and dispel any doubts your team may have.Use these PowerPoint slides for presentations relating to project, flow, process, business, system, success, chart, work, innovation, implementation, plan, concept, evaluation, presentation, symbol, internet, diagram, analysis, flowchart, analyzing, technology, idea, development, management, steps, strategy, addie, design, outcome, assessment, structure. The prominent colors used in the PowerPoint template are Pink, Gray, White.
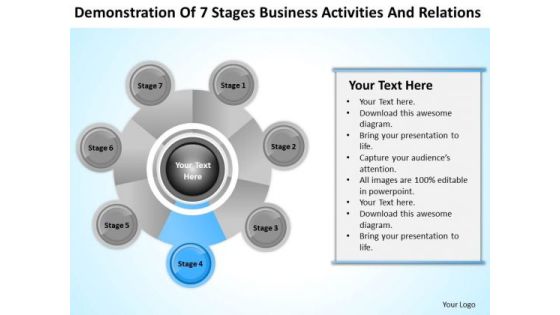
Business Analysis Diagrams Of 7 Stages Activities And Relations PowerPoint Templates
We present our business analysis diagrams of 7 stages activities and relations PowerPoint templates.Download and present our Business PowerPoint Templates because Your audience will believe you are the cats whiskers. Use our Circle Charts PowerPoint Templates because You will get more than you ever bargained for. Present our Shapes PowerPoint Templates because You can Bait your audience with our PowerPoint Templates and Slides. They will bite the hook of your ideas in large numbers. Use our Process and Flows PowerPoint Templates because You can Score a slam dunk with our PowerPoint Templates and Slides. Watch your audience hang onto your every word. Download and present our Leadership PowerPoint Templates because You can Hit the nail on the head with our PowerPoint Templates and Slides. Embed your ideas in the minds of your audience.Use these PowerPoint slides for presentations relating to project, flow, process, business, system, success, chart, work, innovation, implementation, plan, concept, evaluation, presentation, symbol, internet, diagram, analysis, flowchart, analyzing, technology, idea, development, management, steps, strategy, addie, design, outcome, assessment, structure. The prominent colors used in the PowerPoint template are Blue light, Gray, White.

Business Analysis Diagrams Of 7 Stages Activities And Relations Ppt PowerPoint Templates
We present our business analysis diagrams of 7 stages activities and relations ppt PowerPoint templates.Download and present our Business PowerPoint Templates because You can Hit the nail on the head with our PowerPoint Templates and Slides. Embed your ideas in the minds of your audience. Use our Circle Charts PowerPoint Templates because It can Bubble and burst with your ideas. Use our Shapes PowerPoint Templates because You should Ascend the ladder of success with ease. Our PowerPoint Templates and Slides will provide strong and sturdy steps. Present our Process and Flows PowerPoint Templates because They will Put the wind in your sails. Skim smoothly over the choppy waters of the market. Present our Leadership PowerPoint Templates because you can Break through with our PowerPoint Templates and Slides. Bring down the mental barriers of your audience.Use these PowerPoint slides for presentations relating to project, flow, process, business, system, success, chart, work, innovation, implementation, plan, concept, evaluation, presentation, symbol, internet, diagram, analysis, flowchart, analyzing, technology, idea, development, management, steps, strategy, addie, design, outcome, assessment, structure. The prominent colors used in the PowerPoint template are Red, Gray, White.

B2B Sales Techniques Playbook Streamlining B2B Sales Models For Enhanced Performance Diagrams PDF
This slide provides information regarding streamlining B2B sales models for improved productivity by assessing different sales models based in cost per transaction degree of sales interaction and aligning organizational strengths with prospects requirements.This is a B2B Sales Techniques Playbook Streamlining B2B Sales Models For Enhanced Performance Diagrams PDF template with various stages. Focus and dispense information on four stages using this creative set, that comes with editable features. It contains large content boxes to add your information on topics like Limited Interaction, Limited Interaction, Huge Investment. You can also showcase facts, figures, and other relevant content using this PPT layout. Grab it now.
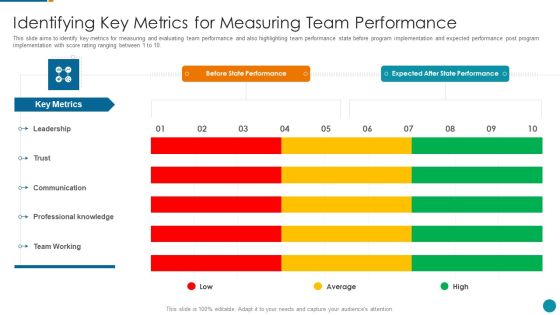
Strategic Procedure To Improve Employee Efficiency Identifying Key Metrics For Measuring Diagrams PDF
This slide aims to identify key metrics for measuring and evaluating team performance and also highlighting team performance state before program implementation and expected performance post program implementation with score rating ranging between 1 to 10.Deliver and pitch your topic in the best possible manner with this strategic procedure to improve employee efficiency identifying key metrics for measuring diagrams pdf Use them to share invaluable insights on expected after state performance, professional knowledge, communication and impress your audience. This template can be altered and modified as per your expectations. So, grab it now.
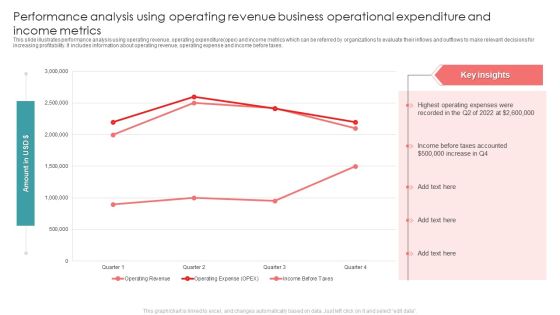
Performance Analysis Using Operating Revenue Business Operational Expenditure And Income Metrics Diagrams PDF
This slide illustrates performance analysis using operating revenue, operating expenditure opex and income metrics which can be referred by organizations to evaluate their inflows and outflows to make relevant decisions for increasing profitability. It includes information about operating revenue, operating expense and income before taxes. Pitch your topic with ease and precision using this Performance Analysis Using Operating Revenue Business Operational Expenditure And Income Metrics Diagrams PDF. This layout presents information on Taxes, Highest Operating, Recorded. It is also available for immediate download and adjustment. So, changes can be made in the color, design, graphics or any other component to create a unique layout.

Due Diligence Process In Merger And Acquisition Agreement M And A Lifecycle Overview Diagrams PDF
Mentioned slide shows the overview of merger and acquisition lifecycle process. The process is divided into three parts that is pre deal, pre-announcement and post announcement.Presenting due diligence process in merger and acquisition agreement m and a lifecycle overview diagrams pdf to provide visual cues and insights. Share and navigate important information on five stages that need your due attention. This template can be used to pitch topics like target screening, diligence and evaluation, integration planning In addtion, this PPT design contains high resolution images, graphics, etc, that are easily editable and available for immediate download.
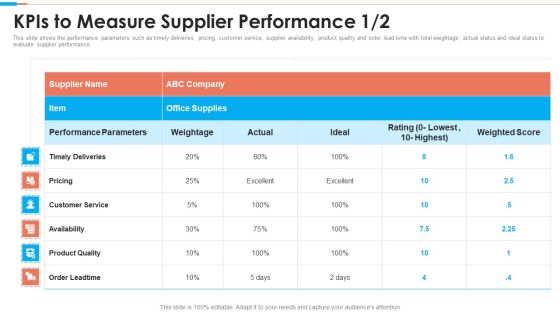
Tactical Approach To Vendor Relationship Kpis To Measure Supplier Diagrams PDF
This slide shows the performance parameters such as timely deliveries, pricing, customer service, supplier availability, product quality and order lead time with total weightage, actual status and ideal status to evaluate supplier performance.Deliver and pitch your topic in the best possible manner with this Tactical Approach To Vendor Relationship Kpis To Measure Supplier Diagrams PDF Use them to share invaluable insights on Kpis To Measure Supplier Performance and impress your audience. This template can be altered and modified as per your expectations. So, grab it now.

Revolution In Online Business Organization Digital Maturity Model Overview Diagrams PDF
The DMM evaluates digital capability across 5 clearly defined business dimensions to create a holistic view of digital transformation journey across the organization which are divided into 28 sub-dimensions, further breakdown into 179 individual criteria. Deliver an awe inspiring pitch with this creative Revolution In Online Business Organization Digital Maturity Model Overview Diagrams PDF bundle. Topics like Customer Engagement Strategy, Brand Management Technology, Ecosystem Experience Operations can be discussed with this completely editable template. It is available for immediate download depending on the needs and requirements of the user.
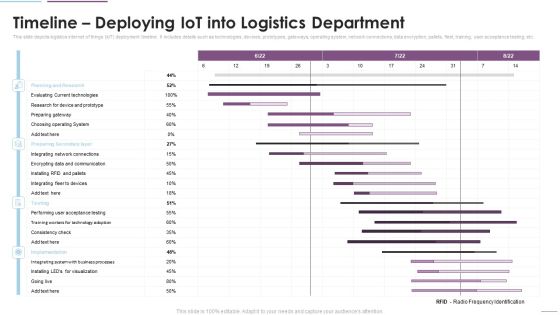
Supply Chain Management Timeline Deploying Iot Into Logistics Department Diagrams PDF
This slide depicts logistics internet of things IoT deployment timeline. It includes details such as technologies, devices, prototypes, gateways, operating system, network connections, data encryption, pallets, fleet, training, user acceptance testing, etc. Deliver and pitch your topic in the best possible manner with this Supply Chain Management Timeline Deploying Iot Into Logistics Department Diagrams PDF. Use them to share invaluable insights on Planning And Research, Evaluating Current Technologies, Choosing Operating System and impress your audience. This template can be altered and modified as per your expectations. So, grab it now.
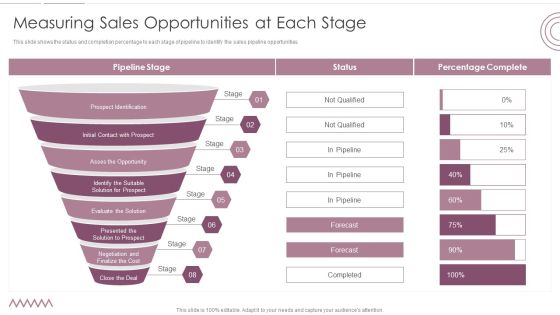
Sales Management Pipeline For Effective Lead Generation Measuring Sales Opportunities At Each Stage Diagrams PDF
This slide shows the status and completion percentage to each stage of pipeline to identify the sales pipeline opportunities. Presenting Sales Management Pipeline For Effective Lead Generation Measuring Sales Opportunities At Each Stage Diagrams PDF to provide visual cues and insights. Share and navigate important information on eight stages that need your due attention. This template can be used to pitch topics like Opportunity, Evaluate The Solution, Cost. In addtion, this PPT design contains high resolution images, graphics, etc, that are easily editable and available for immediate download.
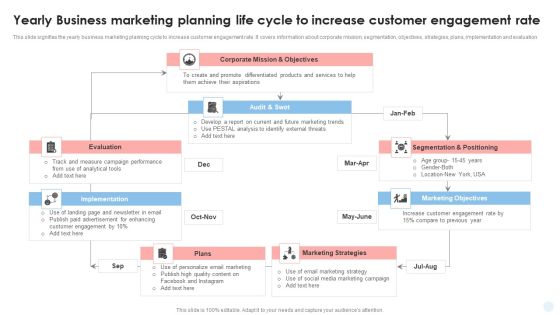
Yearly Business Marketing Planning Life Cycle To Increase Customer Engagement Rate Diagrams PDF
This slide signifies the yearly business marketing planning cycle to increase customer engagement rate. It covers information about corporate mission, segmentation, objectives, strategies, plans, implementation and evaluation.Pitch your topic with ease and precision using this Yearly Business Marketing Planning Life Cycle To Increase Customer Engagement Rate Diagrams PDF. This layout presents information on Differentiated Products, Customer Engagement, Identify External. It is also available for immediate download and adjustment. So, changes can be made in the color, design, graphics or any other component to create a unique layout.

Customer Support Team Performance Audit And Review Results Consumer Contact Point Guide Diagrams PDF
This slide covers the customer care department audit results. It includes performance evaluation criteria such as agent name, accepted call legs, declined legs, missed, outbound calls, leg talk time, avg leg talk time, live chat issues resolved, video calls, etc. The best PPT templates are a great way to save time, energy, and resources. Slidegeeks have 100 parcent editable powerpoint slides making them incredibly versatile. With these quality presentation templates, you can create a captivating and memorable presentation by combining visually appealing slides and effectively communicating your message. Download Customer Support Team Performance Audit And Review Results Consumer Contact Point Guide Diagrams PDF from Slidegeeks and deliver a wonderful presentation.

Amazon Business Strategies To Gain Competitive Advantage Strengths That Leverage Firm To Gain Diagrams PDF
This slide provides information regarding SWOT analysis technique utilized by Amazon to evaluate its competitive positioning. The slide highlighting strengths in which Amazon excels in terms of data, exclusive prime membership, global recognition, etc. Make sure to capture your audiences attention in your business displays with our gratis customizable Amazon Business Strategies To Gain Competitive Advantage Strengths That Leverage Firm To Gain Diagrams PDF. These are great for business strategies, office conferences, capital raising or task suggestions. If you desire to acquire more customers for your tech business and ensure they stay satisfied, create your own sales presentation with these plain slides.
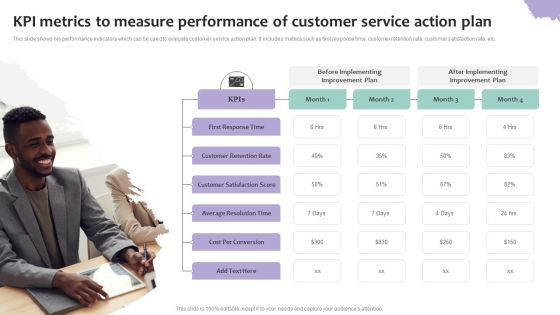
KPI Metrics To Measure Performance Of Customer Service Action Plan Diagrams PDF
This slide shows key performance indicators which can be used to evaluate customer service action plan. It includes metrics such as first response time, customer retention rate, customer satisfaction rate, etc. Persuade your audience using this KPI Metrics To Measure Performance Of Customer Service Action Plan Diagrams PDF. This PPT design covers four stages, thus making it a great tool to use. It also caters to a variety of topics including Before Implementing, Improvement Plan, After Implementing, First Response Time . Download this PPT design now to present a convincing pitch that not only emphasizes the topic but also showcases your presentation skills.

Mobile Search Engine Optimization Plan Kpis To Effectively Track Mobile SEO Performance Diagrams PDF
The purpose of this slide is to outline various KPIs through which organization can evaluate the mobile search engine optimization SEO performance. The key KPIs are organic clicks, pages per session, bounce rate, page speed, crawl errors and backlinks. There are so many reasons you need a Mobile Search Engine Optimization Plan Kpis To Effectively Track Mobile SEO Performance Diagrams PDF. The first reason is you can not spend time making everything from scratch, Thus, Slidegeeks has made presentation templates for you too. You can easily download these templates from our website easily.

Content Delivery And Promotion Content Marketing Channels For Product Promotion Diagrams PDF
This slide showcases evaluation of different channels that can help organization to distribute and market the content. Its key elements are media type, examples, role benefits and challenges. Present like a pro with Content Delivery And Promotion Content Marketing Channels For Product Promotion Diagrams PDF Create beautiful presentations together with your team, using our easy-to-use presentation slides. Share your ideas in real-time and make changes on the fly by downloading our templates. So whether youre in the office, on the go, or in a remote location, you can stay in sync with your team and present your ideas with confidence. With Slidegeeks presentation got a whole lot easier. Grab these presentations today.

Media Advertising Types Of Ads Format Published On Youtube Channel Diagrams PDF
This slide is used to evaluate the followers, clicks and number of posts liked and shared by the user in a month on social media channel. Want to ace your presentation in front of a live audience Our Media Advertising Types Of Ads Format Published On Youtube Channel Diagrams PDF can help you do that by engaging all the users towards you. Slidegeeks experts have put their efforts and expertise into creating these impeccable powerpoint presentations so that you can communicate your ideas clearly. Moreover, all the templates are customizable, and easy-to-edit and downloadable. Use these for both personal and commercial use.
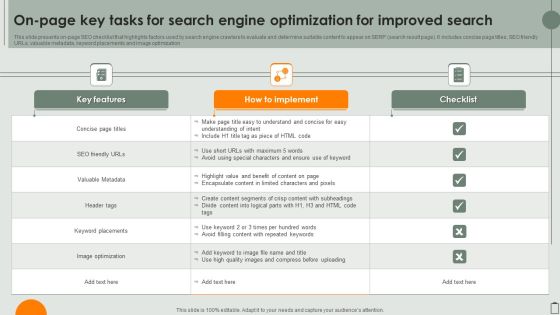
On Page Key Tasks For Search Engine Optimization For Improved Search Diagrams PDF
This slide presents on-page SEO checklist that highlights factors used by search engine crawlers to evaluate and determine suitable content to appear on SERP search result page. It includes concise page titles, SEO friendly URLs, valuable metadata, keyword placements and image optimization. Showcasing this set of slides titled On Page Key Tasks For Search Engine Optimization For Improved Search Diagrams PDF. The topics addressed in these templates are Concise Page Titles, Valuable Metadata, Keyword Placements. All the content presented in this PPT design is completely editable. Download it and make adjustments in color, background, font etc. as per your unique business setting.

Devops Tools And Configuration IT Activities To Successfully Implement Devop Setup Diagrams PDF
This slide provides information about activities that can be followed by the firm to successfully implement the DevOp setup within its operations. This is a devops tools and configuration it activities to successfully implement devop setup diagrams pdf template with various stages. Focus and dispense information on three stages using this creative set, that comes with editable features. It contains large content boxes to add your information on topics like assessment phase, implementation phase, monitoring and maintenance. You can also showcase facts, figures, and other relevant content using this PPT layout. Grab it now.
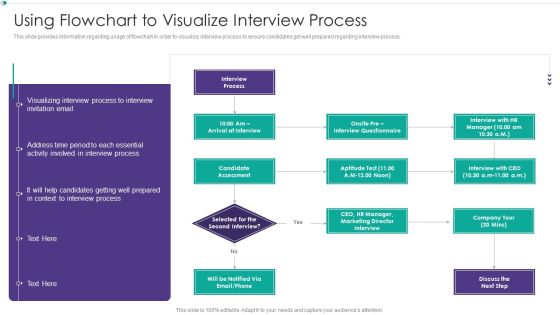
Hiring New Employees At Workplace Using Flowchart To Visualize Interview Process Diagrams PDF
This slide provides information regarding usage of flowchart in order to visualize interview process to ensure candidates get well prepared regarding interview process. Presenting Hiring New Employees At Workplace Using Flowchart To Visualize Interview Process Diagrams PDF to provide visual cues and insights. Share and navigate important information on one stage that need your due attention. This template can be used to pitch topics like Interview Process, Candidate Assessment, Manager, Marketing. In addtion, this PPT design contains high resolution images, graphics, etc, that are easily editable and available for immediate download.
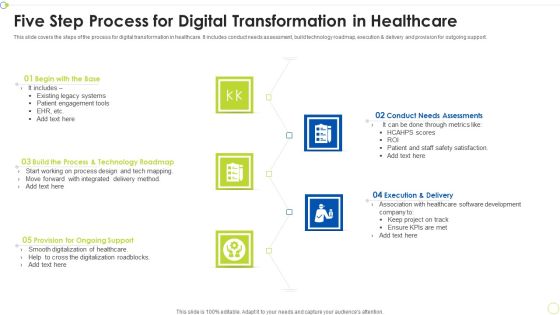
Five Step Process For Digital Transformation In Healthcare Ppt PowerPoint Presentation File Diagrams PDF
This slide covers the steps of the process for digital transformation in healthcare. It includes conduct needs assessment, build technology roadmap, execution and delivery and provision for outgoing support. Presenting Five Step Process For Digital Transformation In Healthcare Ppt PowerPoint Presentation File Diagrams PDF to dispense important information. This template comprises five stages. It also presents valuable insights into the topics including Technology Roadmap, Conduct Needs, Execution Delivery. This is a completely customizable PowerPoint theme that can be put to use immediately. So, download it and address the topic impactfully.

Steps To Identify Key Elements Of Successful Project Factors Diagrams PDF
The following slide depicts the key steps to identify project success factors to align and meet business needs. It includes defining project goals, scope, managing communication system and assessing risk etc. Presenting Steps To Identify Key Elements Of Successful Project Factors Diagrams PDF to dispense important information. This template comprises four stages. It also presents valuable insights into the topics including Determine Project Scope, Manage Communication, Precisely Define Project Goals. This is a completely customizable PowerPoint theme that can be put to use immediately. So, download it and address the topic impactfully.

3 Stages Risk Administration Process For Successful Implementation Of Project Diagrams PDF
This slide signifies the four step process of risk management for digital marketing project. It covers information about stages like assessment, analysis, planning and monitoring. Presenting 3 Stages Risk Administration Process For Successful Implementation Of Project Diagrams PDF to dispense important information. This template comprises three stages. It also presents valuable insights into the topics including Identify Risk, Risk And Tissues, Monitor, Risk And Issues. This is a completely customizable PowerPoint theme that can be put to use immediately. So, download it and address the topic impactfully.

Case Competition Petroleum Sector Issues Guidelines Under Environmental Policy To Protect Environment Diagrams PDF
The slide provides the major guidelines and rules under environmental policy to protect environment. Major rules and guidelines include green completion rule, underground injection control program, the bureau of land management BLM rule etc. This is a case competition petroleum sector issues guidelines under environmental policy to protect environment diagrams pdf template with various stages. Focus and dispense information on five stages using this creative set, that comes with editable features. It contains large content boxes to add your information on topics like control program, management, national environmental policy act, impact statements, environmental assessments. You can also showcase facts, figures, and other relevant content using this PPT layout. Grab it now.

B2B Demand Generation Best Practices Determine B2B Account Managing Team Training Packages Diagrams PDF
This slide provides information regarding B2B account managing teams training packages such as silver, gold and platinum. These training packages are segregated based of training modules and services offered along with cost. Deliver an awe inspiring pitch with this creative b2b demand generation best practices determine b2b account managing team training packages diagrams pdf bundle. Topics like sales b2b account managing, team training, self assessment tools, online modules can be discussed with this completely editable template. It is available for immediate download depending on the needs and requirements of the user.
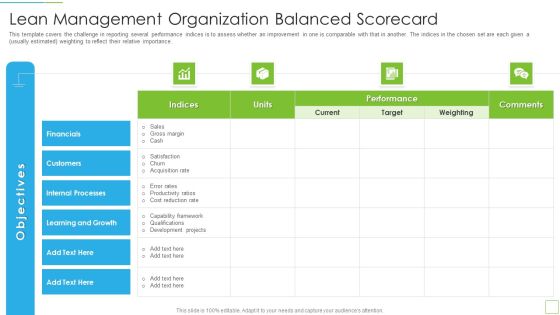
Hoshin Kanri Pitch Deck Lean Management Organization Balanced Scorecard Diagrams PDF
This template covers the challenge in reporting several performance indices is to assess whether an improvement in one is comparable with that in another. The indices in the chosen set are each given a usually estimated weighting to reflect their relative importance.Deliver and pitch your topic in the best possible manner with this hoshin kanri pitch deck lean management organization balanced scorecard diagrams pdf Use them to share invaluable insights on internal processes, learning and growth, customers and impress your audience. This template can be altered and modified as per your expectations. So, grab it now.

Project Management Capability Maturity Model With Process People And Technology Diagrams PDF
The following slide showcases five level maturity model which can assist organization to assess and diagnose project health. Information covered in this slide is related to process, people and technology involved in different stages. Pitch your topic with ease and precision using this project management capability maturity model with process people and technology diagrams pdf. This layout presents information on process, technology, people, project management professional. It is also available for immediate download and adjustment. So, changes can be made in the color, design, graphics or any other component to create a unique layout.
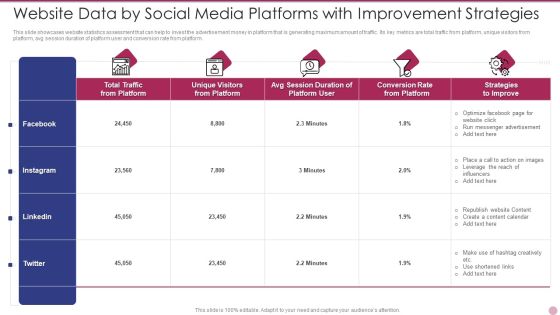
Website Data By Social Media Platforms With Improvement Strategies Diagrams PDF
This slide showcases website statistics assessment that can help to invest the advertisement money in platform that is generating maximum amount of traffic. Its key metrics are total traffic from platform, unique visitors from platform, avg session duration of platform user and conversion rate from platform. Showcasing this set of slides titled Website Data By Social Media Platforms With Improvement Strategies Diagrams PDF. The topics addressed in these templates are Strategies To Improve, Advertisement, Optimize. All the content presented in this PPT design is completely editable. Download it and make adjustments in color, background, font etc. as per your unique business setting.

Data Analytics Management Benefits Of Big Data Management For Business Diagrams PDF
This slide represents the benefits of big data for business, and it includes reduced costs, increased revenue, a boost in business efficiency, assessment of business finances, and so on.Presenting Data Analytics Management Benefits Of Big Data Management For Business Diagrams PDF to provide visual cues and insights. Share and navigate important information on six stages that need your due attention. This template can be used to pitch topics like Digital Technology, Reduce Business, Large Organizations. In addtion, this PPT design contains high resolution images, graphics, etc, that are easily editable and available for immediate download.

Addressing Staff Training Schedule With Cost Mobile Device Security Management Diagrams PDF
The employees will also require external training which will play important role in their development. The external training will be given by experts of various fields. This training will not be free, and charges will cost the firm per employee. Deliver an awe inspiring pitch with this creative Addressing Staff Training Schedule With Cost Mobile Device Security Management Diagrams PDF bundle. Topics like Advanced Skills, Coaching Sessions, Assessment Tools can be discussed with this completely editable template. It is available for immediate download depending on the needs and requirements of the user.

Strategic Playbook Sustaining Business During Pandemic Use Of Protective Equipment Diagrams PDF
This template depicts that employers are encouraged to complete a risk assessment to determine when and which protective equipment may be required. It also illustrates workers must use protective equipment as required by their employer. Presenting Strategic Playbook Sustaining Business During Pandemic Use Of Protective Equipment Diagrams PDF to provide visual cues and insights. Share and navigate important information on three stages that need your due attention. This template can be used to pitch topics like Masks And Respirators, Gloves, Face Shields. In addtion, this PPT design contains high resolution images, graphics, etc, that are easily editable and available for immediate download.

Procurement Plan For Project Requirements Management Project Managers Playbook Diagrams PDF
This slide provides information regarding work breakdown structure for agile software project budget assessment with various WBS items such as project management, hardware, software. This is a Procurement Plan For Project Requirements Management Project Managers Playbook Diagrams PDF template with various stages. Focus and dispense information on one stage using this creative set, that comes with editable features. It contains large content boxes to add your information on topics like Procurement Method, Estimated Component, Design Contract. You can also showcase facts, figures, and other relevant content using this PPT layout. Grab it now.

Cios Guide To Optimize Key Levers Associated To IT Cost Optimization Framework Diagrams PDF
This slide provides information regarding key levers associated to IT cost optimization framework to determine better cost optimization technique by assessing it on levers such as critical financial benefit, extent of organizational and technical risk, time and investment required and business impact. The best PPT templates are a great way to save time, energy, and resources. Slidegeeks have 100 percent editable powerpoint slides making them incredibly versatile. With these quality presentation templates, you can create a captivating and memorable presentation by combining visually appealing slides and effectively communicating your message. Download Cios Guide To Optimize Key Levers Associated To IT Cost Optimization Framework Diagrams PDF from Slidegeeks and deliver a wonderful presentation.

Staff Awareness Playbook Developing Game Plan For Employee Training Diagrams PDF
This slide provides information regarding game plan development for employer training by detecting requirements, defining goals, assessing imoact and determine investments. Want to ace your presentation in front of a live audience Our Staff Awareness Playbook Developing Game Plan For Staff Awareness Playbook Developing Game Plan For Employee Training Diagrams PDF can help you do that by engaging all the users towards you. Slidegeeks experts have put their efforts and expertise into creating these impeccable powerpoint presentations so that you can communicate your ideas clearly. Moreover, all the templates are customizable, and easy to edit and downloadable. Use these for both personal and commercial use.
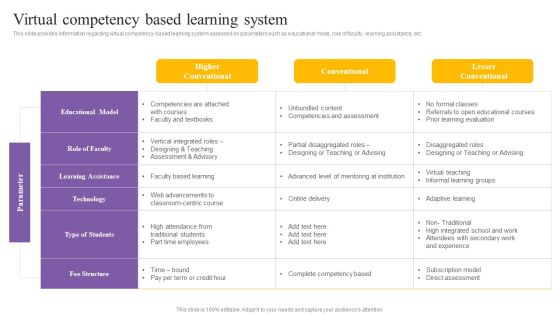
Digital Coaching And Learning Playbook Virtual Competency Based Learning System Diagrams PDF
This slide provides information regarding virtual competency based learning system assessed on parameters such as educational mode, role of faculty, learning assistance, etc. The best PPT templates are a great way to save time, energy, and resources. Slidegeeks have 100 percent editable powerpoint slides making them incredibly versatile. With these quality presentation templates, you can create a captivating and memorable presentation by combining visually appealing slides and effectively communicating your message. Download Digital Coaching And Learning Playbook Virtual Competency Based Learning System Diagrams PDF from Slidegeeks and deliver a wonderful presentation.
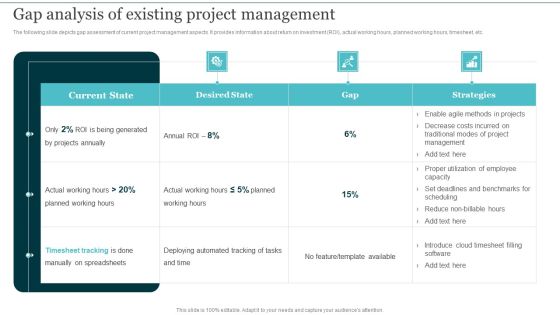
Gap Analysis Of Existing Project Management Integrating Cloud Computing To Enhance Projects Effectiveness Diagrams PDF
The following slide depicts gap assessment of current project management aspects. It provides information about return on investment ROI, actual working hours, planned working hours, timesheet, etc. If your project calls for a presentation, then Slidegeeks is your go to partner because we have professionally designed, easy to edit templates that are perfect for any presentation. After downloading, you can easily edit Gap Analysis Of Existing Project Management Integrating Cloud Computing To Enhance Projects Effectiveness Diagrams PDF and make the changes accordingly. You can rearrange slides or fill them with different images. Check out all the handy templates.

Boosting Yearly Business Revenue Key Supply Chain Management Strategies Diagrams PDF
This slide shows four strategies which can be used by supply chain managers to manage supply chain in an effective way. It includes setting up supply chain council, lean manufacturing, optimizing inventory management and regular assessment. Find a pre-designed and impeccable Boosting Yearly Business Revenue Key Supply Chain Management Strategies Diagrams PDF. The templates can ace your presentation without additional effort. You can download these easy-to-edit presentation templates to make your presentation stand out from others. So, what are you waiting for Download the template from Slidegeeks today and give a unique touch to your presentation.

 Home
Home