Feedback Loop Diagram
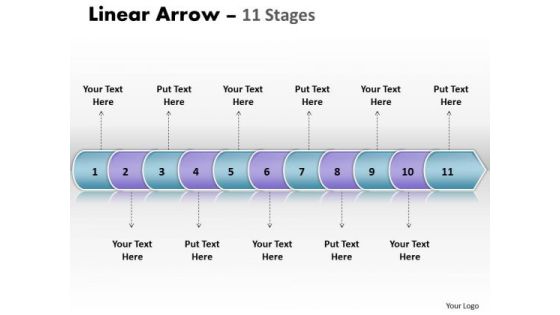
Usa Ppt Linear Arrow 11 Phase Diagram Business Management PowerPoint Image
USA PPT linear arrow 11 phase diagram business management powerpoint Image-This Linear Diagram is simple but nice enough to illustrate your thoughts and experiences to your staff. Explain in detail you assessment of the need for care to ensure continued smooth progress.-USA PPT linear arrow 11 phase diagram business management powerpoint Image-Arrow, Background, Collection, Completed, Concept, Confirmation, Design, Flow, Graph, Graphic, Illustration, Indication, Indicator, Information, Instruction, Interface, Internet, Layout, Measurement, Order, Phase, Pointer, Process, Progress, Reflection, Scale, Shape, Sign
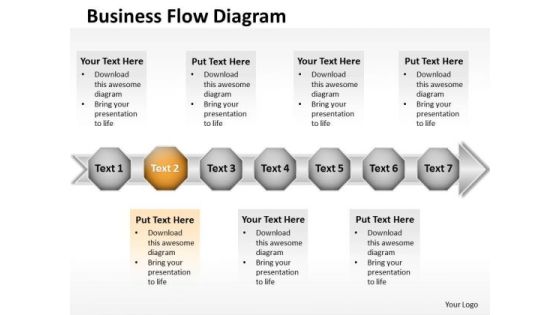
Ppt 7 Beeline Power Point Stage Business PowerPoint Theme Data Flow Diagram Templates
PPT 7 beeline power point stage business PowerPoint theme data flow diagram Templates-This PowerPoint Diagram shows Horizontal Demonstration through seven hexagonal boxes on the arrow pointing towards east direction signifying his completion of the process and leading towards success. This image has been conceived to enable you to emphatically communicate your ideas in your Business PPT presentations-PPT 7 beeline power point stage business PowerPoint theme data flow diagram Templates-arrow, art, assess, blue, business, chart, chevron, clip, clipart, colorful, compliance, corporate, design, development, diagram, flow, glossy, graphic, hierarchy, icon, illustration, implement, info graphic, levels, marketing, modern, plan, process, shape, shiny, square, stages, vector
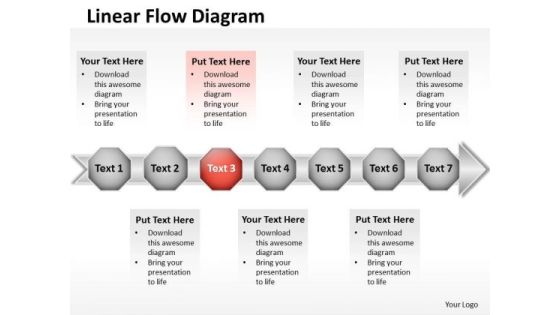
Ppt 7 Continual Stages Business Presentation Download Data Flow Diagram PowerPoint Templates
PPT 7 continual stages business presentation download data flow diagram PowerPoint Templates-This PowerPoint Diagram shows the Sequential Abstraction of steps which are involved in Marketing Process. It includes Seven Steps. Presently it is showing and describing the third stage which is highlighted by red color. An excellent graphic to attract the attention of your audience to improve earnings.-PPT 7 continual stages business presentation download data flow diagram PowerPoint Templates-arrow, art, assess, blue, business, chart, chevron, clip, clipart, colorful, compliance, corporate, design, development, diagram, flow, glossy, graphic, hierarchy, icon, illustration, implement, info graphic, levels, marketing, modern, plan, process, shape, shiny, square, stages, vector
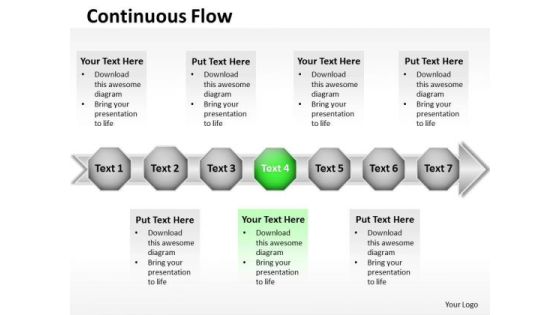
Ppt Green Stage Business Presentation Download Data Flow Diagram PowerPoint Templates
PPT green stage business presentation download data flow diagram PowerPoint Templates-This Detailed Flow Diagram displays the activities you may need to execute to achieve successful implementation and in-service management of your services program. You can show various processes with these linear designed Circular pieces on Arrow.-PPT green stage business presentation download data flow diagram PowerPoint Templates-arrow, art, assess, blue, business, chart, chevron, clip, clipart, colorful, compliance, corporate, design, development, diagram, flow, glossy, graphic, hierarchy, icon, illustration, implement, info graphic, levels, marketing, modern, plan, process, shape, shiny, square, stages, vector
Ppt Purple Stage New Business PowerPoint Presentation Data Flow Diagram Templates
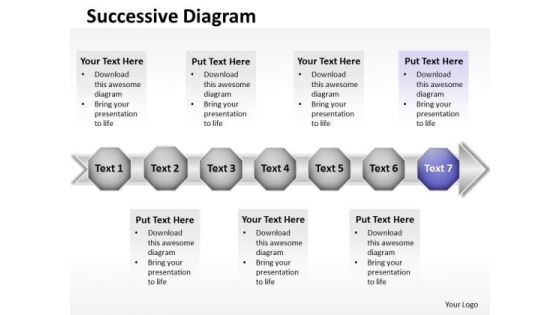
PPT purple stage new business PowerPoint presentation data flow diagram Templates-Develop competitive advantage with our above Diagram which contains a picture of seven hexagonal boxes on the arrow pointing towards the east direction. This image has been professionally designed to emphasize the concept of continuous process. Adjust the above image in your PPT presentations to visually support your content in your Business PPT slideshows.-PPT purple stage new business PowerPoint presentation data flow diagram Templates-arrow, art, assess, blue, business, chart, chevron, clip, clipart, colorful, compliance, corporate, design, development, diagram, flow, glossy, graphic, hierarchy, icon, illustration, implement, info graphic, levels, marketing, modern, plan, process, shape, shiny, square, stages, vector
Technology Evaluation Process Flow Chart Ppt PowerPoint Presentation Diagram Templates PDF
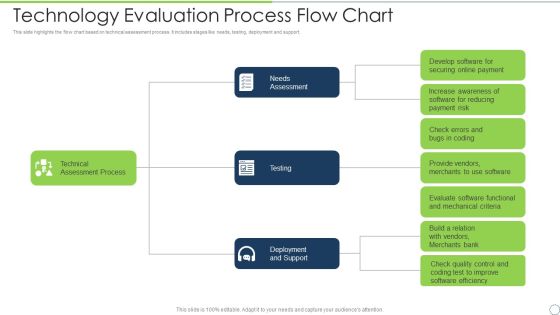
This slide highlights the flow chart based on technical assessment process. It includes stages like needs, testing, deployment and support. Presenting technology evaluation process flow chart ppt powerpoint presentation diagram templates pdf to dispense important information. This template comprises three stages. It also presents valuable insights into the topics including technical assessment process, deployment and support, needs assessment, testing. This is a completely customizable PowerPoint theme that can be put to use immediately. So, download it and address the topic impactfully.

Table Of Contents For Quality Evaluation Risk Ppt PowerPoint Presentation Diagram PDF
Find highly impressive Table Of Contents For Quality Evaluation Risk Ppt PowerPoint Presentation Diagram PDF on Slidegeeks to deliver a meaningful presentation. You can save an ample amount of time using these presentation templates. No need to worry to prepare everything from scratch because Slidegeeks experts have already done a huge research and work for you. You need to download Table Of Contents For Quality Evaluation Risk Ppt PowerPoint Presentation Diagram PDF for your upcoming presentation. All the presentation templates are 100 percent editable and you can change the color and personalize the content accordingly. Download now.

Five Level Funnel Diagram Interest Evaluation Sales Ppt PowerPoint Presentation Complete Deck
Presenting this set of slides with name five level funnel diagram interest evaluation sales ppt powerpoint presentation complete deck. The topics discussed in these slides are interest, evaluation, sales, strategic, success. This is a completely editable PowerPoint presentation and is available for immediate download. Download now and impress your audience.

Life Cycle Of It Investment Management Process Flow Diagram Ppt Model
This is a life cycle of it investment management process flow diagram ppt model. This is a three stage process. The stages in this process are commonwealth strategic planning process, pre select, select, evaluate, control, it investment portfolio management tool.

Example Of New Sales And Marketing Funnel Diagram Powerpoint Slides Background
This is a example of new sales and marketing funnel diagram powerpoint slides background. This is a five stage process. The stages in this process are purchase, evaluation, awareness, consideration, interest.

Comparative Assessment Of Software Used To Develop Entity Relationship Diagram Information PDF
This slide showcases comparative assessment of various software to develop entity relationship diagram and SQL. It provides information regarding software, features, price, free trail and user ratings. Pitch your topic with ease and precision using this Comparative Assessment Of Software Used To Develop Entity Relationship Diagram Information PDF. This layout presents information on DDL Statements, Relational Schemas, Price. It is also available for immediate download and adjustment. So, changes can be made in the color, design, graphics or any other component to create a unique layout.
Quantitative Risk Assessment Cause And Effect Diagram For Project Management Rules PDF
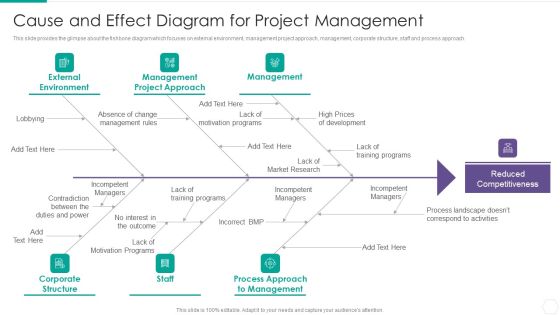
This slide provides the glimpse about the fishbone diagram which focuses on external environment, management project approach, management, corporate structure, staff and process approach. This is a Quantitative Risk Assessment Cause And Effect Diagram For Project Management Rules PDF template with various stages. Focus and dispense information on six stages using this creative set, that comes with editable features. It contains large content boxes to add your information on topics like Management, External Environment, Corporate Structure, Market. You can also showcase facts, figures, and other relevant content using this PPT layout. Grab it now.
Ppt Blue Stage Business PowerPoint Templates Free Download Data Flow Diagram
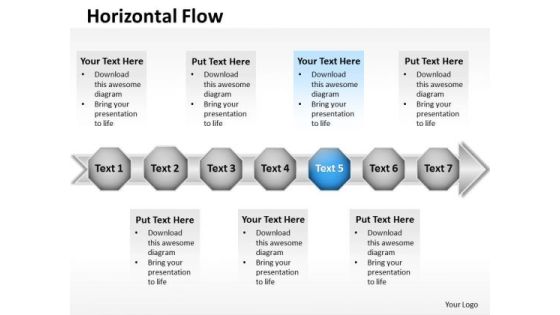
PPT blue stage business PowerPoint templates free download data flow diagram-Use this sequentially based PowerPoint Diagram to represent seven different approaches combined to form a Linear Process. It portrays the concept of convert, reclaim, recondition, recover, recycle , redeem, regenerate, remodel, reoccupy, repossess, rescue, restore, retake, salvage etc.-PPT blue stage business PowerPoint templates free download data flow diagram-arrow, art, assess, blue, business, chart, chevron, clip, clipart, colorful, compliance, corporate, design, development, diagram, flow, glossy, graphic, hierarchy, icon, illustration, implement, info graphic, levels, marketing, modern, plan, process, shape, shiny, square, stages, vector

Assessment Terminologies For Bid Assessment Process Ppt PowerPoint Presentation Diagram Images PDF
This slide shows various assessment terms used to score different tenders for organization. It include terms like excellent, good, acceptable etc. Showcasing this set of slides titled Assessment Terminologies For Bid AsAssessment Terminologies For Bid Assessment Process Ppt PowerPoint Presentation Diagram Images PDF. The topics addressed in these templates are Requirements, Innovation And Flexibility, Information. All the content presented in this PPT design is completely editable. Download it and make adjustments in color, background, font etc. as per your unique business setting.

Business Risk Assessment Decision Tree Diagram Ppt PowerPoint Presentation Outline Graphics Pictures PDF
Presenting this set of slides with name business risk assessment decision tree diagram ppt powerpoint presentation outline graphics pictures pdf. This is a four stage process. The stages in this process are income, high risk, credit history, debt. This is a completely editable PowerPoint presentation and is available for immediate download. Download now and impress your audience.

Tree Diagram For Root And Cause Assessment Ppt PowerPoint Presentation Gallery Information PDF
Presenting this set of slides with name tree diagram for root and cause assessment ppt powerpoint presentation gallery information pdf. This is a one stage process. The stages in this process are symptoms, problem, analysis. This is a completely editable PowerPoint presentation and is available for immediate download. Download now and impress your audience.

Evaluating Current Marketing Performance Of Organization Ppt PowerPoint Presentation Diagram Templates PDF
This slide showcases overview of current marketing performance that can help organization to determine issues in current promotional campaigns. Its key elements are website traffic, marketing budget and product sales Explore a selection of the finest Evaluating Current Marketing Performance Of Organization Ppt PowerPoint Presentation Diagram Templates PDF here. With a plethora of professionally designed and pre made slide templates, you can quickly and easily find the right one for your upcoming presentation. You can use our Evaluating Current Marketing Performance Of Organization Ppt PowerPoint Presentation Diagram Templates PDF to effectively convey your message to a wider audience. Slidegeeks has done a lot of research before preparing these presentation templates. The content can be personalized and the slides are highly editable. Grab templates today from Slidegeeks.

Substitutes For Leadership Presentation Diagrams
This is a substitutes for leadership presentation diagrams. This is a six stage process. The stages in this process are professional orientation, ability experience training, intrinsically satisfying task, advisory or staff support, cohesive work group, direct feedback from task.

Comparative Assessment Of Permission Based Marketing Solutions Ppt PowerPoint Presentation Diagram Images PDF
The following slide showcases comparative analysis of multiple marketing automation software which can help businesses conduct permission oriented campaigns. It provides information about customer dashboards, email marketing, push notifications, etc. Here you can discover an assortment of the finest PowerPoint and Google Slides templates. With these templates, you can create presentations for a variety of purposes while simultaneously providing your audience with an eye catching visual experience. Download Comparative Assessment Of Permission Based Marketing Solutions Ppt PowerPoint Presentation Diagram Images PDF to deliver an impeccable presentation. These templates will make your job of preparing presentations much quicker, yet still, maintain a high level of quality. Slidegeeks has experienced researchers who prepare these templates and write high quality content for you. Later on, you can personalize the content by editing the Comparative Assessment Of Permission Based Marketing Solutions Ppt PowerPoint Presentation Diagram Images PDF.

Strategic Options Assessment Tools And Techniques Ppt PowerPoint Presentation Diagram Images PDF
The slide covers tools and techniques of options evaluation to assess effectiveness of strategic business plan. It includes two techniques SAF analysis and RACES technique Persuade your audience using this Strategic Options Assessment Tools And Techniques Ppt PowerPoint Presentation Diagram Images PDF. This PPT design covers two stages, thus making it a great tool to use. It also caters to a variety of topics including Saf Analysis, Measure Suitability, Measuring Risk. Download this PPT design now to present a convincing pitch that not only emphasizes the topic but also showcases your presentation skills.
Sample Of Configuration Management Process And Change Control Diagram Ppt Icon
This is a sample of configuration management process and change control diagram ppt icon. This is a eight stage process. The stages in this process are optimization process, forecast asset class risks and returns, design benchmark, invest assets, establish tactical benchmark, establish strategic benchmark, evaluate asset performance versus tactical benchmark, evaluate tactical benchmark performance versus strategic benchmark.
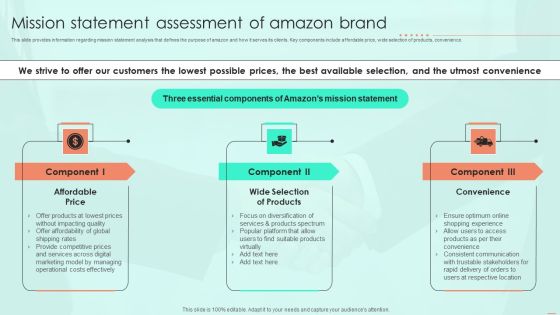
Mission Statement Assessment Of Amazon Brand Ppt PowerPoint Presentation Diagram Templates PDF
This slide provides information regarding mission statement analysis that defines the purpose of amazon and how it serves its clients. Key components include affordable price, wide selection of products, convenience. The best PPT templates are a great way to save time, energy, and resources. Slidegeeks have 100 percent editable powerpoint slides making them incredibly versatile. With these quality presentation templates, you can create a captivating and memorable presentation by combining visually appealing slides and effectively communicating your message. Download Mission Statement Assessment Of Amazon Brand Ppt PowerPoint Presentation Diagram Templates PDF from Slidegeeks and deliver a wonderful presentation.
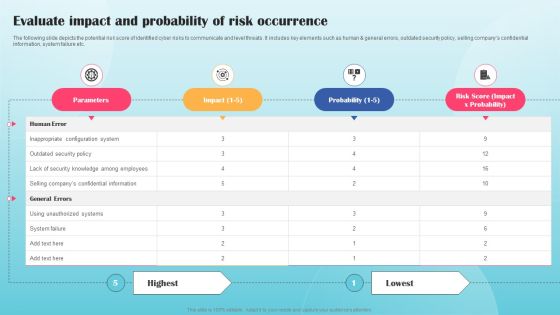
Evaluate Impact And Probability Of Risk Occurrence Ppt PowerPoint Presentation Diagram Images PDF
The following slide depicts the potential risk score of identified cyber risks to communicate and level threats. It includes key elements such as human and general errors, outdated security policy, selling companys confidential information, system failure etc. The best PPT templates are a great way to save time, energy, and resources. Slidegeeks have 100 percent editable powerpoint slides making them incredibly versatile. With these quality presentation templates, you can create a captivating and memorable presentation by combining visually appealing slides and effectively communicating your message. Download Evaluate Impact And Probability Of Risk Occurrence Ppt PowerPoint Presentation Diagram Images PDF from Slidegeeks and deliver a wonderful presentation.
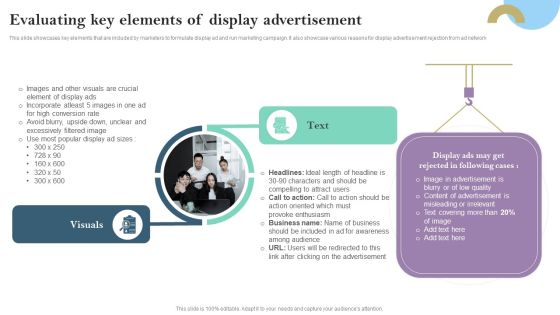
Evaluating Key Elements Of Display Advertisement Ppt PowerPoint Presentation Diagram Lists PDF
This slide showcases key elements that are included by marketers to formulate display ad and run marketing campaign. It also showcase various reasons for display advertisement rejection from ad network The Evaluating Key Elements Of Display Advertisement Ppt PowerPoint Presentation Diagram Lists PDF is a compilation of the most recent design trends as a series of slides. It is suitable for any subject or industry presentation, containing attractive visuals and photo spots for businesses to clearly express their messages. This template contains a variety of slides for the user to input data, such as structures to contrast two elements, bullet points, and slides for written information. Slidegeeks is prepared to create an impression.

Entity Relationship Diagram For Banking System Ppt Layouts Design Templates PDF
This slide showcases entity relationship diagram for banking systems which helps evaluate relationship of bank management with its database. It provides information regarding customers, employees, reports, transactions, logs and accounts. Presenting Entity Relationship Diagram For Banking System Ppt Layouts Design Templates PDF to dispense important information. This template comprises six stages. It also presents valuable insights into the topics including Customer, Employees, Reports, Accounts, Logs, Transactions. This is a completely customizable PowerPoint theme that can be put to use immediately. So, download it and address the topic impactfully.

Entity Relationship Diagram For Quality Management System Ppt Slides Example Introduction PDF
This slide showcases entity entity relationship diagram for quality management system which helps evaluate internal audits and process controls. It provides information regarding consumers, project development, material procurement and equipment planning. Presenting Entity Relationship Diagram For Quality Management System Ppt Slides Example Introduction PDF to dispense important information. This template comprises one stages. It also presents valuable insights into the topics including Consumers, Quotation Request, Specification Building, Valued Engineering. This is a completely customizable PowerPoint theme that can be put to use immediately. So, download it and address the topic impactfully.

Contents For QA Plan And Process Set 3 Checklist For Relations Diagram Structure PDF
Following slide displays a checklist that can be used by organizations for developing relations diagram. Sections covered here are particulars, status and remarks.This is a Contents For QA Plan And Process Set 3 Checklist For Relations Diagram Structure PDF template with various stages. Focus and dispense information on two stages using this creative set, that comes with editable features. It contains large content boxes to add your information on topics like Possible Relationship, Impact Assessment, Arrows Pointing You can also showcase facts, figures, and other relevant content using this PPT layout. Grab it now.

Cog Wheel Diagram For Consumer Engagement With Icons Ppt PowerPoint Presentation File Guide PDF
Presenting cog wheel diagram for consumer engagement with icons ppt powerpoint presentation file guide pdf to dispense important information. This template comprises three stages. It also presents valuable insights into the topics including customer retention, assessment of customer data, customer engagement. This is a completely customizable PowerPoint theme that can be put to use immediately. So, download it and address the topic impactfully.
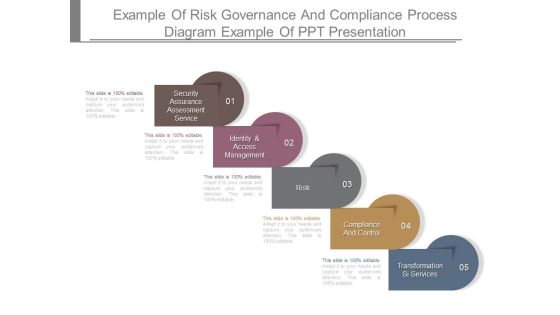
Example Of Risk Governance And Compliance Process Diagram Example Of Ppt Presentation
This is a example of risk governance and compliance process diagram example of ppt presentation. This is a five stage process. The stages in this process are security assurance assessment service, identity and access management, risk, compliance and control, transformation si services.
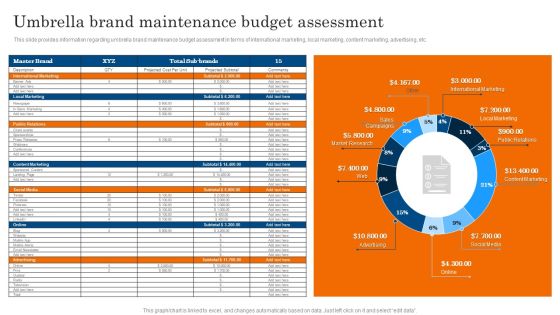
Umbrella Brand Maintenance Budget Assessment Ppt PowerPoint Presentation Diagram Lists PDF
This slide provides information regarding umbrella brand maintenance budget assessment in terms of international marketing, local marketing, content marketing, advertising, etc. Want to ace your presentation in front of a live audience. Our Umbrella Brand Maintenance Budget Assessment Ppt PowerPoint Presentation Diagram Lists PDF can help you do that by engaging all the users towards you. Slidegeeks experts have put their efforts and expertise into creating these impeccable powerpoint presentations so that you can communicate your ideas clearly. Moreover, all the templates are customizable, and easy-to-edit and downloadable. Use these for both personal and commercial use.
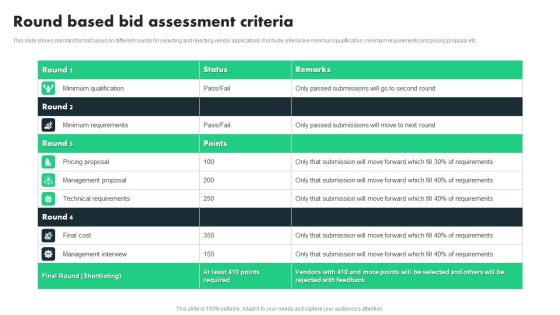
Round Based Bid Assessment Criteria Ppt PowerPoint Presentation Diagram Templates PDF
This slide shows standard format based on different rounds for selecting and rejecting vendor applications. It include criteria like minimum qualification, minimum requirements and pricing proposal etc. Showcasing this set of slides titled Round Based Bid Assessment Criteria Ppt PowerPoint Presentation Diagram Templates PDF. The topics addressed in these templates are Technical Requirements, Management Proposal, Pricing Proposal. All the content presented in this PPT design is completely editable. Download it and make adjustments in color, background, font etc. as per your unique business setting.

Ticket Prioritization Matrix With Impact Assessment Ppt PowerPoint Presentation Diagram PDF
This slide depicts ticket prioritization matrix with impact analysis. It provides information about operational halt, financial impact, reputational loss, most valuable person MVP user, workaround, alternate solution, etc. Want to ace your presentation in front of a live audience Our Ticket Prioritization Matrix With Impact Assessment Ppt PowerPoint Presentation Diagram PDF can help you do that by engaging all the users towards you. Slidegeeks experts have put their efforts and expertise into creating these impeccable powerpoint presentations so that you can communicate your ideas clearly. Moreover, all the templates are customizable, and easy to edit and downloadable. Use these for both personal and commercial use.

Steps To Implement Business And IT Alignment Ppt PowerPoint Presentation Diagram Graph Charts PDF
This slide represents business and information technology alignment steps. It includes identifying business drivers, creating IT vision, assessing current alignment, identifying alignment gaps, prioritizing IT initiatives, evaluating implementation options, creating implementation options, and adjusting IT strategy. Crafting an eye catching presentation has never been more straightforward. Let your presentation shine with this tasteful yet straightforward Steps To Implement Business And IT Alignment Ppt PowerPoint Presentation Diagram Graph Charts PDF template. It offers a minimalistic and classy look that is great for making a statement. The colors have been employed intelligently to add a bit of playfulness while still remaining professional. Construct the ideal Steps To Implement Business And IT Alignment Ppt PowerPoint Presentation Diagram Graph Charts PDF that effortlessly grabs the attention of your audience Begin now and be certain to wow your customers.

10 Diverging Stages Planning Process Diagram Circular Flow Spoke Network PowerPoint Slides
We present our 10 diverging stages planning process diagram Circular Flow Spoke Network PowerPoint Slides.Download and present our Arrows PowerPoint Templates because if making a mark is your obsession, then let others get Obsessed with you. Present our Business PowerPoint Templates because you have had a great year or so business wise. It is time to celebrate the efforts of your team. Download and present our Shapes PowerPoint Templates because with the help of our Slides you can Illustrate how each element flows seamlessly onto the next stage. Download our Process and Flows PowerPoint Templates because our Templates will enthuse your colleagues. Present our Flow charts PowerPoint Templates because you have the product you are very confident of and are very sure it will prove immensely popular with clients all over your target areas.Use these PowerPoint slides for presentations relating to Arrow, blue, business, chart, circle, concept, control, cycle, dark, design, development, diagram, evaluate, flow, flow-chart, flowchart, fresh, graphic, green, idea, infographic, iterative, life, life-cycle, lifecycle, management, method, model, old, orange, process, purple, quality, rainbow, red, research, retro, schema, spiral, step, strategy, success. The prominent colors used in the PowerPoint template are Red , Black, White. You can be sure our 10 diverging stages planning process diagram Circular Flow Spoke Network PowerPoint Slides are Perfect. Presenters tell us our chart PowerPoint templates and PPT Slides are Second to none. We assure you our 10 diverging stages planning process diagram Circular Flow Spoke Network PowerPoint Slides look good visually. Customers tell us our dark PowerPoint templates and PPT Slides are Tasteful. Presenters tell us our 10 diverging stages planning process diagram Circular Flow Spoke Network PowerPoint Slides are Attractive. You can be sure our business PowerPoint templates and PPT Slides are Majestic.
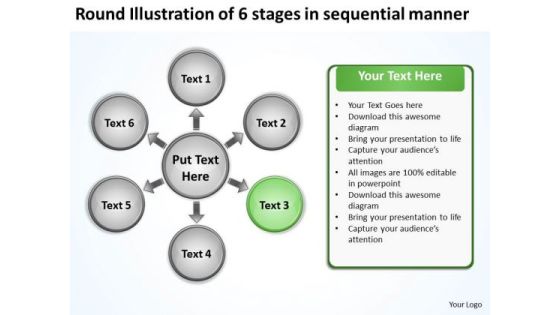
Illustration Of 6 Stages In Sequential Manner Business Circular Diagram PowerPoint Templates
We present our illustration of 6 stages in sequential manner business Circular Diagram PowerPoint templates.Use our Process and Flows PowerPoint Templates because our creative template will lay down your views. Use our Marketing PowerPoint Templates because they will Amplify your plans to have dedicated sub groups working on related but distinct tasks. Present our Business PowerPoint Templates because this business powerpoint template helps expound on the logic of your detailed thought process to take your company forward. Download and present our Circle Charts PowerPoint Templates because you know Coincidentally it will always point to the top. Present our Shapes PowerPoint Templates because activities which in themselves have many inherent business oppurtunities.Use these PowerPoint slides for presentations relating to Arrow, bio, business, chart,circle, concept, control, cycle, design,development, diagram, eco, ecology,environmental, evaluate, flow, flow,chart,flowchart, fresh, graphic, green, idea,infographic, iterative, life, lifecycle,management, method, model, natural,nature, organic, process, quality, recycle,research, schema, spiral, step, strategy,success, system. The prominent colors used in the PowerPoint template are Green, Black, White. Customers tell us our illustration of 6 stages in sequential manner business Circular Diagram PowerPoint templates are Versatile. Customers tell us our control PowerPoint templates and PPT Slides are Bold. Customers tell us our illustration of 6 stages in sequential manner business Circular Diagram PowerPoint templates are Fabulous. People tell us our chart PowerPoint templates and PPT Slides are Bright. Customers tell us our illustration of 6 stages in sequential manner business Circular Diagram PowerPoint templates will make the presenter look like a pro even if they are not computer savvy. Customers tell us our cycle PowerPoint templates and PPT Slides are Efficient.
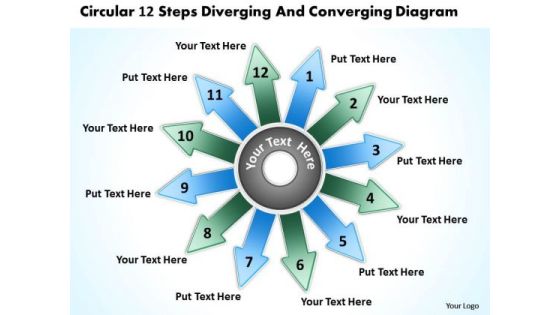
Circular 12 Steps Diverging And Converging Diagram Ppt Process PowerPoint Slides
We present our circular 12 steps diverging and converging diagram ppt Process PowerPoint Slides.Use our Arrows PowerPoint Templates because it will demonstrate the strength of character under severe stress. Shine the torch ahead and bring the light to shine on all. Use our Circle Charts PowerPoint Templates because this PPt slide helps you to measure key aspects of the current process and collect relevant data. Present our Shapes PowerPoint Templates because you have configured your targets, identified your goals as per priority and importance. Use our Business PowerPoint Templates because this slide will fire away with all the accuracy at your command. Download and present our Flow Charts PowerPoint Templates because this slide brings grey areas to the table and explain in detail you assessment of the need for care to ensure continued smooth progress.Use these PowerPoint slides for presentations relating to arrows, business, chart, circle, company, concept, continuity, continuous, cycle, dependency, diagram, direction, dynamic, endless, feeds, graph, iteration, iterative, method, path, phase, presentation, process, production, progress, progression, report, rotation, sequence, succession, vector. The prominent colors used in the PowerPoint template are Green, Blue, Gray. Presenters tell us our circular 12 steps diverging and converging diagram ppt Process PowerPoint Slides are readymade to fit into any presentation structure. You can be sure our continuity PowerPoint templates and PPT Slides are designed to make your presentations professional. Professionals tell us our circular 12 steps diverging and converging diagram ppt Process PowerPoint Slides are Bright. People tell us our continuous PowerPoint templates and PPT Slides are Festive. People tell us our circular 12 steps diverging and converging diagram ppt Process PowerPoint Slides are Tasteful. Professionals tell us our continuous PowerPoint templates and PPT Slides are Nostalgic.
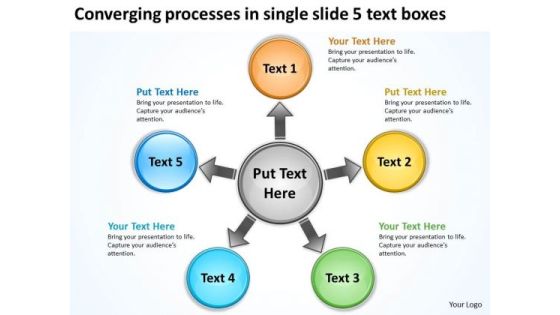
Processes In Single Slide 5 Text Boxes Arrows Diagram Software PowerPoint Templates
We present our processes in single slide 5 text boxes Arrows Diagram Software PowerPoint templates.Download our Circle Charts PowerPoint Templates because it expound on why you have discarded some plans as you went along to the apex and came out with the final selection which you know will make you and your team shine. Present our Arrows PowerPoint Templates because colours generate instant reactions in our brains. Use our Business PowerPoint Templates because it illustrates the city with a lasting tryst with resilience. You epitomise the qualities that give your city its fame. Download and present our Shapes PowerPoint Templates because it provides visual depictions of the flow of activities. Present our Flow Charts PowerPoint Templates because this slide brings grey areas to the table and explain in detail you assessment of the need for care to ensure continued smooth progress.Use these PowerPoint slides for presentations relating to 5, abstract, arrows, blank, business, central, centralized, chart, circle, circular, circulation, concept, conceptual, converging, design, diagram, empty, executive, five, icon, idea, illustration, management, map, mapping, mba, model, numbers, organization, outwards, pointing, procedure, process, radial, radiating, relationship, resource, sequence, sequential, square, strategy, template. The prominent colors used in the PowerPoint template are Yellow, Green, Blue. Customers tell us our processes in single slide 5 text boxes Arrows Diagram Software PowerPoint templates are Stunning. PowerPoint presentation experts tell us our circle PowerPoint templates and PPT Slides are Sparkling. People tell us our processes in single slide 5 text boxes Arrows Diagram Software PowerPoint templates are One-of-a-kind. People tell us our business PowerPoint templates and PPT Slides are visually appealing. Customers tell us our processes in single slide 5 text boxes Arrows Diagram Software PowerPoint templates are Stylish. People tell us our central PowerPoint templates and PPT Slides are Dynamic.

Analyzing Impact Of Performance Marketing Campaigns Ppt PowerPoint Presentation Diagram Images PDF
This slide showcases impact of performance marketing campaigns which can help organization to evaluate the effectiveness of executed plan. Its key elements are website traffic and product sales There are so many reasons you need a Analyzing Impact Of Performance Marketing Campaigns Ppt PowerPoint Presentation Diagram Images PDF. The first reason is you cannot spend time making everything from scratch, Thus, Slidegeeks has made presentation templates for you too. You can easily download these templates from our website easily.

Info Security Timeline For The Implementation Of Information Security Ppt PowerPoint Presentation Diagram Templates PDF
This slide shows the timeline for cyber security model implementation in an organization and the tasks to be performed every month. Deliver an awe inspiring pitch with this creative info security timeline for the implementation of information security ppt powerpoint presentation diagram templates pdf bundle. Topics like perform third party, vendor risk assessments, review and update, internal security documentation can be discussed with this completely editable template. It is available for immediate download depending on the needs and requirements of the user.

Spend Category Analysis And Management Dashboard Ppt PowerPoint Presentation Diagram PDF
The following slide showcases a dashboard to monitor and evaluate spending in procurement process. It includes key elements such as spend, suppliers, transactions, PO count, PR count, invoice count, spend by category, spend trend, 80 or 20 analysis, spend by region, spend by supplier and spend by contract. Do you have to make sure that everyone on your team knows about any specific topic I yes, then you should give Spend Category Analysis And Management Dashboard Ppt PowerPoint Presentation Diagram PDF a try. Our experts have put a lot of knowledge and effort into creating this impeccable Spend Category Analysis And Management Dashboard Ppt PowerPoint Presentation Diagram PDF. You can use this template for your upcoming presentations, as the slides are perfect to represent even the tiniest detail. You can download these templates from the Slidegeeks website and these are easy to edit. So grab these today.

Assessing Expansion Laws And Regulations In Different Countries Ppt PowerPoint Presentation Diagram Images PDF
This slide showcases laws and regulations that can be analysed by organization before expanding into global market. It also shows agencies that govern local laws and regulations.Coming up with a presentation necessitates that the majority of the effort goes into the content and the message you intend to convey. The visuals of a PowerPoint presentation can only be effective if it supplements and supports the story that is being told. Keeping this in mind our experts created Assessing Expansion Laws And Regulations In Different Countries Ppt PowerPoint Presentation Diagram Images PDF to reduce the time that goes into designing the presentation. This way, you can concentrate on the message while our designers take care of providing you with the right template for the situation.
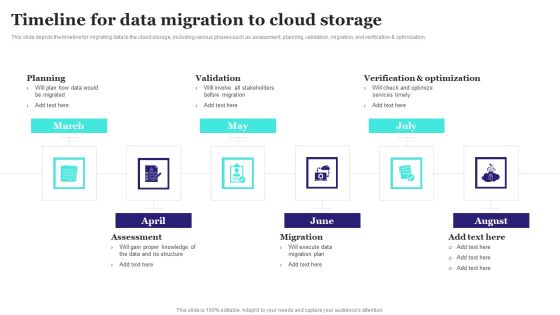
Timeline For Data Migration To Cloud Storage Ppt PowerPoint Presentation Diagram Graph Charts PDF
This slide depicts the timeline for migrating data to the cloud storage, including various phases such as assessment, planning, validation, migration, and verification and optimization. Do you have an important presentation coming up Are you looking for something that will make your presentation stand out from the rest Look no further than Timeline For Data Migration To Cloud Storage Ppt PowerPoint Presentation Diagram Graph Charts PDF. With our professional designs, you can trust that your presentation will pop and make delivering it a smooth process. And with Slidegeeks, you can trust that your presentation will be unique and memorable. So why wait Grab Timeline For Data Migration To Cloud Storage Ppt PowerPoint Presentation Diagram Graph Charts PDF today and make your presentation stand out from the rest.

Process Of Conducting Market Analysis For Business Ppt PowerPoint Presentation Diagram PDF
The following slide showcases four step process of conducting market analysis. The process begins with describing industry, identifying target market, evaluating competitor, and projecting organization sales. If you are looking for a format to display your unique thoughts, then the professionally designed Process Of Conducting Market Analysis For Business Ppt PowerPoint Presentation Diagram PDF is the one for you. You can use it as a Google Slides template or a PowerPoint template. Incorporate impressive visuals, symbols, images, and other charts. Modify or reorganize the text boxes as you desire. Experiment with shade schemes and font pairings. Alter, share or cooperate with other people on your work. Download Process Of Conducting Market Analysis For Business Ppt PowerPoint Presentation Diagram PDF and find out how to give a successful presentation. Present a perfect display to your team and make your presentation unforgettable.

A B Testing Strategy To Effectively Run Facebook Ads Ppt PowerPoint Presentation Diagram PDF
The following slide outlines A or B testing technique through which advertisers can evaluate effectiveness of different ad variations and make data-driven decisions. It provides information about key metrics such as total clicks, reach, and conversion rate. If you are looking for a format to display your unique thoughts, then the professionally designed A B Testing Strategy To Effectively Run Facebook Ads Ppt PowerPoint Presentation Diagram PDF is the one for you. You can use it as a Google Slides template or a PowerPoint template. Incorporate impressive visuals, symbols, images, and other charts. Modify or reorganize the text boxes as you desire. Experiment with shade schemes and font pairings. Alter, share or cooperate with other people on your work. Download A B Testing Strategy To Effectively Run Facebook Ads Ppt PowerPoint Presentation Diagram PDF and find out how to give a successful presentation. Present a perfect display to your team and make your presentation unforgettable.
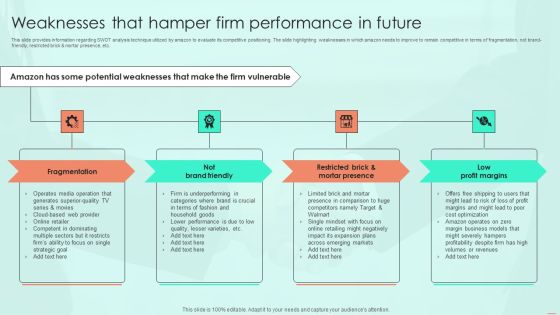
Weaknesses That Hamper Firm Performance In Future Ppt PowerPoint Presentation Diagram Templates PDF
This slide provides information regarding SWOT analysis technique utilized by amazon to evaluate its competitive positioning. The slide highlighting weaknesses in which amazon needs to improve to remain competitive in terms of fragmentation, not brand friendly, restricted brick and mortar presence, etc. Whether you have daily or monthly meetings, a brilliant presentation is necessary. Weaknesses That Hamper Firm Performance In Future Ppt PowerPoint Presentation Diagram Templates PDF can be your best option for delivering a presentation. Represent everything in detail using Weaknesses That Hamper Firm Performance In Future Ppt PowerPoint Presentation Diagram Templates PDF and make yourself stand out in meetings. The template is versatile and follows a structure that will cater to your requirements. All the templates prepared by Slidegeeks are easy to download and edit. Our research experts have taken care of the corporate themes as well. So, give it a try and see the results.
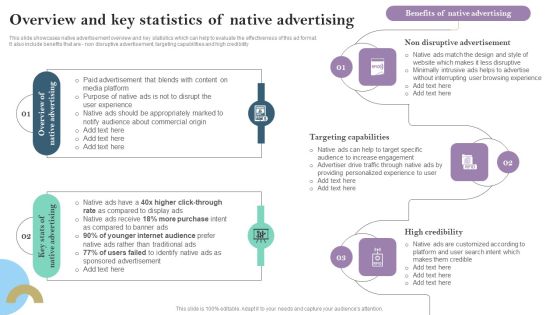
Overview And Key Statistics Of Native Advertising Ppt PowerPoint Presentation Diagram Lists PDF
This slide showcases native advertisement overview and key statistics which can help to evaluate the effectiveness of this ad format. It also include benefits that are non disruptive advertisement, targeting capabilities and high credibility Create an editable Overview And Key Statistics Of Native Advertising Ppt PowerPoint Presentation Diagram Lists PDF that communicates your idea and engages your audience. Whether youre presenting a business or an educational presentation, pre designed presentation templates help save time. Overview And Key Statistics Of Native Advertising Ppt PowerPoint Presentation Diagram Lists PDF is highly customizable and very easy to edit, covering many different styles from creative to business presentations. Slidegeeks has creative team members who have crafted amazing templates. So, go and get them without any delay.

Calculating Return On Investment Of Performance Marketing Advertisement Campaigns Ppt PowerPoint Presentation Diagram Lists PDF
This slide showcases calculation of advertisement returns which can help organization to evaluate the results of performance marketing campaign and optimize budget accordingly. Its key elements are cost per click, number of clicks, leads generated, revenue generated etc. Do you have to make sure that everyone on your team knows about any specific topic I yes, then you should give Calculating Return On Investment Of Performance Marketing Advertisement Campaigns Ppt PowerPoint Presentation Diagram Lists PDF a try. Our experts have put a lot of knowledge and effort into creating this impeccable Calculating Return On Investment Of Performance Marketing Advertisement Campaigns Ppt PowerPoint Presentation Diagram Lists PDF. You can use this template for your upcoming presentations, as the slides are perfect to represent even the tiniest detail. You can download these templates from the Slidegeeks website and these are easy to edit. So grab these today.

Overview And Benefits Of Performance Driven Influencer Marketing Ppt PowerPoint Presentation Diagram PDF
This slide showcases performance driven influencer marketing overview and key statistics that can help to evaluate the effectiveness of this format. It also include benefits that are measurable campaigns and cost effectiveness Do you have to make sure that everyone on your team knows about any specific topic I yes, then you should give Overview And Benefits Of Performance Driven Influencer Marketing Ppt PowerPoint Presentation Diagram PDF a try. Our experts have put a lot of knowledge and effort into creating this impeccable Overview And Benefits Of Performance Driven Influencer Marketing Ppt PowerPoint Presentation Diagram PDF. You can use this template for your upcoming presentations, as the slides are perfect to represent even the tiniest detail. You can download these templates from the Slidegeeks website and these are easy to edit. So grab these today.

5 Stages Business Process Diagram Ppt Personal Plan Template PowerPoint Slides
We present our 5 stages business process diagram ppt personal plan template PowerPoint Slides .Download and present our Arrows PowerPoint Templates because Our PowerPoint Templates and Slides help you pinpoint your timelines. Highlight the reasons for your deadlines with their use. Present our Business PowerPoint Templates because It can Conjure up grand ideas with our magical PowerPoint Templates and Slides. Leave everyone awestruck by the end of your presentation. Download our Finance PowerPoint Templates because Our PowerPoint Templates and Slides come in all colours, shades and hues. They help highlight every nuance of your views. Use our Process and Flows PowerPoint Templates because You can Stir your ideas in the cauldron of our PowerPoint Templates and Slides. Cast a magic spell on your audience. Present our Flow Charts PowerPoint Templates because Our PowerPoint Templates and Slides will let you meet your Deadlines.Use these PowerPoint slides for presentations relating to 3d, analyze, arrow, assess, background, business, chart, chevron, diagram, financial, five, graphic, gray, icon, implement, improvement, orange, silver, vector, white . The prominent colors used in the PowerPoint template are Orange, Gray, White. Customers tell us our 5 stages business process diagram ppt personal plan template PowerPoint Slides are effectively colour coded to prioritise your plans They automatically highlight the sequence of events you desire. Customers tell us our background PowerPoint templates and PPT Slides will make the presenter successul in his career/life. We assure you our 5 stages business process diagram ppt personal plan template PowerPoint Slides are aesthetically designed to attract attention. We guarantee that they will grab all the eyeballs you need. Customers tell us our business PowerPoint templates and PPT Slides will get their audience's attention. Professionals tell us our 5 stages business process diagram ppt personal plan template PowerPoint Slides are designed by a team of presentation professionals. PowerPoint presentation experts tell us our diagram PowerPoint templates and PPT Slides are specially created by a professional team with vast experience. They diligently strive to come up with the right vehicle for your brilliant Ideas.

Measuring The Effectiveness Of Next Generation HR Service Delivery Model Ppt PowerPoint Presentation Diagram Images PDF
This slide shows various factors basis on which the effectiveness and efficiency of next generation HR service delivery model implementation can be judged. Also, this assessment is done in order to ensure that HR service delivery is aligned with companys overall strategy, values and behaviors. Explore a selection of the finest Measuring The Effectiveness Of Next Generation HR Service Delivery Model Ppt PowerPoint Presentation Diagram Images PDF here. With a plethora of professionally designed and pre made slide templates, you can quickly and easily find the right one for your upcoming presentation. You can use our Measuring The Effectiveness Of Next Generation HR Service Delivery Model Ppt PowerPoint Presentation Diagram Images PDF to effectively convey your message to a wider audience. Slidegeeks has done a lot of research before preparing these presentation templates. The content can be personalized and the slides are highly editable. Grab templates today from Slidegeeks.

Business Life Cycle Diagram Download Ppt PowerPoint Templates Backgrounds For Slides
We present our business life cycle diagram download ppt PowerPoint templates backgrounds for slides.Download and present our Process and Flows PowerPoint Templates because You are an avid believer in ethical practices. Highlight the benefits that accrue with our PowerPoint Templates and Slides. Download our Arrows PowerPoint Templates because Our PowerPoint Templates and Slides are topically designed to provide an attractive backdrop to any subject. Present our Success PowerPoint Templates because It can be used to Set your controls for the heart of the sun. Our PowerPoint Templates and Slides will be the propellant to get you there. Use our Flow Charts PowerPoint Templates because It will mark the footprints of your journey. Illustrate how they will lead you to your desired destination. Download and present our Shapes PowerPoint Templates because Our PowerPoint Templates and Slides ensures Effective communication. They help you put across your views with precision and clarity.Use these PowerPoint slides for presentations relating to Arrow, art, business, chart, circle, collection, color, colorful, concept, control, creative, cycle, design, development, diagram, element, evaluate, flow, flow-chart, flowchart, graphic, life, cycle, lifecycle, management, method, model, palette, process, quality, rainbow, research, schema, sign, spectrum, spiral, step, strategy, success. The prominent colors used in the PowerPoint template are Red, Gray, White. People tell us our business life cycle diagram download ppt PowerPoint templates backgrounds for slides will get their audience's attention. PowerPoint presentation experts tell us our business PowerPoint templates and PPT Slides will generate and maintain the level of interest you desire. They will create the impression you want to imprint on your audience. Presenters tell us our business life cycle diagram download ppt PowerPoint templates backgrounds for slides will make the presenter look like a pro even if they are not computer savvy. Use our chart PowerPoint templates and PPT Slides provide you with a vast range of viable options. Select the appropriate ones and just fill in your text. Customers tell us our business life cycle diagram download ppt PowerPoint templates backgrounds for slides provide great value for your money. Be assured of finding the best projection to highlight your words. People tell us our collection PowerPoint templates and PPT Slides are second to none.

Competitive Assessment Ppt Diagrams
This is a competitive assessment ppt diagrams. This is a two stage process. The stages in this process are competitive advantage.

Measuring Brand Awareness Through Social Media Platforms Ppt PowerPoint Presentation Diagram Graph Charts PDF
The following slide outlines various key performance indicators KPIs through which marketers can evaluate brand awareness on social media channels such as Facebook, Instagram, LinkedIn, Twitter, and YouTube. The metrics mentioned are brand impressions, reach, engagement rate, followers growth, story views, etc. The best PPT templates are a great way to save time, energy, and resources. Slidegeeks have 100 percent editable powerpoint slides making them incredibly versatile. With these quality presentation templates, you can create a captivating and memorable presentation by combining visually appealing slides and effectively communicating your message. Download Measuring Brand Awareness Through Social Media Platforms Ppt PowerPoint Presentation Diagram Graph Charts PDF from Slidegeeks and deliver a wonderful presentation.

Brand Analytics KPI Dashboard For Organization Ppt PowerPoint Presentation Diagram PDF
The following slide outlines key performance indicator KPI dashboard that can assist marketers to evaluate brand performance on social media channels. The metrics covered are age group, gender, brand perception, branding themes, celebrity analysis, etc. Take your projects to the next level with our ultimate collection of Brand Analytics KPI Dashboard For Organization Ppt PowerPoint Presentation Diagram PDF. Slidegeeks has designed a range of layouts that are perfect for representing task or activity duration, keeping track of all your deadlines at a glance. Tailor these designs to your exact needs and give them a truly corporate look with your own brand colors they will make your projects stand out from the rest.

3d Step By Diagram 5 Stages Construction Business Plan Template PowerPoint Slides
We present our 3d step by diagram 5 stages construction business plan template PowerPoint Slides.Present our Competition PowerPoint Templates because You can Be the star of the show with our PowerPoint Templates and Slides. Rock the stage with your ideas. Present our Advertising PowerPoint Templates because You are working at that stage with an air of royalty. Let our PowerPoint Templates and Slides be the jewels in your crown. Download our Ladders PowerPoint Templates because Our PowerPoint Templates and Slides will let your ideas bloom. Create a bed of roses for your audience. Present our Business PowerPoint Templates because Our PowerPoint Templates and Slides will let you Leave a lasting impression to your audiences. They possess an inherent longstanding recall factor. Download our Circle Charts PowerPoint Templates because Our PowerPoint Templates and Slides team portray an attitude of elegance. Personify this quality by using them regularly.Use these PowerPoint slides for presentations relating to Risk, assess, plan, step, process, project, implement, integration, action, flow, training, information, organigram, chart, design, context, 3d, success, diagram, raise, graphic, description, materialize, identify, positive, management, proximity, monetary, evaluate, objective, estimate, assumption, schematic, quality, realize, effect, register, software, respond, methodology. The prominent colors used in the PowerPoint template are Pink, Blue, Green.

Digital Media Buying Plan Procedure Ppt PowerPoint Presentation Diagram Templates PDF
The slide shows various steps of media buying strategy to improve conversion rates and get more closed leads. Steps included are media buying strategy formulation, media planning, media placement, data collection and data evaluation. Persuade your audience using this Digital Media Buying Plan Procedure Ppt PowerPoint Presentation Diagram Templates PDF. This PPT design covers four stages, thus making it a great tool to use. It also caters to a variety of topics including Strategy Formulation, Media Planning, Media Placement. Download this PPT design now to present a convincing pitch that not only emphasizes the topic but also showcases your presentation skills.

Strengths That Leverage Firm To Gain Competitive Edge Ppt PowerPoint Presentation Diagram PDF
This slide provides information regarding SWOT analysis technique utilized by amazon to evaluate its competitive positioning. The slide highlighting strengths in which amazon excels in terms of data, exclusive prime membership, global recognition, etc. If your project calls for a presentation, then Slidegeeks is your go to partner because we have professionally designed, easy to edit templates that are perfect for any presentation. After downloading, you can easily edit Strengths That Leverage Firm To Gain Competitive Edge Ppt PowerPoint Presentation Diagram PDF and make the changes accordingly. You can rearrange slides or fill them with different images. Check out all the handy templates

Analysing Criteria For Acceptability Of Strategic Options Ppt PowerPoint Presentation Diagram Lists PDF
This slide provides glimpse about key success criteria that can help business to evaluate acceptability of chosen strategic option. It includes factors such as return, profitability, cost benefit, risk, stakeholders reactions, etc. Take your projects to the next level with our ultimate collection of Analysing Criteria For Acceptability Of Strategic Options Ppt PowerPoint Presentation Diagram Lists PDF. Slidegeeks has designed a range of layouts that are perfect for representing task or activity duration, keeping track of all your deadlines at a glance. Tailor these designs to your exact needs and give them a truly corporate look with your own brand colors they will make your projects stand out from the rest.

Business Process Diagram Examples Concept Ppt 5 PowerPoint Templates Backgrounds For Slides
We present our business process diagram examples concept ppt 5 PowerPoint templates backgrounds for slides.Present our Business PowerPoint Templates because You have a driving passion to excel in your field. Our PowerPoint Templates and Slides will prove ideal vehicles for your ideas. Present our Circle Charts PowerPoint Templates because Our PowerPoint Templates and Slides will let Your superior ideas hit the target always and everytime. Present our Shapes PowerPoint Templates because Our PowerPoint Templates and Slides come in all colours, shades and hues. They help highlight every nuance of your views. Download our Process and Flows PowerPoint Templates because They will Put the wind in your sails. Skim smoothly over the choppy waters of the market. Download our Leadership PowerPoint Templates because It will Give impetus to the hopes of your colleagues. Our PowerPoint Templates and Slides will aid you in winning their trust.Use these PowerPoint slides for presentations relating to project, flow, process, business, system, success, chart, work, innovation, implementation, plan, concept, evaluation, presentation, symbol, internet, diagram, analysis, flowchart, analyzing, technology, idea, development, management, steps, strategy, addie, design, outcome, assessment, structure. The prominent colors used in the PowerPoint template are Blue light, Gray, White.
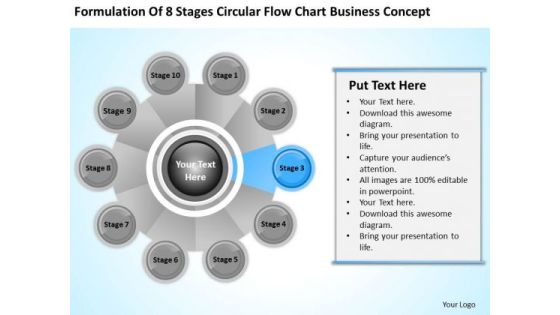
Business Process Diagram Examples Concept Ppt PowerPoint Templates Backgrounds For Slide
We present our business process diagram examples concept ppt PowerPoint templates backgrounds for slide.Download and present our Business PowerPoint Templates because Our PowerPoint Templates and Slides will definately Enhance the stature of your presentation. Adorn the beauty of your thoughts with their colourful backgrounds. Download our Circle Charts PowerPoint Templates because you can Add colour to your speech with our PowerPoint Templates and Slides. Your presentation will leave your audience speechless. Use our Shapes PowerPoint Templates because Our PowerPoint Templates and Slides have the Brilliant backdrops. Guaranteed to illuminate the minds of your audience. Use our Process and Flows PowerPoint Templates because It can Bubble and burst with your ideas. Use our Leadership PowerPoint Templates because Our PowerPoint Templates and Slides will steer your racing mind. Hit the right buttons and spur on your audience.Use these PowerPoint slides for presentations relating to project, flow, process, business, system, success, chart, work, innovation, implementation, plan, concept, evaluation, presentation, symbol, internet, diagram, analysis, flowchart, analyzing, technology, idea, development, management, steps, strategy, addie, design, outcome, assessment, structure. The prominent colors used in the PowerPoint template are Blue light, Gray, White.

 Home
Home