Features List

Business Threats Landscape Dashboard With Cyber Attacks Analysis Ppt Summary Brochure PDF
This slide illustrates risk landscape dashboard with cyber attacks analysis which contains malware attack frequency, country wise attacks, top 10 attacks, etc. It can assist IT managers in analyzing top threats so that they can be dealt with proper efficiency. Pitch your topic with ease and precision using this Business Threats Landscape Dashboard With Cyber Attacks Analysis Ppt Summary Brochure PDF. This layout presents information on Malware Attack Frequency, Every Minute, Every Second. It is also available for immediate download and adjustment. So, changes can be made in the color, design, graphics or any other component to create a unique layout.

Change Order Administration Dashboard With Priority Assessment Ppt Portfolio Inspiration PDF
This slide showcases change order management dashboard with priority assessment. It provides information about order stats, summary, latest change orders and priority according to rank. Pitch your topic with ease and precision using this Change Order Administration Dashboard With Priority Assessment Ppt Portfolio Inspiration PDF. This layout presents information on Change Orders Priority, Change Order Stats, Change Orders Summary. It is also available for immediate download and adjustment. So, changes can be made in the color, design, graphics or any other component to create a unique layout.

E Commerce Business Sales Monthly Forecast Graph Ppt Infographics Show PDF
This slide shows the table and graph representing monthly sales forecast of an e-commerce business. It shows details related to the expected growth rate, historical data, projected data and actual growth of sales. Pitch your topic with ease and precision using this E Commerce Business Sales Monthly Forecast Graph Ppt Infographics Show PDF. This layout presents information on Expected Growth Rate, Historical, Actual Growth Rate. It is also available for immediate download and adjustment. So, changes can be made in the color, design, graphics or any other component to create a unique layout.

Improving Effective Human Resource Communication Impact On Employee Engagement Dashboard Slides PDF
This slide shows the dashboard representing the impact of effective hr communication within the organization on employee engagement score. It shows details related to engagement score, response rate, engagement score of teams, net promoter score etc. Pitch your topic with ease and precision using this Improving Effective Human Resource Communication Impact On Employee Engagement Dashboard Slides PDF. This layout presents information on Engagement Score, Response Rate, Engagement Score Levels. It is also available for immediate download and adjustment. So, changes can be made in the color, design, graphics or any other component to create a unique layout.
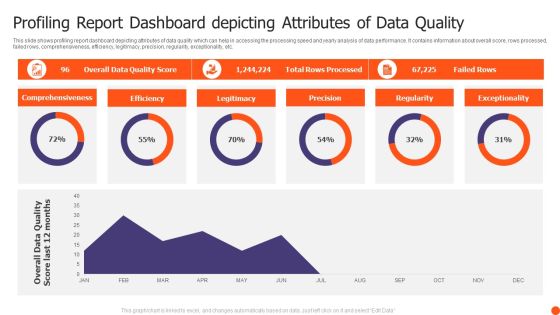
Profiling Report Dashboard Depicting Attributes Of Data Quality Themes PDF
This slide shows profiling report dashboard depicting attributes of data quality which can help in accessing the processing speed and yearly analysis of data performance. It contains information about overall score, rows processed, failed rows, comprehensiveness, efficiency, legitimacy, precision, regularity, exceptionality, etc. Pitch your topic with ease and precision using this Profiling Report Dashboard Depicting Attributes Of Data Quality Themes PDF. This layout presents information on Comprehensiveness, Efficiency, Legitimacy, Precision. It is also available for immediate download and adjustment. So, changes can be made in the color, design, graphics or any other component to create a unique layout.

Network Risks Management And Barriers Dashboard Ppt PowerPoint Presentation Gallery Graphic Tips PDF
This slide represents a dashboard of network risk management. It also includes problem servers , workstations and their status, unmonitored network devices. Pitch your topic with ease and precision using this Network Risks Management And Barriers Dashboard Ppt PowerPoint Presentation Gallery Graphic Tips PDF. This layout presents information on Problem Servers, Server Status, Problem Workstations, Workstation Status. It is also available for immediate download and adjustment. So, changes can be made in the color, design, graphics or any other component to create a unique layout.

Attain Production Goals And Objectives Graph And Table Ppt Infographic Template Visuals PDF
This slide displays graphical representation of targeted and achieved production variance. It also includes critical insights such as target units, achieved production, achieved percentage, overachieved percentage, etc. Pitch your topic with ease and precision using this Attain Production Goals And Objectives Graph And Table Ppt Infographic Template Visuals PDF. This layout presents information on Target Vs Achieved, Key insight Table, Quarterly. It is also available for immediate download and adjustment. So, changes can be made in the color, design, graphics or any other component to create a unique layout.

Continuous Integration Dashboard For Automated Testing Framework Ppt Layouts Layout Ideas PDF
This slide shows continuous integration dashboard for test automation framework which can be referred by authors to review their testing performance. It contains information about weekly change volume by author, monthly change volume by author, repository, etc. Pitch your topic with ease and precision using this Continuous Integration Dashboard For Automated Testing Framework Ppt Layouts Layout Ideas PDF. This layout presents information on Total Changes Volume, Monthly Change Volume, Weekly Change Volume. It is also available for immediate download and adjustment. So, changes can be made in the color, design, graphics or any other component to create a unique layout.

Customer NPS Metric Dashboard For Call Centers Ppt Inspiration Smartart PDF
This slide shows net promoter score dashboard for call centers which contains occupancy rate, tickets unassigned, opened tickets, completed tickets and raised tickets. It also has details on resolution rate on first call, enquiries, etc. Pitch your topic with ease and precision using this Customer NPS Metric Dashboard For Call Centers Ppt Inspiration Smartart PDF. This layout presents information on Occupancy Rate, Resolution Rate, Net Promoter Score. It is also available for immediate download and adjustment. So, changes can be made in the color, design, graphics or any other component to create a unique layout.

Customer NPS Metric Statistics Of Banking Industry Ppt Styles Microsoft PDF
This slide illustrates statistics of net promoter score NPS in banking industry. It provides information about summary, personal banking, business banking and wealth management. Pitch your topic with ease and precision using this Customer NPS Metric Statistics Of Banking Industry Ppt Styles Microsoft PDF. This layout presents information on Summary, Personal Banking, Business Banking, Wealth Management. It is also available for immediate download and adjustment. So, changes can be made in the color, design, graphics or any other component to create a unique layout.
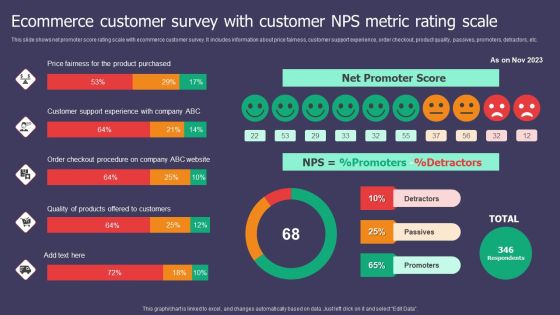
Ecommerce Customer Survey With Customer NPS Metric Rating Scale Ppt Inspiration Visual Aids PDF
This slide shows net promoter score rating scale with ecommerce customer survey. It includes information about price fairness, customer support experience, order checkout, product quality, passives, promoters, detractors, etc. Pitch your topic with ease and precision using this Ecommerce Customer Survey With Customer NPS Metric Rating Scale Ppt Inspiration Visual Aids PDF. This layout presents information on Net Promoter Score, Price Fairness, Product Purchased. It is also available for immediate download and adjustment. So, changes can be made in the color, design, graphics or any other component to create a unique layout.

Budget And Time Forecast Dashboard For Project Management Ppt Pictures Format Ideas PDF
This slide represents the dashboard for cost and time estimation of the organizational product which gives a clear view of the health, time, tasks, cost, progress rate and completion of project status to help the management to effectively estimate its success or failure and make changes accordingly. Pitch your topic with ease and precision using this Budget And Time Forecast Dashboard For Project Management Ppt Pictures Format Ideas PDF. This layout presents information on Health, Progress, Cost, Workload. It is also available for immediate download and adjustment. So, changes can be made in the color, design, graphics or any other component to create a unique layout.

Sales Performance Monitoring Dashboard With Customer Details Ppt Infographics Themes PDF
This slide illustrates sales performance tracking dashboard with critical information. It provides information about customer details, invoice, earnings, leads, pending delivery, revenue, etc. Pitch your topic with ease and precision using this Sales Performance Monitoring Dashboard With Customer Details Ppt Infographics Themes PDF. This layout presents information on Todays Revenue, Today Delivered, Pending Delivery, Total Leads. It is also available for immediate download and adjustment. So, changes can be made in the color, design, graphics or any other component to create a unique layout.
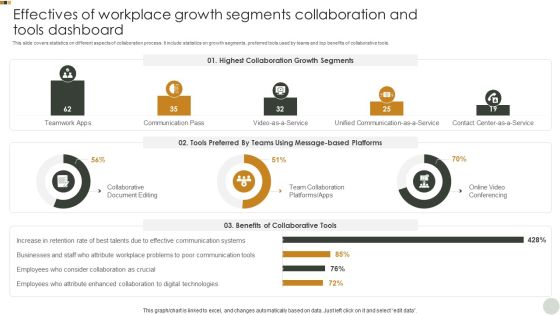
Effectives Of Workplace Growth Segments Collaboration And Tools Dashboard Graphics PDF
This slide covers statistics on different aspects of collaboration process. It include statistics on growth segments, preferred tools used by teams and top benefits of collaborative tools. Pitch your topic with ease and precision using this Effectives Of Workplace Growth Segments Collaboration And Tools Dashboard Graphics PDF. This layout presents information on Highest Collaboration, Growth Segments, Tools Preferred. It is also available for immediate download and adjustment. So, changes can be made in the color, design, graphics or any other component to create a unique layout.
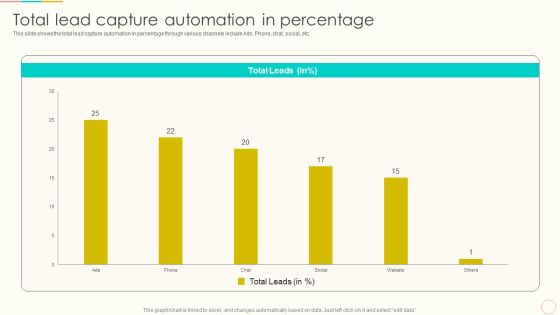
Lead Management To Engage Potential Customers Total Lead Capture Automation In Percentage Rules PDF
This slide shows the total lead capture automation in percentage through various channels include Ads. Phone, chat, social, etc. This Lead Management To Engage Potential Customers Total Lead Capture Automation In Percentage Rules PDF from Slidegeeks makes it easy to present information on your topic with precision. It provides customization options, so you can make changes to the colors, design, graphics, or any other component to create a unique layout. It is also available for immediate download, so you can begin using it right away. Slidegeeks has done good research to ensure that you have everything you need to make your presentation stand out. Make a name out there for a brilliant performance.
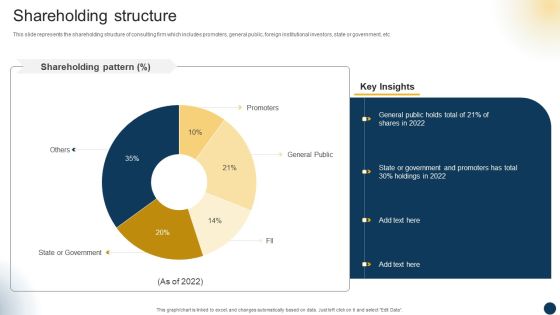
Organizational Advisory Solutions Business Profile Shareholding Structure Designs PDF
This slide represents the shareholding structure of consulting firm which includes promoters, general public, foreign institutional investors, state or government, etc. This Organizational Advisory Solutions Business Profile Shareholding Structure Designs PDF from Slidegeeks makes it easy to present information on your topic with precision. It provides customization options, so you can make changes to the colors, design, graphics, or any other component to create a unique layout. It is also available for immediate download, so you can begin using it right away. Slidegeeks has done good research to ensure that you have everything you need to make your presentation stand out. Make a name out there for a brilliant performance.

Brand Health Definition And Metrics To Track Brand Value Estimation Guide Mockup PDF
Following slide provides an overview about brand equity by covering its definition and key components such as brand loyalty, awareness, quality, association and experience.Present like a pro with Brand Health Definition And Metrics To Track Brand Value Estimation Guide Mockup PDF Create beautiful presentations together with your team, using our easy-to-use presentation slides. Share your ideas in real-time and make changes on the fly by downloading our templates. So whether you are in the office, on the go, or in a remote location, you can stay in sync with your team and present your ideas with confidence. With Slidegeeks presentation got a whole lot easier. Grab these presentations today.

Plastic Waste Recycling Statistics Based On Compound Annual Growth Rate Inspiration PDF
This slide covers statistics based on top countries contribution in plastic recycling and waste management. It includes report from period 2019-2025 with insights based on CAGR. Pitch your topic with ease and precision using this Plastic Waste Recycling Statistics Based On Compound Annual Growth Rate Inspiration PDF. This layout presents information on Contributes Maximum, 2015 To 2025. It is also available for immediate download and adjustment. So, changes can be made in the color, design, graphics or any other component to create a unique layout.

Customer Satisfaction Survey Analysis Of It Company Dashboard Themes PDF
This slide shows the insights of survey conducted by an IT company to know whether their customers are satisfied with their services or not and also includes questions related to their services, and suggestions for their improvements. Pitch your topic with ease and precision using this Customer Satisfaction Survey Analysis Of It Company Dashboard Themes PDF. This layout presents information on Organization, Business, Service. It is also available for immediate download and adjustment. So, changes can be made in the color, design, graphics or any other component to create a unique layout.

Customer Support Team Web Based Platform Dashboard Demonstration PDF
This slide showcases consumer service team web panel dashboard. It provides information about average customer health, churn rate, lifetime value, net promoter score, first call resolution FCR, etc. Pitch your topic with ease and precision using this Customer Support Team Web Based Platform Dashboard Demonstration PDF. This layout presents information on Churn Rate, Lifetime Value, Customer Health Score. It is also available for immediate download and adjustment. So, changes can be made in the color, design, graphics or any other component to create a unique layout.
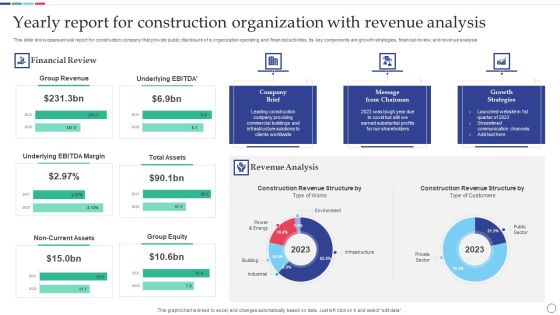
Yearly Report For Construction Organization With Revenue Analysis Topics PDF
This slide showcases annual report for construction company that provide public disclosure of a organization operating and financial activities. Its key components are growth strategies, financial review, and revenue analysis. Showcasing this set of slides titled Yearly Report For Construction Organization With Revenue Analysis Topics PDF. The topics addressed in these templates are Revenue Analysis, Growth Strategies, Customers. All the content presented in this PPT design is completely editable. Download it and make adjustments in color, background, font etc. as per your unique business setting.

Kpi Dashboard To Track Applicant Selection Process Ppt PowerPoint Presentation File Graphics Template PDF
This slide shows dashboard which can be used to monitor the progress of recruitment process. It includes metrics such as applications received, shortlisted applicant, selected candidates, etc. Pitch your topic with ease and precision using this Kpi Dashboard To Track Applicant Selection Process Ppt PowerPoint Presentation File Graphics Template PDF. This layout presents information on Applications Received, Shortlisted Candidates, Selected Candidates. It is also available for immediate download and adjustment. So, changes can be made in the color, design, graphics or any other component to create a unique layout.
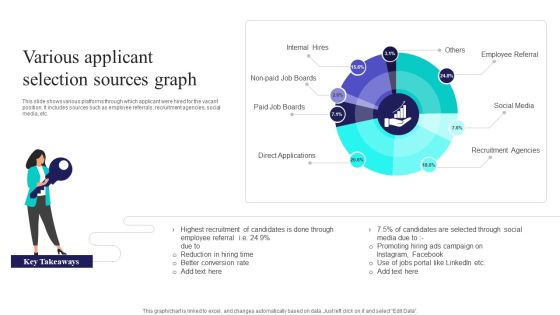
Various Applicant Selection Sources Graph Ppt PowerPoint Presentation Gallery Slide Download PDF
This slide shows various platforms through which applicant were hired for the vacant position. It includes sources such as employee referrals, recruitment agencies, social media, etc. Pitch your topic with ease and precision using this Various Applicant Selection Sources Graph Ppt PowerPoint Presentation Gallery Slide Download PDF. This layout presents information on Internal Hires, Paid Job Boards, Direct Applications. It is also available for immediate download and adjustment. So, changes can be made in the color, design, graphics or any other component to create a unique layout.

Applicant Selection Dashboard To Monitor Recruitment Process Sample PDF
This slide shows dashboard which can be used to track recruitment procedure status. It includes key performance indicators such as total open positions, total roles, selected applicant, application sources, etc. Pitch your topic with ease and precision using this Applicant Selection Dashboard To Monitor Recruitment Process Sample PDF. This layout presents information on Selection Rate, Recruitment Funnel, Application Sources. It is also available for immediate download and adjustment. So, changes can be made in the color, design, graphics or any other component to create a unique layout.

Dashboard To Analyze Application Sources And Days To Hire Template PDF
This slide showcases dashboard that can help organization to evaluate average days taken to hire a candidate and major sources of application. It also showcases various other components which are open positions, candidates place, avg commission rate, reasons for candidate and client decline. Find a pre designed and impeccable Dashboard To Analyze Application Sources And Days To Hire Template PDF. The templates can ace your presentation without additional effort. You can download these easy to edit presentation templates to make your presentation stand out from others. So, what are you waiting for Download the template from Slidegeeks today and give a unique touch to your presentation.
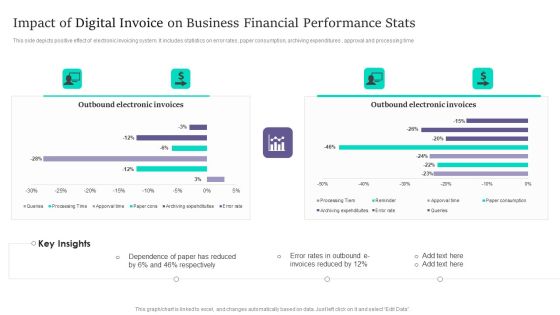
Impact Of Digital Invoice On Business Financial Performance Stats Infographics PDF
This side depicts positive effect of electronic invoicing system. It includes statistics on error rates, paper consumption, archiving expenditures , approval and processing time. Pitch your topic with ease and precision using this Impact Of Digital Invoice On Business Financial Performance Stats Infographics PDF. This layout presents information on Impact Of Digital Invoice, Business Financial Performance Stats. It is also available for immediate download and adjustment. So, changes can be made in the color, design, graphics or any other component to create a unique layout.
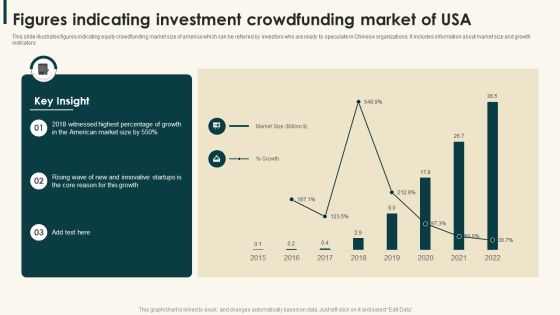
Figures Indicating Investment Crowdfunding Market Of Usa Information PDF
This slide illustrates figures indicating equity crowdfunding market size of america which can be referred by investors who are ready to speculate in Chinese organizations. It includes information about market size and growth indicators,Pitch your topic with ease and precision using this Figures Indicating Investment Crowdfunding Market Of Usa Information PDF. This layout presents information on Witnessed Highest, American Market, Innovative Startups. It is also available for immediate download and adjustment. So, changes can be made in the color, design, graphics or any other component to create a unique layout.

Customer Attraction Through Email Marketing Business Communication Strategy Portrait PDF
This slide explains about increasing trends in email marketing strategy to outreach customers. It includes elements such as Number of users, key insights, artificial intelligence, personalized content etc. Pitch your topic with ease and precision using this Customer Attraction Through Email Marketing Business Communication Strategy Portrait PDF. This layout presents information on Gradual Increase, Email Outreach, Marketing Strategy. It is also available for immediate download and adjustment. So, changes can be made in the color, design, graphics or any other component to create a unique layout.
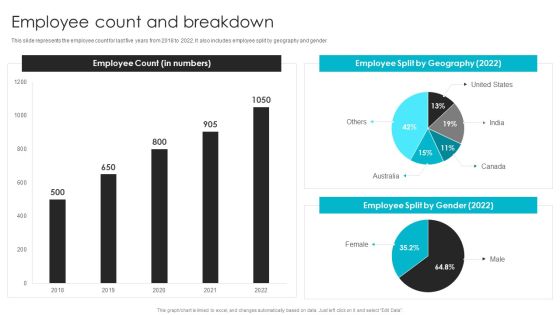
Web Design Company Overview Employee Count And Breakdown Topics PDF
This slide represents the employee count for last five years from 2018 to 2022. It also includes employee split by geography and gender. This Web Design Company Overview Employee Count And Breakdown Topics PDF from Slidegeeks makes it easy to present information on your topic with precision. It provides customization options, so you can make changes to the colors, design, graphics, or any other component to create a unique layout. It is also available for immediate download, so you can begin using it right away. Slidegeeks has done good research to ensure that you have everything you need to make your presentation stand out. Make a name out there for a brilliant performance.

Optimizing Smart Pricing Tactics To Improve Sales Business Conversion Due To Improved Pricing Strategy Summary PDF
This Optimizing Smart Pricing Tactics To Improve Sales Business Conversion Due To Improved Pricing Strategy Summary PDF from Slidegeeks makes it easy to present information on your topic with precision. It provides customization options, so you can make changes to the colors, design, graphics, or any other component to create a unique layout. It is also available for immediate download, so you can begin using it right away. Slidegeeks has done good research to ensure that you have everything you need to make your presentation stand out. Make a name out there for a brilliant performance.

Financial Kpi Dashboard To Evaluate Fundraising Impact Developing Fundraising Techniques Diagrams PDF
This slide showcases dashboard that can help organization to evaluate key changes in financial KPIs post fundraising. Its key components are net profit margin, revenue, gross profit margin, debt to equity and return on equity. From laying roadmaps to briefing everything in detail, our templates are perfect for you. You can set the stage with your presentation slides. All you have to do is download these easy-to-edit and customizable templates. Financial Kpi Dashboard To Evaluate Fundraising Impact Developing Fundraising Techniques Diagrams PDF will help you deliver an outstanding performance that everyone would remember and praise you for. Do download this presentation today.
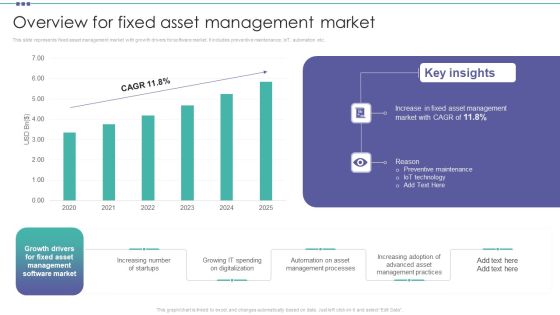
Overview For Fixed Asset Management Market Organization Physical Assets Portrait PDF
This slide represents fixed asset management market with growth drivers for software market. It includes preventive maintenance, IoT, automation etc.This Overview For Fixed Asset Management Market Organization Physical Assets Portrait PDF from Slidegeeks makes it easy to present information on your topic with precision. It provides customization options, so you can make changes to the colors, design, graphics, or any other component to create a unique layout. It is also available for immediate download, so you can begin using it right away. Slidegeeks has done good research to ensure that you have everything you need to make your presentation stand out. Make a name out there for a brilliant performance.

Brand Awareness Strategy Dashboard To Track Website Traffic After Brand Awareness Rules PDF
This slide showcases dashboard that can help organization to track the website traffic after running online brand awareness marketing campaigns. Its key components are new visitors, traffic by source, traffic by lead source, customers wins by lead source and bounce rate. From laying roadmaps to briefing everything in detail, our templates are perfect for you. You can set the stage with your presentation slides. All you have to do is download these easy-to-edit and customizable templates. Brand Awareness Strategy Dashboard To Track Website Traffic After Brand Awareness Rules PDF will help you deliver an outstanding performance that everyone would remember and praise you for. Do download this presentation today.

Promotion Strategies For New Service Launch Global Market Sizing For New Service Infographics PDF
This slide showcases market sizing that can help organization to estimate the profit and revenue potential before launching new service. Its key components are market size, estimated growth and target market. Take your projects to the next level with our ultimate collection of Promotion Strategies For New Service Launch Global Market Sizing For New Service Infographics PDF. Slidegeeks has designed a range of layouts that are perfect for representing task or activity duration, keeping track of all your deadlines at a glance. Tailor these designs to your exact needs and give them a truly corporate look with your own brand colors they will make your projects stand out from the rest.
Staff Awareness Playbook Determine Workforce Training Performance Tracking Dashboard Slides PDF
This slide provides information regarding workforce training performance tracking dashboard with training cost, number of participants, hours of training, etc. This Staff Awareness Playbook Determine Workforce Training Performance Tracking Dashboard Slides PDF from Slidegeeks makes it easy to present information on your topic with precision. It provides customization options, so you can make changes to the colors, design, graphics, or any other component to create a unique layout. It is also available for immediate download, so you can begin using it right away. Slidegeeks has done good research to ensure that you have everything you need to make your presentation stand out. Make a name out there for a brilliant performance.

Communication Channels Used By Client And Business Enterprises Guidelines PDF
This slide shows statistical data of communication between company and consumer. It includes email, phone, in person, social media, online forms, knowledge base, portals, text, live support, mobile app, discussion forums and voice activated personal assistants. Pitch your topic with ease and precision using this Communication Channels Used By Client And Business Enterprises Guidelines PDF. This layout presents information on Service, Communication, Customer. It is also available for immediate download and adjustment. So, changes can be made in the color, design, graphics or any other component to create a unique layout.
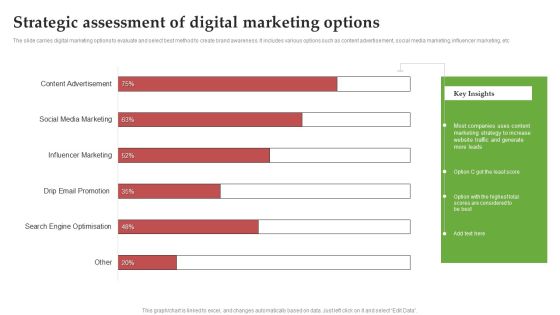
Strategic Assessment Of Digital Marketing Options Ppt PowerPoint Presentation File Show PDF
The slide carries digital marketing options to evaluate and select best method to create brand awareness. It includes various options such as content advertisement, social media marketing, influencer marketing, etc. Pitch your topic with ease and precision using this Strategic Assessment Of Digital Marketing Options Ppt PowerPoint Presentation File Show PDF. This layout presents information on Influencer Marketing, Social Media Marketing, Content Advertisement. It is also available for immediate download and adjustment. So, changes can be made in the color, design, graphics or any other component to create a unique layout.

Strategic Performance Analysis Tools Survey Microsoft PDF
This slide showcase survey result of 300 professional organization using strategic performance measurement tools. It includes elements such as key performance indicators, performance appraisal method, six sigma method, 360 degree feedback etc. Pitch your topic with ease and precision using this Strategic Performance Analysis Tools Survey Microsoft PDF. This layout presents information on Strategic Performance, Analysis Tools Survey. It is also available for immediate download and adjustment. So, changes can be made in the color, design, graphics or any other component to create a unique layout.

Business Sales And Revenue Summary Dashboard Brochure PDF
This slide exhibits sales report dashboards that provides information of sales activities and performance in financial year. It includes elements such as average weekly sales revenue, customer acquisition cost, customer lifetime value and sales target. Pitch your topic with ease and precision using this Business Sales And Revenue Summary Dashboard Brochure PDF. This layout presents information on Average Revenue, Customer Lifetime, Customer Acquisition. It is also available for immediate download and adjustment. So, changes can be made in the color, design, graphics or any other component to create a unique layout.

ESO System Incident Management KPI Dashboard Ppt PowerPoint Presentation File Graphic Images PDF
This slide covers enterprise security operation incident management kpi dashboard. It involves details such as average resolution time, new incidents, incident status and new incidents by category. Pitch your topic with ease and precision using this ESO System Incident Management KPI Dashboard Ppt PowerPoint Presentation File Graphic Images PDF. This layout presents information on Average Resolution Time, Incident Status, New Incidents. It is also available for immediate download and adjustment. So, changes can be made in the color, design, graphics or any other component to create a unique layout.
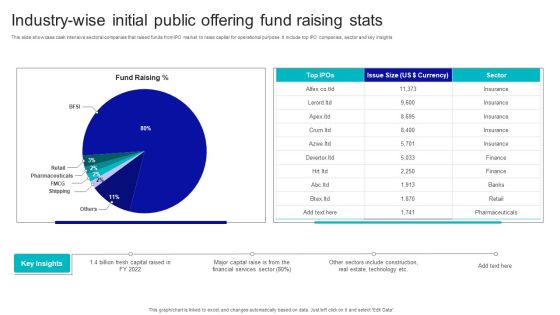
Industry Wise Initial Public Offering Fund Raising Stats Demonstration PDF
This slide showcase cash intensive sectoral companies that raised funds from IPO market to raise capital for operational purpose. It include top IPO companies, sector and key insights. Pitch your topic with ease and precision using this Industry Wise Initial Public Offering Fund Raising Stats Demonstration PDF. This layout presents information on Industry Wise Initial, Public Offering, Fund Raising Stats. It is also available for immediate download and adjustment. So, changes can be made in the color, design, graphics or any other component to create a unique layout.
Employees Attrition Tracking Statistics And Resignation Rate Report By Industry Background PDF
This slide covers dashboard for industry wise employees turnover rates. It further includes statistics on resignation rare of workers, average turnover rates for different industries. Pitch your topic with ease and precision using this Employees Attrition Tracking Statistics And Resignation Rate Report By Industry Background PDF. This layout presents information on Employees, Industry, Average Turnover Rate. It is also available for immediate download and adjustment. So, changes can be made in the color, design, graphics or any other component to create a unique layout.
Impact Survey Report Of Employee Attrition Tracking On Team Operations Demonstration PDF
This slide covers key factors having high impact on day to day team operations. It includes areas such as delay in project delivery, loss of productivity, rehiring cost and on boarding a replacement, low team morale, stress issues, legal and HR related issues. Pitch your topic with ease and precision using this Impact Survey Report Of Employee Attrition Tracking On Team Operations Demonstration PDF. This layout presents information on Employees Turnover, Project, Cost. It is also available for immediate download and adjustment. So, changes can be made in the color, design, graphics or any other component to create a unique layout.
Sales Attrition Tracking Report With Revenue And Customer Churn Analytics Formats PDF
This slide covers dashboard depicting total annual sales in company. It includes key components such as revenue, profit margins, cost incurred, cost breakdown, up sell and churn trends. Showcasing this set of slides titled Sales Attrition Tracking Report With Revenue And Customer Churn Analytics Formats PDF. The topics addressed in these templates are Revenue, Number Of Sales, Profit, Cost. All the content presented in this PPT design is completely editable. Download it and make adjustments in color, background, font etc. as per your unique business setting.
Issues Tracking Dashboard For Organizational Building Management Ppt Infographics Topics PDF
This slide showcases dashboard which can help organization to keep track of issues plus faults during facility management and rectify them within stipulated time. Its key elements are issues reported, fault tracking, etc. Pitch your topic with ease and precision using this Issues Tracking Dashboard For Organizational Building Management Ppt Infographics Topics PDF. This layout presents information on Fault Tracking, Issues Reported, Location. It is also available for immediate download and adjustment. So, changes can be made in the color, design, graphics or any other component to create a unique layout.

KPI Dashboard To Track E Commerce Business Revenue Analysis Rules PDF
This slide shows dashboard which can be used by organizations to monitor ecommerce revenue analysis. It includes metrics such as orders, purchases, delivery status etc. Pitch your topic with ease and precision using this KPI Dashboard To Track E Commerce Business Revenue Analysis Rules PDF. This layout presents information on Total Purchases, Total Sales, Pending Delivery, Collection. It is also available for immediate download and adjustment. So, changes can be made in the color, design, graphics or any other component to create a unique layout.

Retail B2C Ecommerce Selling Forecasts Graph Portrait PDF
This slide depicts sales projections for both retail and ecommerce stores. It includes sales projections for brick and mortar and retail ecommerce stores for period of six years. Pitch your topic with ease and precision using this Retail B2C Ecommerce Selling Forecasts Graph Portrait PDF. This layout presents information on Retail B2C Ecommerce, Selling Forecasts Graph. It is also available for immediate download and adjustment. So, changes can be made in the color, design, graphics or any other component to create a unique layout.
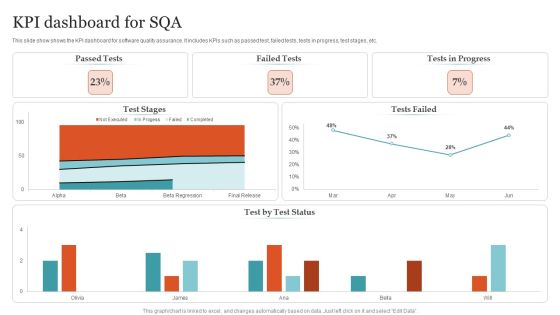
KPI Dashboard For SQA Ppt PowerPoint Presentation Gallery Structure PDF
This slide show shows the KPI dashboard for software quality assurance. It includes KPIs such as passed test, failed tests, tests in progress, test stages, etc. Pitch your topic with ease and precision using this KPI Dashboard For SQA Ppt PowerPoint Presentation Gallery Structure PDF. This layout presents information on Passed Tests, Failed Tests, Tests Progress . It is also available for immediate download and adjustment. So, changes can be made in the color, design, graphics or any other component to create a unique layout.

Food Segments Contribution Towards Total Production And Global Export Topics PDF
This slide graphically provides information regarding the contribution of multiple food components such as meats, diary, grains and oil seeds, fruits and vegetables etc. towards total food production and global export. From laying roadmaps to briefing everything in detail, our templates are perfect for you. You can set the stage with your presentation slides. All you have to do is download these easy to edit and customizable templates. Food Segments Contribution Towards Total Production And Global Export Topics PDF will help you deliver an outstanding performance that everyone would remember and praise you for. Do download this presentation today.
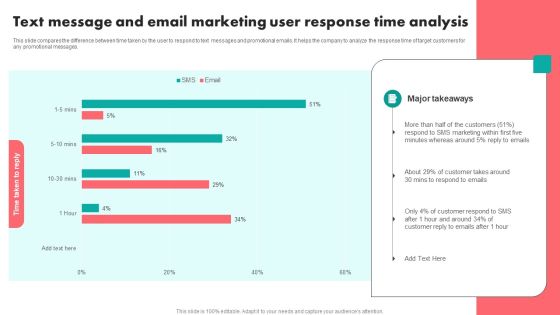
Text Message And Email Marketing User Response Time Analysis Template PDF
This slide compares the difference between time taken by the user to respond to text messages and promotional emails. It helps the company to analyze the response time of target customers for any promotional messages. Pitch your topic with ease and precision using this Text Message And Email Marketing User Response Time Analysis Template PDF. This layout presents information on Text Message, Email Marketing User, Response Time Analysis. It is also available for immediate download and adjustment. So, changes can be made in the color, design, graphics or any other component to create a unique layout.

Customer Service Delivery And Management Dashboard With Revenue Brochure PDF
The purpose of this slide is to monitor and evaluate service delivery KPIs to improve the customer support process. The major KPIs included are total requests, percentage of requests answered, total revenue, and support cost. Pitch your topic with ease and precision using this Customer Service Delivery And Management Dashboard With Revenue Brochure PDF. This layout presents information on Customer Service Delivery, Management Dashboard With Revenue. It is also available for immediate download and adjustment. So, changes can be made in the color, design, graphics or any other component to create a unique layout.

Human Resource Service Delivery And Management Dashboard Information PDF
This slide shows services delivered of the HR department showing recruiting processes, optimizing workplace management as well as enhancing the overall employee performance. It includes HR metrics like overtime hours, absenteeism rate, training costs, and so on. Pitch your topic with ease and precision using this Human Resource Service Delivery And Management Dashboard Information PDF. This layout presents information on Human Resource Service Delivery, Management Dashboard. It is also available for immediate download and adjustment. So, changes can be made in the color, design, graphics or any other component to create a unique layout.

Supply Chain Management Service Delivery And Management Dashboard Guidelines PDF
This slide shows an overview of the supply chain management delivery service to track the operationality of the overall process. It includes metrics such as on time deliveries, the average time to sell, and the out of stock rate. Pitch your topic with ease and precision using this Supply Chain Management Service Delivery And Management Dashboard Guidelines PDF. This layout presents information on Supply Chain Management, Service Delivery, Management Dashboard. It is also available for immediate download and adjustment. So, changes can be made in the color, design, graphics or any other component to create a unique layout.

Retail Inventory Management Kpi Dashboard Rules PDF
This slide gives overview of inventory management in retail industry showcasing expected date of order placed for top selling item, sales return by product category, average inventory value in FY 2022 and purchase order summary. Pitch your topic with ease and precision using this Retail Inventory Management Kpi Dashboard Rules PDF. This layout presents information on Retail Inventory Management, Dashboard. It is also available for immediate download and adjustment. So, changes can be made in the color, design, graphics or any other component to create a unique layout.
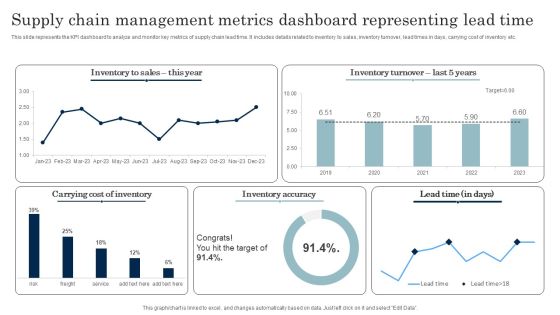
Supply Chain Management Metrics Dashboard Representing Lead Time Download PDF
This slide represents the KPI dashboard to analyze and monitor key metrics of supply chain lead time. It includes details related to inventory to sales, inventory turnover, lead times in days, carrying cost of inventory etc. Pitch your topic with ease and precision using this Supply Chain Management Metrics Dashboard Representing Lead Time Download PDF. This layout presents information on Inventory Accuracy, Carrying Cost Of Inventory. It is also available for immediate download and adjustment. So, changes can be made in the color, design, graphics or any other component to create a unique layout.
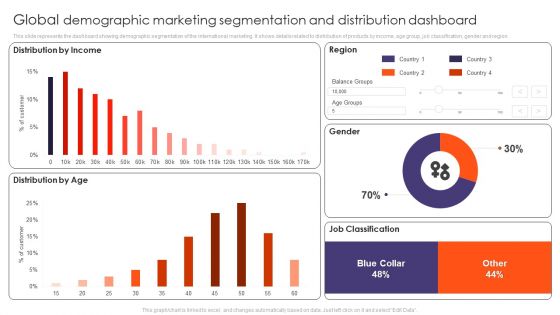
Global Demographic Marketing Segmentation And Distribution Dashboard Ppt Gallery Tips PDF
This slide represents the dashboard showing demographic segmentation of the international marketing. It shows details related to distribution of products by income, age group, job classification, gender and region. Pitch your topic with ease and precision using this Global Demographic Marketing Segmentation And Distribution Dashboard Ppt Gallery Tips PDF. This layout presents information on Distribution Income, Distribution Age, Region, Gender, Job Classification. It is also available for immediate download and adjustment. So, changes can be made in the color, design, graphics or any other component to create a unique layout.

Dashboard Showing Digital Marketing Campaign Report Ppt Infographic Template Template PDF
This slide represents the campaign report of digital marketing which includes total spend , impressions , clicks , acquisitions, cost per action that results in analyzing marketing efforts to improve market share of business. Pitch your topic with ease and precision using this Dashboard Showing Digital Marketing Campaign Report Ppt Infographic Template Template PDF. This layout presents information on Customer Acquisition, Total Impressions, Total Clicks, Total Acquisition. It is also available for immediate download and adjustment. So, changes can be made in the color, design, graphics or any other component to create a unique layout.
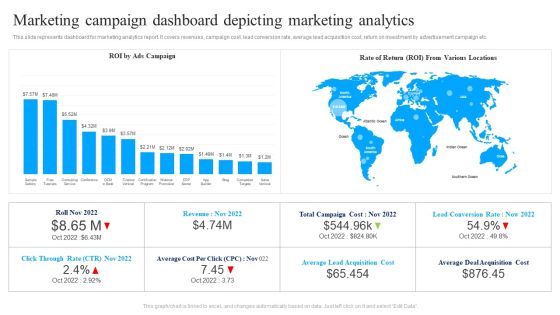
Marketing Campaign Dashboard Depicting Marketing Analytics Ppt Summary Infographics PDF
This slide represents dashboard for marketing analytics report. It covers revenues, campaign cost, lead conversion rate, average lead acquisition cost, return on investment by advertisement campaign etc. Pitch your topic with ease and precision using this Marketing Campaign Dashboard Depicting Marketing Analytics Ppt Summary Infographics PDF. This layout presents information on ROI Ads Campaign, Rate Of Return, Various Locations. It is also available for immediate download and adjustment. So, changes can be made in the color, design, graphics or any other component to create a unique layout.

Marketing Dashboard To Track Marketing Progress Ppt Tips PDF
This slide represents dashboard to track marketing campaign progress. It includes advertisement costs , total clicks, click-through rate, conversion rate, cost per thousand impression etc. Pitch your topic with ease and precision using this Marketing Dashboard To Track Marketing Progress Ppt Tips PDF. This layout presents information on Total Clicks, Total Impression, Total Conversion Rate, Cost Per Click. It is also available for immediate download and adjustment. So, changes can be made in the color, design, graphics or any other component to create a unique layout.
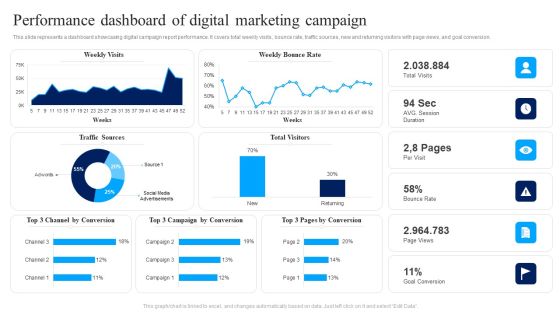
Performance Dashboard Of Digital Marketing Campaign Ppt Show Slide PDF
This slide represents a dashboard showcasing digital campaign report performance. It covers total weekly visits, bounce rate, traffic sources, new and returning visitors with page views, and goal conversion. Pitch your topic with ease and precision using this Performance Dashboard Of Digital Marketing Campaign Ppt Show Slide PDF. This layout presents information on Weekly Visits, Weekly Bounce Rate, Bounce Rate. It is also available for immediate download and adjustment. So, changes can be made in the color, design, graphics or any other component to create a unique layout.
 Home
Home