Features List

PowerPoint Template Circle Puzzle Download Ppt Presentation
PowerPoint Template Circle Puzzle Download PPT Presentation-It is all there in bits and pieces. Individual components well researched and understood in their place.Use this template to illustrate your method, piece by piece, and interlock the whole process in the minds of your audience.-PowerPoint Template Circle Puzzle Download PPT Presentation-Cycle, Design, Diagram, Element, Graph, Business, Chart, Circular, Connect, Connection, Puzzle, Round, Solving, Step, Together, Putting, Mystery, Linking, Infographic, Icon,

PowerPoint Template Circle Puzzle Leadership Ppt Backgrounds
PowerPoint Template Circle Puzzle Leadership PPT Backgrounds-It is all there in bits and pieces. Individual components well researched and understood in their place.Use this template to illustrate your method, piece by piece, and interlock the whole process in the minds of your audience.-PowerPoint Template Circle Puzzle Leadership PPT Backgrounds-Cycle, Design, Diagram, Element, Graph, Business, Chart, Circular, Connect, Connection, Puzzle, Round, Solving, Step, Together, Putting, Mystery, Linking, Infographic, Icon,
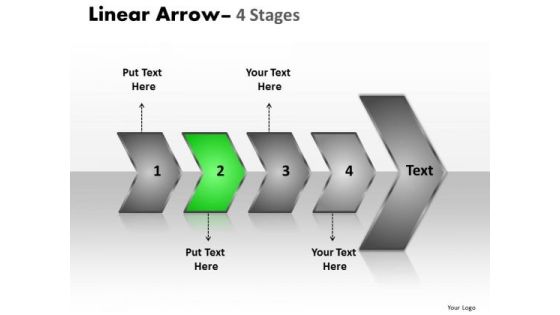
Sales Ppt Theme Succeeding Media Representation Theory PowerPoint Of 4 Arrows Design
We present our sales PPT Theme succeeding media representation theory power point of 4 arrows design. Use our Abstract PowerPoint Templates because; illustrate your plans on using the many social media modes available to inform society at large of the benefits of your product. Use our Symbol PowerPoint Templates because, Churn the mixture to the right degree and pound home your views and expectations in a spectacularly grand and virtuoso fluid performance. Use our Business PowerPoint Templates because; Blaze a brilliant trail from point to point. Use our Process and Flows PowerPoint Templates because, transmit your thoughts via our slides and prod your team to action. Use our Arrows PowerPoint Templates because, anticipate the doubts and questions in the minds of your colleagues and enlighten them with your inspired strategy to garner desired success. Use these PowerPoint slides for presentations relating to Arrow, Background, Business, Chart, Diagram, Financial, Flow, Graphic, Gray, Icon, Illustration, Linear, Management, Orange, Perspective, Process, Reflection, Spheres, Stage, Text. The prominent colors used in the PowerPoint template are Green, Gray, and Black
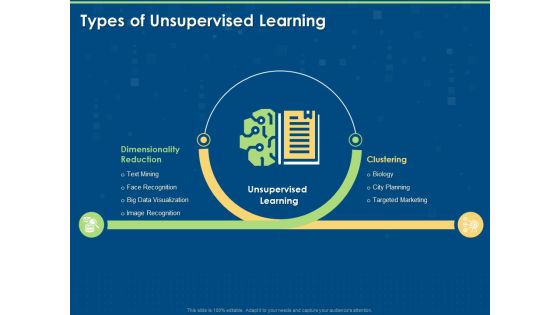
Working Of Unsupervised Machine Learning Types Of Unsupervised Learning Ppt Infographics Layout PDF
Presenting this set of slides with name working of unsupervised machine learning types of unsupervised learning ppt infographics layout pdf. This is a two stage process. The stages in this process are dimensionality reduction, clustering, unsupervised learning, city planning, targeted marketing, text mining, face recognition, big data visualization, image recognition. This is a completely editable PowerPoint presentation and is available for immediate download. Download now and impress your audience.

Artificial Intelligence Machine Learning Deep Learning Types Of Unsupervised Learning Ppt PowerPoint Presentation File Infographics PDF
Presenting this set of slides with name artificial intelligence machine learning deep learning types of unsupervised learning ppt powerpoint presentation file infographics pdf. This is a two stage process. The stages in this process are dimensionality reduction, unsupervised, learning clustering, text mining, face recognition, big data visualization, image recognition, biology, city planning, targeted marketing. This is a completely editable PowerPoint presentation and is available for immediate download. Download now and impress your audience.

Boosting Machine Learning Types Of Unsupervised Learning Ppt PowerPoint Presentation Layouts Deck PDF
Presenting this set of slides with name boosting machine learning types of unsupervised learning ppt powerpoint presentation layouts deck pdf. This is a two stage process. The stages in this process are dimensionality reduction, unsupervised, learning clustering, text mining, face recognition, big data visualization, image recognition, biology, city planning, targeted marketing. This is a completely editable PowerPoint presentation and is available for immediate download. Download now and impress your audience.

How To Overcome Challenges Associated With ERP Implementation Designs PDF
This slide covers the solutions of the challenges faced by ERP implementation such as providing adequate training, plan ahead, do test run, engage with IT specialist, etc. Deliver and pitch your topic in the best possible manner with this how to overcome challenges associated with erp implementation designs pdf. Use them to share invaluable insights on motivate employees, potential problems, training and impress your audience. This template can be altered and modified as per your expectations. So, grab it now.

Various Steps In Optimizing HR Service Delivery Information PDF
Presenting various steps in optimizing hr service delivery information pdf to provide visual cues and insights. Share and navigate important information on three stages that need your due attention. This template can be used to pitch topics like services defining and documentation, developing employee facing knowledgebase, planning change management . In addtion, this PPT design contains high resolution images, graphics, etc, that are easily editable and available for immediate download.

Offline Media Channel Analysis Case Study Print Media To Attract Audience Topics PDF
This slide showcases case study for offline marketing to capture attention of potential audience. The case study covers the challenge faced by firm, its objective, action plan and results. There are so many reasons you need a Offline Media Channel Analysis Case Study Print Media To Attract Audience Topics PDF. The first reason is you can not spend time making everything from scratch, Thus, Slidegeeks has made presentation templates for you too. You can easily download these templates from our website easily.

Seo Marketing Strategies For Increasing Customer Reach Strategies For Acquiring Consumers Formats PDF
This slide covers search engine optimization techniques to improve the websites ranking and visibility. It highlights the strategies such as on page SEO for optimizing site content, internal links, and meta tags and off page SEO for guest posting, content marketing, etc. Slidegeeks has constructed Seo Marketing Strategies For Increasing Customer Reach Strategies For Acquiring Consumers Formats PDF after conducting extensive research and examination. These presentation templates are constantly being generated and modified based on user preferences and critiques from editors. Here, you will find the most attractive templates for a range of purposes while taking into account ratings and remarks from users regarding the content. This is an excellent jumping-off point to explore our content and will give new users an insight into our top-notch PowerPoint Templates.

Integrating CRM Solution To Acquire Potential Customers Comparative Analysis Of CRM With Email Marketing Topics PDF
This slide represents comparison between top CRM with email marketing tools on the basis of different parameters to help organization to select the best CRM with email marketing tool. It includes comparison based on free plan, starting price for paid plans etc. Slidegeeks is one of the best resources for PowerPoint templates. You can download easily and regulate Integrating CRM Solution To Acquire Potential Customers Comparative Analysis Of CRM With Email Marketing Topics PDF for your personal presentations from our wonderful collection. A few clicks is all it takes to discover and get the most relevant and appropriate templates. Use our Templates to add a unique zing and appeal to your presentation and meetings. All the slides are easy to edit and you can use them even for advertisement purposes.

Formulating Video Marketing Strategies To Enhance Sales Best Time To Upload Videos On Instagram Portrait PDF
The following slide outlines the schedule highlighting the best time to post stories and reels on instagram. The organization will be able to generate more leads and increase brand awareness by uploading videos on the right time. There are so many reasons you need a Formulating Video Marketing Strategies To Enhance Sales Best Time To Upload Videos On Instagram Portrait PDF. The first reason is you can not spend time making everything from scratch, Thus, Slidegeeks has made presentation templates for you too. You can easily download these templates from our website easily.
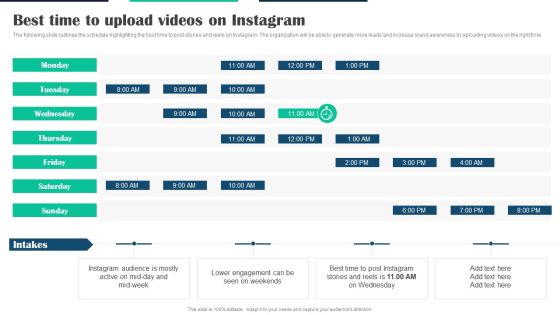
Executing Video Promotional Best Time To Upload Videos On Instagram Graphics PDF
The following slide outlines the schedule highlighting the best time to post stories and reels on Instagram. The organization will be able to generate more leads and increase brand awareness by uploading videos on the right time. There are so many reasons you need a Executing Video Promotional Best Time To Upload Videos On Instagram Graphics PDF. The first reason is you cant spend time making everything from scratch, Thus, Slidegeeks has made presentation templates for you too. You can easily download these templates from our website easily.

Colorful Diverging Circles And Arrows 7 Stages Venn Diagram PowerPoint Slides
We present our colorful diverging circles and arrows 7 stages Venn Diagram PowerPoint Slides.Download our Ring charts PowerPoint Templates because you will be able to Highlight these individual targets and the paths to their achievement. Download our Marketing PowerPoint Templates because this PPt Enlighten others on your team with your views. Use our Arrows PowerPoint Templates because it Educates your team with your thoughts and logic. Use our Shapes PowerPoint Templates because you will be able to Highlight the various ways in which we can maintain its efficiency. Use our Business PowerPoint Templates because the great Bald headed Eagle embodies your personality. the eagle eye to seize upon the smallest of opportunities.Use these PowerPoint slides for presentations relating to Business, button, catalog, chart, circle, company, data, design, diagram, direction, document, financial, glossy, goals, graph, junction, management, market, marketing, model, multicolored, multiple, navigation, network, options, plan, presentation, process, results, shiny, sphere. The prominent colors used in the PowerPoint template are Green, Gray, Black. People tell us our colorful diverging circles and arrows 7 stages Venn Diagram PowerPoint Slides are Majestic. We assure you our circle PowerPoint templates and PPT Slides are designed to make your presentations professional. PowerPoint presentation experts tell us our colorful diverging circles and arrows 7 stages Venn Diagram PowerPoint Slides are No-nonsense. You can be sure our diagram PowerPoint templates and PPT Slides are Graceful. Professionals tell us our colorful diverging circles and arrows 7 stages Venn Diagram PowerPoint Slides are Pretty. Use our data PowerPoint templates and PPT Slides are Stylish.
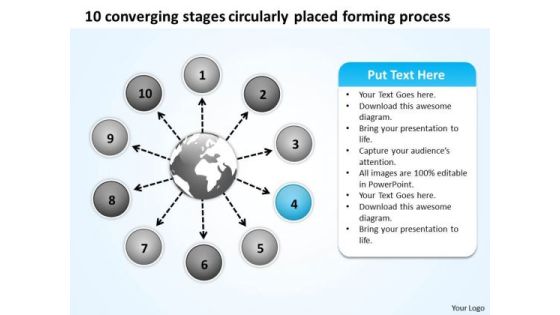
Stages Circularly Placed Forming Process Flow Arrow Network PowerPoint Templates
We present our stages circularly placed forming process Flow Arrow Network PowerPoint templates.Download our Arrows PowerPoint Templates because your foot is on the pedal and your company is purring along smoothly. Present our Process and Flows PowerPoint Templates because you have played a stellar role and have a few ideas. Use our Business PowerPoint Templates because you too have got the framework of your companys growth in place. Download and present our Shapes PowerPoint Templates because they highlight the depth of your thought process. Use our Circle Charts PowerPoint Templates because displaying your ideas and highlighting your ability will accelerate the growth of your company and yours.Use these PowerPoint slides for presentations relating to Arrow, Business, Chart, Circle, Design, Diagram, Direction, Document, Market, Marketing, Multiple, Navigation, Network, Options, Plan, Presentation, Process, Results, Shiny, Sphere, Statistics, Structure, Template, Three, Vector, Website, Wheel. The prominent colors used in the PowerPoint template are Blue light, White, Gray. People tell us our stages circularly placed forming process Flow Arrow Network PowerPoint templates are Royal. People tell us our Direction PowerPoint templates and PPT Slides are Reminiscent. The feedback we get is that our stages circularly placed forming process Flow Arrow Network PowerPoint templates are Clever. Presenters tell us our Diagram PowerPoint templates and PPT Slides are Lush. Customers tell us our stages circularly placed forming process Flow Arrow Network PowerPoint templates are Youthful. The feedback we get is that our Document PowerPoint templates and PPT Slides are Radiant.

Five Stages Of Project Management With Key Activities Microsoft PDF
Mentioned slide shows five phases of project management which project manager can refer for any type of project. It includes phases like initiation, planning, executing, monitoring and controlling along with key activities for each phase. Pitch your topic with ease and precision using this five stages of project management with key activities microsoft pdf. This layout presents information on five stages of project management with key activities. It is also available for immediate download and adjustment. So, changes can be made in the color, design, graphics or any other component to create a unique layout.
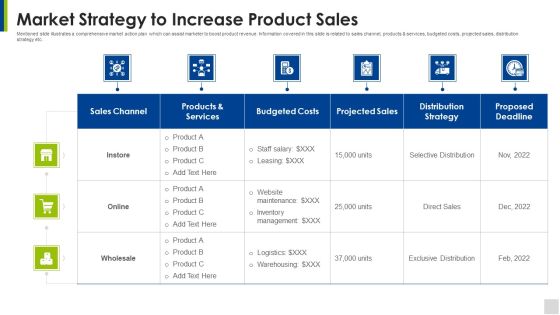
Market Strategy To Increase Product Sales Elements PDF
Mentioned slide illustrates a comprehensive market action plan which can assist marketer to boost product revenue. Information covered in this slide is related to sales channel, products and services, budgeted costs, projected sales, distribution strategy etc. Pitch your topic with ease and precision using this market strategy to increase product sales elements pdf. This layout presents information on sales channel, budgeted costs, projected sales. It is also available for immediate download and adjustment. So, changes can be made in the color, design, graphics or any other component to create a unique layout.
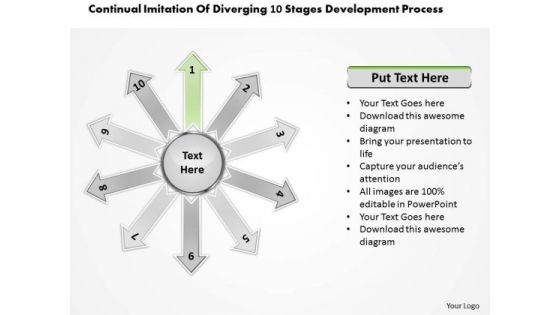
Imitation Of Diverging 10 Stages Development Process Cycle Motion Chart PowerPoint Slides
We present our imitation of diverging 10 stages development process Cycle Motion Chart PowerPoint Slides.Present our Arrows PowerPoint Templates because Our PowerPoint Templates and Slides are designed to help you succeed. They have all the ingredients you need. Download our Process and Flows PowerPoint Templates because You will get more than you ever bargained for. Download and present our Business PowerPoint Templates because you have analysed many global markets and come up with possibilities. Highlight the pros and cons of other likely business oppurtunities. Download and present our Shapes PowerPoint Templates because your fledgling career is in the chrysallis stage. Nurture it and watch it grow into a beautiful butterfly. Use our Spheres PowerPoint Templates because You can Zap them with our PowerPoint Templates and Slides. See them reel under the impact.Use these PowerPoint slides for presentations relating to Abstract, Arrows, Blank, Business, Central, Centralized, Chart, Circle, Circular, Circulation, Concept, Conceptual, Converging, Design, Diagram, Empty, Executive, Icon, Idea, Illustration, Management, Map, Mapping, Model, Numbers, Organization, Outwards, Pointing, Procedure, Process, Radial, Radiating, Relationship, Resource, Sequence, Sequential, Seven, Square, Strategy. The prominent colors used in the PowerPoint template are Green, Gray, White. Professionals tell us our imitation of diverging 10 stages development process Cycle Motion Chart PowerPoint Slides will save the presenter time. You can be sure our Central PowerPoint templates and PPT Slides are Splendid. Customers tell us our imitation of diverging 10 stages development process Cycle Motion Chart PowerPoint Slides are Festive. Professionals tell us our Chart PowerPoint templates and PPT Slides will generate and maintain the level of interest you desire. They will create the impression you want to imprint on your audience. People tell us our imitation of diverging 10 stages development process Cycle Motion Chart PowerPoint Slides are Ritzy. People tell us our Chart PowerPoint templates and PPT Slides are Bright.
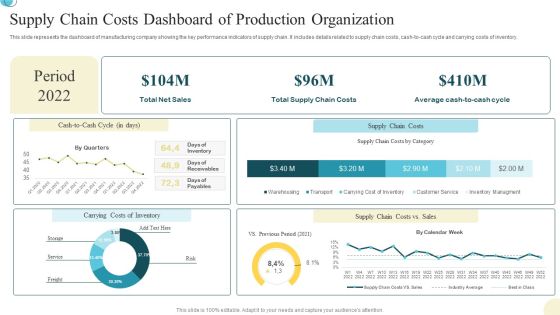
Supply Chain Costs Dashboard Of Production Organization Background PDF
This slide represents the dashboard of manufacturing company showing the key performance indicators of supply chain. It includes details related to supply chain costs, cash to cash cycle and carrying costs of inventory. Pitch your topic with ease and precision using this Supply Chain Costs Dashboard Of Production Organization Background PDF. This layout presents information on Supply Chain Costs, Dashboard Of Production, Organization. It is also available for immediate download and adjustment. So, changes can be made in the color, design, graphics or any other component to create a unique layout.
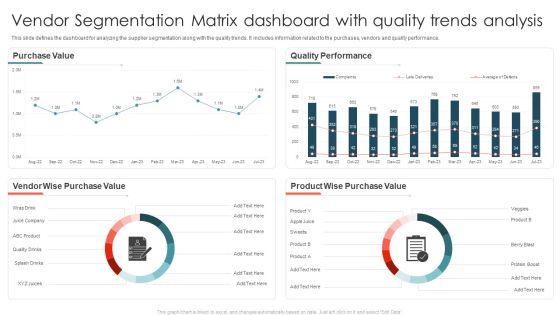
Vendor Segmentation Matrix Dashboard With Quality Trends Analysis Ppt Model Rules PDF
This slide defines the dashboard for analyzing the supplier segmentation along with the quality trends. It includes information related to the purchases, vendors and quality performance. Pitch your topic with ease and precision using this Vendor Segmentation Matrix Dashboard With Quality Trends Analysis Ppt Model Rules PDF. This layout presents information on Purchase Value, Quality Performance, Vendor Wise. It is also available for immediate download and adjustment. So, changes can be made in the color, design, graphics or any other component to create a unique layout.
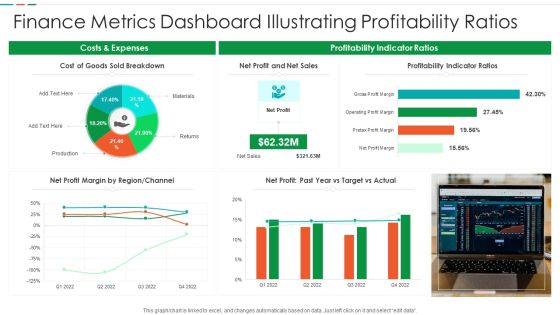
Finance Metrics Dashboard Illustrating Profitability Ratios Diagrams PDF
This graph or chart is linked to excel, and changes automatically based on data. Just left click on it and select edit data. Pitch your topic with ease and precision using this Finance Metrics Dashboard Illustrating Profitability Ratios Diagrams PDF. This layout presents information on Cost Goods Sold, Net Profit Net, Sales Profitability Indicator. It is also available for immediate download and adjustment. So, changes can be made in the color, design, graphics or any other component to create a unique layout.

Finance Metrics Dashboard Indicating Portfolio Performance Microsoft PDF
This graph or chart is linked to excel, and changes automatically based on data. Just left click on it and select edit data. Pitch your topic with ease and precision using this Finance Metrics Dashboard Indicating Portfolio Performance Microsoft PDF. This layout presents information on Portfolio Performance Portfolio, Asset Management Manager, Top 10 Assets. It is also available for immediate download and adjustment. So, changes can be made in the color, design, graphics or any other component to create a unique layout.

Finance Metrics Dashboard Indicating Short Term Assets Download PDF
This graph or chart is linked to excel, and changes automatically based on data. Just left click on it and select edit data. Pitch your topic with ease and precision using this Finance Metrics Dashboard Indicating Short Term Assets Download PDF. This layout presents information on Short Term Assets, Global Financial Performance, Revenue YTD 2022. It is also available for immediate download and adjustment. So, changes can be made in the color, design, graphics or any other component to create a unique layout.

Client Helpline Dashboard With Product Customer Satisfaction Ppt Slides Graphics Template PDF
This graph or chart is linked to excel, and changes automatically based on data. Just left click on it and select Edit Data. Pitch your topic with ease and precision using this Client Helpline Dashboard With Product Customer Satisfaction Ppt Slides Graphics Template PDF. This layout presents information on Customer Satisfaction, Product, Compare. It is also available for immediate download and adjustment. So, changes can be made in the color, design, graphics or any other component to create a unique layout.

Client Helpline Dashboard With Ticket Resolution Ppt Model Graphics Design PDF
This graph or chart is linked to excel, and changes automatically based on data. Just left click on it and select Edit Data. Pitch your topic with ease and precision using this Client Helpline Dashboard With Ticket Resolution Ppt Model Graphics Design PDF. This layout presents information on Ticket Due Times, Sourcewise Tickets, Open Tickets. It is also available for immediate download and adjustment. So, changes can be made in the color, design, graphics or any other component to create a unique layout.
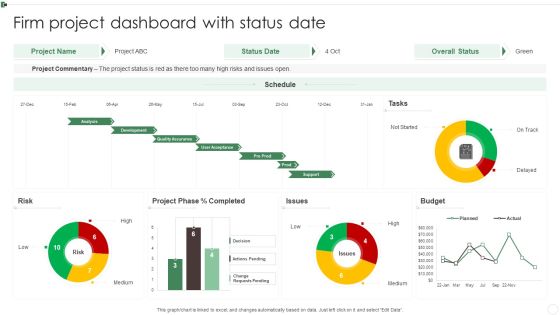
Firm Project Dashboard With Status Date Ppt Infographics Slides PDF
This graph or chart is linked to excel, and changes automatically based on data. Just left click on it and select Edit Data. Pitch your topic with ease and precision using this Firm Project Dashboard With Status Date Ppt Infographics Slides PDF. This layout presents information on Project Commentary, Budget, Project Phase, Risk. It is also available for immediate download and adjustment. So, changes can be made in the color, design, graphics or any other component to create a unique layout.
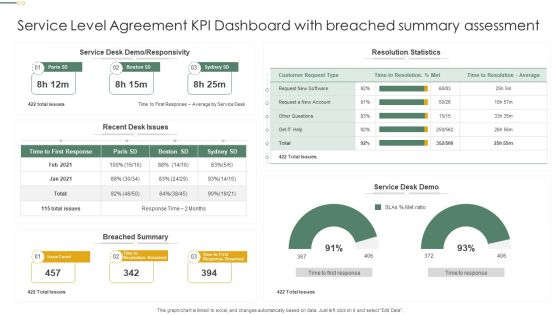
Service Level Agreement KPI Dashboard With Breached Summary Assessment Professional PDF
This graph or chart is linked to excel, and changes automatically based on data. Just left click on it and select Edit Data. Pitch your topic with ease and precision using this Service Level Agreement KPI Dashboard With Breached Summary Assessment Professional PDF. This layout presents information on Resolution Statistics, Service Desk Demo, Breached Summary. It is also available for immediate download and adjustment. So, changes can be made in the color, design, graphics or any other component to create a unique layout.
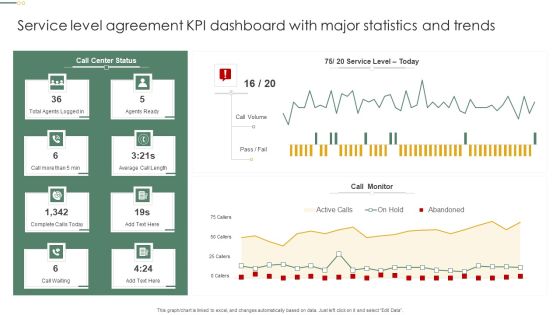
Service Level Agreement KPI Dashboard With Major Statistics And Trends Pictures PDF
This graph or chart is linked to excel, and changes automatically based on data. Just left click on it and select Edit Data. Pitch your topic with ease and precision using this Service Level Agreement KPI Dashboard With Major Statistics And Trends Pictures PDF. This layout presents information on Call Monitor, Call Volume, Agents Ready. It is also available for immediate download and adjustment. So, changes can be made in the color, design, graphics or any other component to create a unique layout.
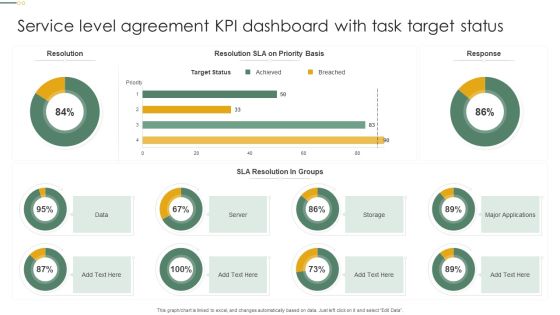
Service Level Agreement KPI Dashboard With Task Target Status Microsoft PDF
This graph or chart is linked to excel, and changes automatically based on data. Just left click on it and select Edit Data. Pitch your topic with ease and precision using this Service Level Agreement KPI Dashboard With Task Target Status Microsoft PDF. This layout presents information on Target Status, Sla Resolution, Groups, Server. It is also available for immediate download and adjustment. So, changes can be made in the color, design, graphics or any other component to create a unique layout.
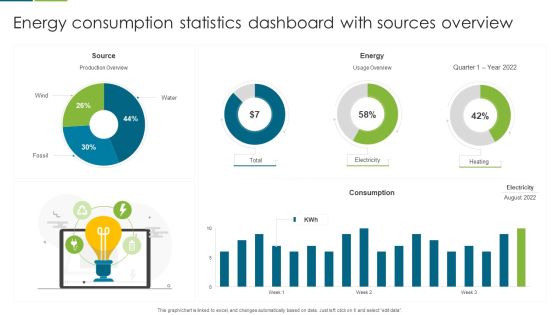
Energy Consumption Statistics Dashboard With Sources Overview Template PDF
This graph or chart is linked to excel, and changes automatically based on data. Just left click on it and select edit data. Pitch your topic with ease and precision using this Energy Consumption Statistics Dashboard With Sources Overview Template PDF. This layout presents information on Source, Energy, Consumption. It is also available for immediate download and adjustment. So, changes can be made in the color, design, graphics or any other component to create a unique layout.

Company Group Members Demographics Dashboard Overview Clipart PDF
This graph or chart is linked to excel, and changes automatically based on data. Just left click on it and select Edit Data. Pitch your topic with ease and precision using this Company Group Members Demographics Dashboard Overview Clipart PDF. This layout presents information on Headcount Office, Headcount Tenure Range, Headcount Age Range. It is also available for immediate download and adjustment. So, changes can be made in the color, design, graphics or any other component to create a unique layout.
Project Tracking And Evaluation Dashboard Portrait PDF
This slide illustrates graphical representation and facts and figures relating to project management data. It includes budget by employee, overdue tasks, workload charts etc. Pitch your topic with ease and precision using this Project Tracking And Evaluation Dashboard Portrait PDF. This layout presents information on Employee Budget, Target, Design, Development. It is also available for immediate download and adjustment. So, changes can be made in the color, design, graphics or any other component to create a unique layout.

Service SLA KPL Changes And Incidents Dashboard Ppt Inspiration Infographics PDF
This graph or chart is linked to excel, and changes automatically based on data. Just left click on it and select Edit Data. Pitch your topic with ease and precision using this Service SLA KPL Changes And Incidents Dashboard Ppt Inspiration Infographics PDF. This layout presents information on Time Spent Department, Incidents Closed, Operator Group. It is also available for immediate download and adjustment. So, changes can be made in the color, design, graphics or any other component to create a unique layout.
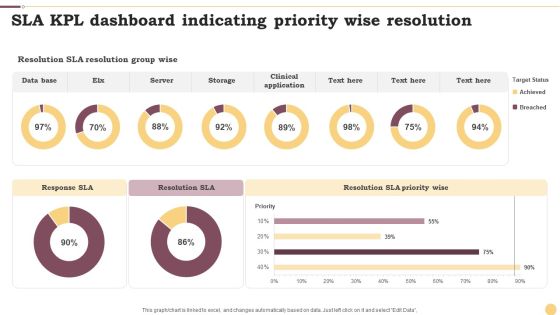
SLA KPL Dashboard Indicating Priority Wise Resolution Ppt Infographics Example File PDF
This graph or chart is linked to excel, and changes automatically based on data. Just left click on it and select Edit Data. Pitch your topic with ease and precision using this SLA KPL Dashboard Indicating Priority Wise Resolution Ppt Infographics Example File PDF. This layout presents information on Data Base, Server, Storage. It is also available for immediate download and adjustment. So, changes can be made in the color, design, graphics or any other component to create a unique layout.

SLA KPL Overview Dashboard Depicting Service Targets Ppt Slides Maker PDF
This graph or chart is linked to excel, and changes automatically based on data. Just left click on it and select Edit Data. Pitch your topic with ease and precision using this SLA KPL Overview Dashboard Depicting Service Targets Ppt Slides Maker PDF. This layout presents information on Monthly Trend, Service Target, Quarterly Trend. It is also available for immediate download and adjustment. So, changes can be made in the color, design, graphics or any other component to create a unique layout.

Doughnut Graph Depicting ROI From Multiple Marketing Activities Rules PDF
This graph or chart is linked to excel, and changes automatically based on data. Just left click on it and select Edit Data. Pitch your topic with ease and precision using this Doughnut Graph Depicting ROI From Multiple Marketing Activities Rules PDF. This layout presents information on Total ROI, Field Campaigns, Print Media, Display Ads. It is also available for immediate download and adjustment. So, changes can be made in the color, design, graphics or any other component to create a unique layout.

Doughnut Graph With Online Employee Recruitment Via Multiple Portals Mockup PDF
This graph or chart is linked to excel, and changes automatically based on data. Just left click on it and select Edit Data. Pitch your topic with ease and precision using this Doughnut Graph With Online Employee Recruitment Via Multiple Portals Mockup PDF. This layout presents information on ABC Employment, Multiple Portals, 2020 To 2022. It is also available for immediate download and adjustment. So, changes can be made in the color, design, graphics or any other component to create a unique layout.
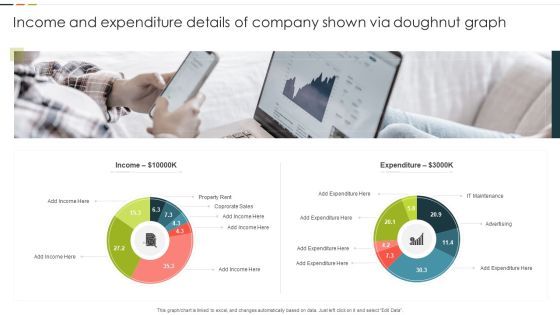
Income And Expenditure Details Of Company Shown Via Doughnut Graph Graphics PDF
This graph or chart is linked to excel, and changes automatically based on data. Just left click on it and select Edit Data. Pitch your topic with ease and precision using this Income And Expenditure Details Of Company Shown Via Doughnut Graph Graphics PDF. This layout presents information on Property Rent, Corporate Sales, Expenditure. It is also available for immediate download and adjustment. So, changes can be made in the color, design, graphics or any other component to create a unique layout.

Kanban Structure For Product Quality Assurance Ppt Portfolio Deck PDF
This graph or chart is linked to excel, and changes automatically based on data. Just left click on it and select Edit Data. Pitch your topic with ease and precision using this Kanban Structure For Product Quality Assurance Ppt Portfolio Deck PDF. This layout presents information on Product Deployment, Quality Assurance, Product, Designing And Development. It is also available for immediate download and adjustment. So, changes can be made in the color, design, graphics or any other component to create a unique layout.
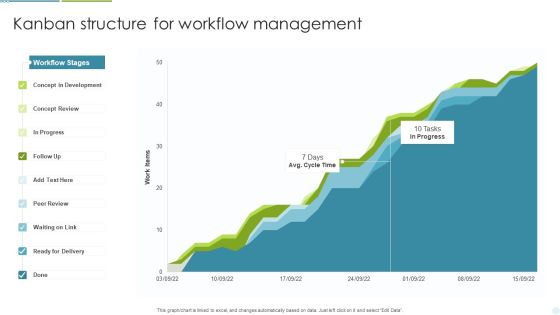
Kanban Structure For Workflow Management Ppt Inspiration Template PDF
This graph or chart is linked to excel, and changes automatically based on data. Just left click on it and select Edit Data. Pitch your topic with ease and precision using this Kanban Structure For Workflow Management Ppt Inspiration Template PDF. This layout presents information on Concept Development, Concept Review, Ready For Delivery. It is also available for immediate download and adjustment. So, changes can be made in the color, design, graphics or any other component to create a unique layout.

Kanban Structure To Manage Weekly Work Activities Ppt Professional Aids PDF
This graph or chart is linked to excel, and changes automatically based on data. Just left click on it and select Edit Data. Pitch your topic with ease and precision using this Kanban Structure To Manage Weekly Work Activities Ppt Professional Aids PDF. This layout presents information on Legend, Ready To Start, In Progress. It is also available for immediate download and adjustment. So, changes can be made in the color, design, graphics or any other component to create a unique layout.

Human Capital Metrics For New Hire Ppt Pictures Brochure PDF
This graph or chart is linked to excel, and changes automatically based on data. Just left click on it and select Edit Data. Pitch your topic with ease and precision using this Human Capital Metrics For New Hire Ppt Pictures Brochure PDF. This layout presents information on Active Employee Count, New Hire Count, New Hire. It is also available for immediate download and adjustment. So, changes can be made in the color, design, graphics or any other component to create a unique layout.

Human Capital Metrics With Absenteeism Rate Ppt Infographic Template Ideas PDF
This graph or chart is linked to excel, and changes automatically based on data. Just left click on it and select Edit Data. Pitch your topic with ease and precision using this Human Capital Metrics With Absenteeism Rate Ppt Infographic Template Ideas PDF. This layout presents information on Overall Labor Effectiveness, OLE Department, Absenteeism. It is also available for immediate download and adjustment. So, changes can be made in the color, design, graphics or any other component to create a unique layout.
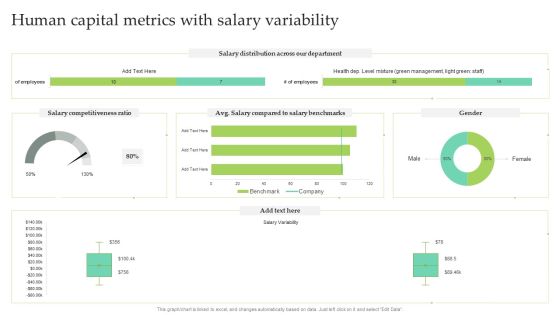
Human Capital Metrics With Salary Variability Ppt Infographic Template Designs PDF
This graph or chart is linked to excel, and changes automatically based on data. Just left click on it and select Edit Data. Pitch your topic with ease and precision using this Human Capital Metrics With Salary Variability Ppt Infographic Template Designs PDF. This layout presents information on Salary Distribution, Salary Competitiveness Ratio, Male. It is also available for immediate download and adjustment. So, changes can be made in the color, design, graphics or any other component to create a unique layout.

Carbon Emissions Of Countries Bar Graph Professional PDF
This slide depicts emissions chart of various countries to avoid the worst impacts of climate change. It includes countries and carbon emissions in million metric tons. Pitch your topic with ease and precision using this Carbon Emissions Of Countries Bar Graph Professional PDF. This layout presents information on Maximum Production, Consumer Goods, Carbon Emissions. It is also available for immediate download and adjustment. So, changes can be made in the color, design, graphics or any other component to create a unique layout.

Manufacturing Productivity Analysis Bar Graph Introduction PDF
This slide illustrates the productivity chart of manufacturing of a company. It includes quantity produced in million units against the time period. Pitch your topic with ease and precision using this Manufacturing Productivity Analysis Bar Graph Introduction PDF. This layout presents information on Manufacturing Productivity, Production Decreased, Closure Of Companies. It is also available for immediate download and adjustment. So, changes can be made in the color, design, graphics or any other component to create a unique layout.
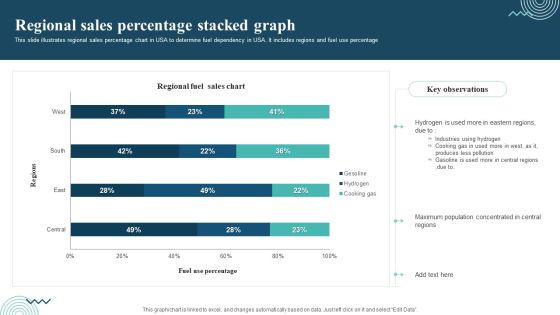
Regional Sales Percentage Stacked Graph Themes PDF
This slide illustrates regional sales percentage chart in USA to determine fuel dependency in USA. It includes regions and fuel use percentage. Pitch your topic with ease and precision using this Regional Sales Percentage Stacked Graph Themes PDF. This layout presents information on Regional Sales, Industries Using Hydrogen, Cooking Gas. It is also available for immediate download and adjustment. So, changes can be made in the color, design, graphics or any other component to create a unique layout.
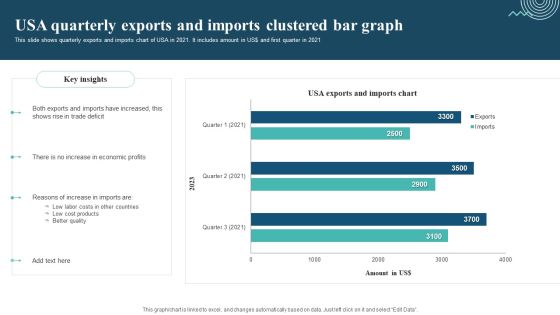
Usa Quarterly Exports And Imports Clustered Bar Graph Designs PDF
This slide shows quarterly exports and imports chart of USA in 2021. It includes amount in US dollar and first quarter in 2021. Pitch your topic with ease and precision using this Usa Quarterly Exports And Imports Clustered Bar Graph Designs PDF. This layout presents information on Exports And Imports, Trade Deficit, Economic Profits. It is also available for immediate download and adjustment. So, changes can be made in the color, design, graphics or any other component to create a unique layout.
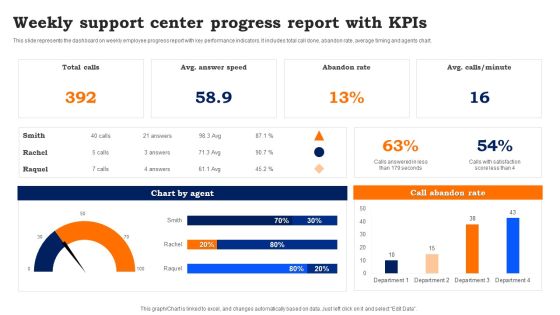
Weekly Support Center Progress Report With Kpis Template PDF
This slide represents the dashboard on weekly employee progress report with key performance indicators. It includes total call done, abandon rate, average timing and agents chart. Pitch your topic with ease and precision using this Weekly Support Center Progress Report With Kpis Template PDF. This layout presents information on Weekly Support, Center Progress Report. It is also available for immediate download and adjustment. So, changes can be made in the color, design, graphics or any other component to create a unique layout.
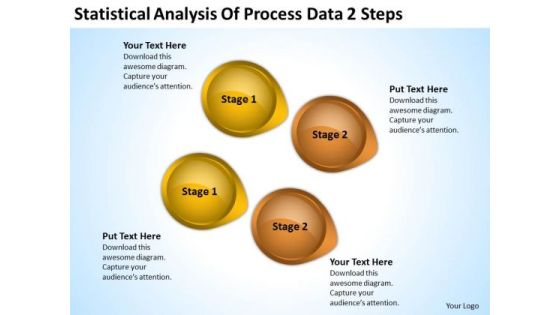
Power Point Arrows Statistical Analysis Of Process Data 2 Steps PowerPoint Templates
We present our power point arrows statistical analysis of process data 2 steps PowerPoint templates.Download and present our Business PowerPoint Templates because It is Aesthetically crafted by artistic young minds. Our PowerPoint Templates and Slides are designed to display your dexterity. Present our Arrows PowerPoint Templates because You can Rise to the occasion with our PowerPoint Templates and Slides. You will bring your audience on their feet in no time. Download and present our Circle Charts PowerPoint Templates because Our PowerPoint Templates and Slides help you pinpoint your timelines. Highlight the reasons for your deadlines with their use. Present our Shapes PowerPoint Templates because You aspire to touch the sky with glory. Let our PowerPoint Templates and Slides provide the fuel for your ascent. Present our Symbol PowerPoint Templates because You have gained great respect for your brilliant ideas. Use our PowerPoint Templates and Slides to strengthen and enhance your reputation.Use these PowerPoint slides for presentations relating to abstract, arrow, art, background, banner, blue, bright, business, circle, color, colorful, concept, conceptual, connection, creative, cycle, design, different, element, empty, flower, form, frame, graphic, green, group, idea, illustration, match, message, order, part, petal, piece, place, red, ring, shape, solution, special, speech, strategy, symbol, template, text, usable, vector, web, website. The prominent colors used in the PowerPoint template are Yellow, Brown, Black. People tell us our power point arrows statistical analysis of process data 2 steps PowerPoint templates will impress their bosses and teams. People tell us our circle PowerPoint templates and PPT Slides are designed by professionals Presenters tell us our power point arrows statistical analysis of process data 2 steps PowerPoint templates are second to none. We assure you our banner PowerPoint templates and PPT Slides will make the presenter successul in his career/life. Presenters tell us our power point arrows statistical analysis of process data 2 steps PowerPoint templates will help you be quick off the draw. Just enter your specific text and see your points hit home. Professionals tell us our background PowerPoint templates and PPT Slides will make the presenter look like a pro even if they are not computer savvy.
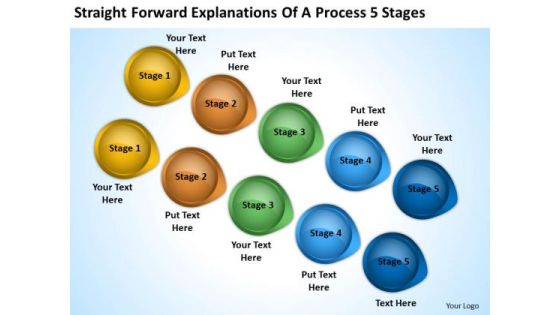
Power Point Arrows Straight Forward Explanations Of Process 5 Stages PowerPoint Templates
We present our power point arrows straight forward explanations of process 5 stages PowerPoint templates.Download and present our Business PowerPoint Templates because Our PowerPoint Templates and Slides will let you Illuminate the road ahead to Pinpoint the important landmarks along the way. Download and present our Arrows PowerPoint Templates because our PowerPoint Templates and Slides will give your ideas the shape. Download and present our Circle Charts PowerPoint Templates because Our PowerPoint Templates and Slides will Embellish your thoughts. They will help you illustrate the brilliance of your ideas. Present our Shapes PowerPoint Templates because our PowerPoint Templates and Slides will give your ideas the shape. Use our Symbol PowerPoint Templates because Our PowerPoint Templates and Slides will give good value for money. They also have respect for the value of your time.Use these PowerPoint slides for presentations relating to abstract, arrow, art, background, banner, blue, bright, business, circle, color, colorful, concept, conceptual, connection, creative, cycle, design, different, element, empty, flower, form, frame, graphic, green, group, idea, illustration, match, message, order, part, petal, piece, place, red, ring, shape, solution, special, speech, strategy, symbol, template, text, usable, vector, web, website. The prominent colors used in the PowerPoint template are Yellow, Green, Brown. People tell us our power point arrows straight forward explanations of process 5 stages PowerPoint templates provide great value for your money. Be assured of finding the best projection to highlight your words. People tell us our blue PowerPoint templates and PPT Slides are the best it can get when it comes to presenting. Presenters tell us our power point arrows straight forward explanations of process 5 stages PowerPoint templates are designed by a team of presentation professionals. We assure you our bright PowerPoint templates and PPT Slides will impress their bosses and teams. Presenters tell us our power point arrows straight forward explanations of process 5 stages PowerPoint templates are readymade to fit into any presentation structure. Professionals tell us our business PowerPoint templates and PPT Slides effectively help you save your valuable time.

Business People 3d Men With Red Brain PowerPoint Templates Ppt Backgrounds For Slides
We present our business people 3d men with red brain PowerPoint templates PPT backgrounds for slides.Download our People PowerPoint Templates because Our PowerPoint Templates and Slides help you pinpoint your timelines. Highlight the reasons for your deadlines with their use. Download and present our Circle Charts PowerPoint Templates because Our PowerPoint Templates and Slides have the Brilliant backdrops. Guaranteed to illuminate the minds of your audience. Use our Children PowerPoint Templates because you can Add colour to your speech with our PowerPoint Templates and Slides. Your presentation will leave your audience speechless. Download our Science PowerPoint Templates because It is Aesthetically crafted by artistic young minds. Our PowerPoint Templates and Slides are designed to display your dexterity. Download and present our Medical PowerPoint Templates because Our PowerPoint Templates and Slides will bullet point your ideas. See them fall into place one by one.Use these PowerPoint slides for presentations relating to 3d, anatomy, brain, brainy, cerebellum, cerebra, cerebral, character, clip, clipart, cortex, education, figure, genius, graphic, group, human, handshake,icon, illustration,intellect, intellectual, intelligence, isolated, medical, men, mentality, mind,neurology, people, person, physiology, psychology, remember, red,science,scientific, sense, subconscious, team, tech, telepathy, think, white. The prominent colors used in the PowerPoint template are White, Red, Black. Professionals tell us our business people 3d men with red brain PowerPoint templates PPT backgrounds for slides are aesthetically designed to attract attention. We guarantee that they will grab all the eyeballs you need. Professionals tell us our cerebellum PowerPoint templates and PPT Slides are the best it can get when it comes to presenting. People tell us our business people 3d men with red brain PowerPoint templates PPT backgrounds for slides are the best it can get when it comes to presenting. Customers tell us our cerebral PowerPoint templates and PPT Slides will make the presenter successul in his career/life. The feedback we get is that our business people 3d men with red brain PowerPoint templates PPT backgrounds for slides will save the presenter time. Use our cerebral PowerPoint templates and PPT Slides will help you be quick off the draw. Just enter your specific text and see your points hit home.
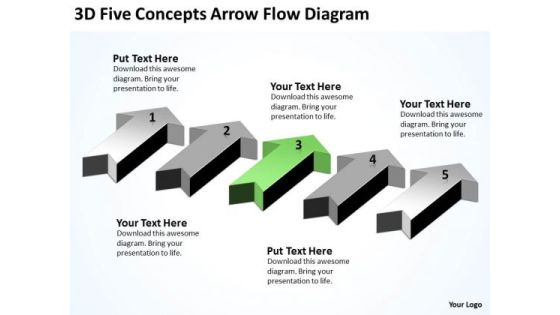
Massively Parallel Processor 3d Five Concepts Arrow Flow Diagram PowerPoint Templates
We present our massively parallel processor 3d five concepts arrow flow diagram PowerPoint templates.Use our Arrows PowerPoint Templates because Our PowerPoint Templates and Slides will let your words and thoughts hit bullseye everytime. Download and present our Flow Charts PowerPoint Templates because Our PowerPoint Templates and Slides are topically designed to provide an attractive backdrop to any subject. Present our Process and Flows PowerPoint Templates because Our PowerPoint Templates and Slides will give good value for money. They also have respect for the value of your time. Present our Steps PowerPoint Templates because Our PowerPoint Templates and Slides will steer your racing mind. Hit the right buttons and spur on your audience. Download our Future PowerPoint Templates because Our PowerPoint Templates and Slides help you pinpoint your timelines. Highlight the reasons for your deadlines with their use.Use these PowerPoint slides for presentations relating to Advertising, arrow, business, card,collection, color, colorful, concept, control, creative, curl, customer, design,direction, element, green, icon, illustration, infographic, label, layout, mark,marketing, message, new, number, offer, one, paper, product, service, set,shadow, shop, sign, site, step, sticker, symbol, tag, three, two, vector, web, white. The prominent colors used in the PowerPoint template are Green, Gray, White. Presenters tell us our massively parallel processor 3d five concepts arrow flow diagram PowerPoint templates help you meet deadlines which are an element of today's workplace. Just browse and pick the slides that appeal to your intuitive senses. Presenters tell us our card PowerPoint templates and PPT Slides help you meet deadlines which are an element of today's workplace. Just browse and pick the slides that appeal to your intuitive senses. Customers tell us our massively parallel processor 3d five concepts arrow flow diagram PowerPoint templates are topically designed to provide an attractive backdrop to any subject. Use our card PowerPoint templates and PPT Slides are designed by a team of presentation professionals. Customers tell us our massively parallel processor 3d five concepts arrow flow diagram PowerPoint templates are aesthetically designed to attract attention. We guarantee that they will grab all the eyeballs you need. Presenters tell us our color PowerPoint templates and PPT Slides will help them to explain complicated concepts.
Non Profit Financial Plan Ppt PowerPoint Presentation Complete Deck With Slides Ppt PowerPoint Presentation Complete Deck With Slides
This Non Profit Financial Plan Ppt PowerPoint Presentation Complete Deck With Slides Ppt PowerPoint Presentation Complete Deck With Slides acts as backup support for your ideas, vision, thoughts, etc. Use it to present a thorough understanding of the topic. This PPT slideshow can be utilized for both in house and outside presentations depending upon your needs and business demands. Entailing twenty slides with a consistent design and theme, this template will make a solid use case. As it is intuitively designed, it suits every business vertical and industry. All you have to do is make a few tweaks in the content or any other component to design unique presentations. The biggest advantage of this complete deck is that it can be personalized multiple times once downloaded. The color, design, shapes, and other elements are free to modify to add personal touches. You can also insert your logo design in this PPT layout. Therefore a well-thought and crafted presentation can be delivered with ease and precision by downloading this Non Profit Financial Plan Ppt PowerPoint Presentation Complete Deck With Slides Ppt PowerPoint Presentation Complete Deck With Slides PPT slideshow.

Editable PowerPoint Template Straight Demonstration Of 6 Stages Graphic
We present our editable PowerPoint template straight Demonstration of 6 stages Graphic.Use our Process and flows PowerPoint Templates because, aesthetically designed to make a great first impression this template highlights. Use our shapes PowerPoint Templates because; Use this template containing to highlight the key issues of your presentation. Use our Signs PowerPoint Templates because; illustrate your plans to your listeners with the same accuracy. Use our Business PowerPoint Templates because, Master them all and you have it made. Use our Arrows PowerPoint Templates because, There are so many different pieces to the puzzle. Use these PowerPoint slides for presentations relating to Algorithm, arrow, arrow chart, block, block diagram, business, chart, connection, design, development, diagram, direction, element, flow, flow chart, flow diagram, flowchart, graph, linear, linear diagram, management, model, module, motion, process, process arrows, process chart, process diagram, process flow, program, section, segment, set, sign, solution, strategy, symbol, technology, vibrant, workflow, workflow chart, workflow diagram. The prominent colors used in the PowerPoint template are Orange, Green, and Blue

6 Converging Issues Representing Single Process Circular Flow Layout Chart PowerPoint Slides
We present our 6 converging issues representing single process Circular Flow Layout Chart PowerPoint Slides.Download and present our Symbol PowerPoint Templates because with the help of our Slides you can Illustrate these thoughts with this slide. Use our Arrows PowerPoint Templates because there is a vision, a need you can meet. Present our Shapes PowerPoint Templates because health of the determines the quality of our lives. Use our Business PowerPoint Templates because the great Bald headed Eagle embodies your personality. the eagle eye to seize upon the smallest of opportunities. Present our Process and Flows PowerPoint Templates because this is an excellent slide to detail and highlight your thought process, your views and your positive expectations..Use these PowerPoint slides for presentations relating to 3d, Abstract, Arrow, Business, Chart, Circle, Circular, Collection, Color, Continuity, Cycle, Decoration, Design, Diagram, Dimensional, Direction, Element, Flow, Glossy, Graph, Icon, Illustration, Isolated, Modern, Motion, Movement, Pattern, Pie, Recycling, Repetition, Report, Ring, Round, Scheme, Section, Set, Shape, Shiny, Sign, Slice, Spinning, Symbol. The prominent colors used in the PowerPoint template are Green, Gray, Black. PowerPoint presentation experts tell us our 6 converging issues representing single process Circular Flow Layout Chart PowerPoint Slides are Majestic. People tell us our Collection PowerPoint templates and PPT Slides are Fancy. People tell us our 6 converging issues representing single process Circular Flow Layout Chart PowerPoint Slides are Glamorous. Presenters tell us our Color PowerPoint templates and PPT Slides help you meet deadlines which are an element of today's workplace. Just browse and pick the slides that appeal to your intuitive senses. Customers tell us our 6 converging issues representing single process Circular Flow Layout Chart PowerPoint Slides will get their audience's attention. The feedback we get is that our Chart PowerPoint templates and PPT Slides are Radiant.

Customer Focused Marketing Sample Diagram Example Ppt Presentation
This is a customer focused marketing sample diagram example ppt presentation. This is a four stage process. The stages in this process are learn about approaches, gain commitment to change, opportunity, measure and share results, participate in user groups and communities, adopt and use solutions, acquire solution components, make decision, compare alternatives, build business case, identify possible solutions, define requirements, engage, discover, buy, explore.
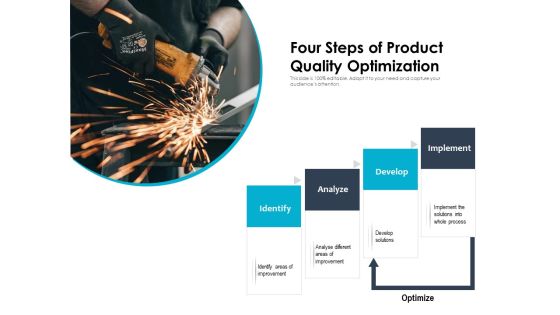
Four Steps Of Product Quality Optimization Ppt PowerPoint Presentation Inspiration Graphics Tutorials PDF
Pitch your topic with ease and precision using this four steps of product quality optimization ppt powerpoint presentation inspiration graphics tutorials pdf. This layout presents information on solutions, process, develop, analyze, identify. It is also available for immediate download and adjustment. So, changes can be made in the color, design, graphics or any other component to create a unique layout.
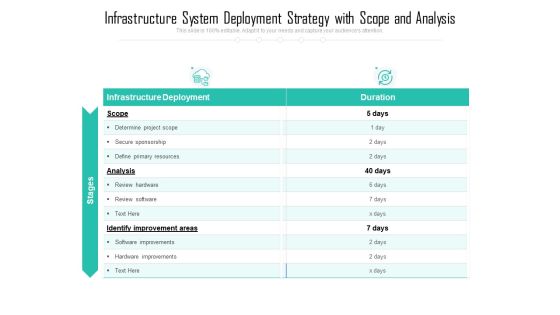
Infrastructure System Deployment Strategy With Scope And Analysis Ppt PowerPoint Presentation Infographics Infographic Template PDF
Pitch your topic with ease and precision using this infrastructure system deployment strategy with scope and analysis ppt powerpoint presentation infographics infographic template pdf. This layout presents information on infrastructure deployment, scope, analysis, identify improvement areas. It is also available for immediate download and adjustment. So, changes can be made in the color, design, graphics or any other component to create a unique layout.

Business Opportunity To Develop Brand Positioning Inspiration PDF
Pitch your topic with ease and precision using this business opportunity to develop brand positioning inspiration pdf. This layout presents information on identify, position, deliver. It is also available for immediate download and adjustment. So, changes can be made in the color, design, graphics or any other component to create a unique layout.
 Home
Home