AI PPT Maker
Templates
PPT Bundles
Design Services
Business PPTs
Business Plan
Management
Strategy
Introduction PPT
Roadmap
Self Introduction
Timelines
Process
Marketing
Agenda
Technology
Medical
Startup Business Plan
Cyber Security
Dashboards
SWOT
Proposals
Education
Pitch Deck
Digital Marketing
KPIs
Project Management
Product Management
Artificial Intelligence
Target Market
Communication
Supply Chain
Google Slides
Research Services
 One Pagers
All Categories
-
Home
- Customer Favorites
- Features List
Features List

Social Network Promotion Campaign Performance Report Demonstration PDF
The purpose of this slide is to highlight the digital marketing campaigning performance report to track information in real-time like new leads acquired, total leads, and revenue on monthly basis. The leads generated through various platforms are Twitter, Facebook, LinkedIn, etc. Pitch your topic with ease and precision using this Social Network Promotion Campaign Performance Report Demonstration PDF. This layout presents information on Sales Ready Leads, New Leads, New Revenue. It is also available for immediate download and adjustment. So, changes can be made in the color, design, graphics or any other component to create a unique layout.
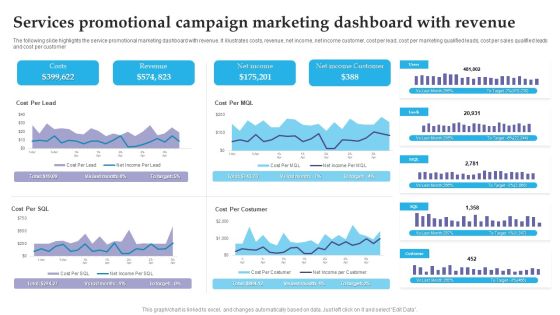
Services Promotional Campaign Marketing Dashboard With Revenue Brochure PDF
The following slide highlights the service promotional marketing dashboard with revenue. It illustrates costs, revenue, net income, net income customer, cost per lead, cost per marketing qualified leads, cost per sales qualified leads and cost per customer. Pitch your topic with ease and precision using this Services Promotional Campaign Marketing Dashboard With Revenue Brochure PDF. This layout presents information on Costs, Revenue, Net Income. It is also available for immediate download and adjustment. So, changes can be made in the color, design, graphics or any other component to create a unique layout.
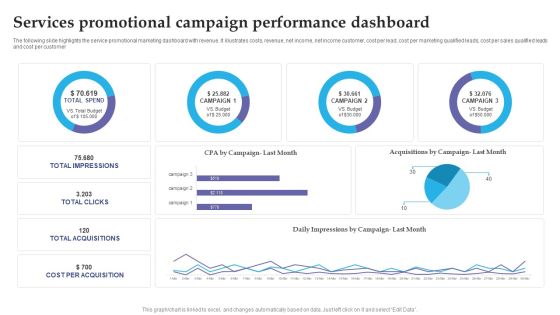
Services Promotional Campaign Performance Dashboard Slides PDF
The following slide highlights the service promotional marketing dashboard with revenue. It illustrates costs, revenue, net income, net income customer, cost per lead, cost per marketing qualified leads, cost per sales qualified leads and cost per customer. Pitch your topic with ease and precision using this Services Promotional Campaign Performance Dashboard Slides PDF. This layout presents information on Services Promotional, Campaign Performance Dashboard. It is also available for immediate download and adjustment. So, changes can be made in the color, design, graphics or any other component to create a unique layout.

Comparative Impact Of Digital Innovation On Different Sectors Background PDF
The following slide highlights the technologies explored in bio pharma after digital revolution. It illustrates N glycan annotation, liquid handling robots, laboratory information system, headspace sampling and metabolics data analysis. Pitch your topic with ease and precision using this Comparative Impact Of Digital Innovation On Different Sectors Background PDF. This layout presents information on Retail, Financial Services Sector, Ecommerce. It is also available for immediate download and adjustment. So, changes can be made in the color, design, graphics or any other component to create a unique layout.
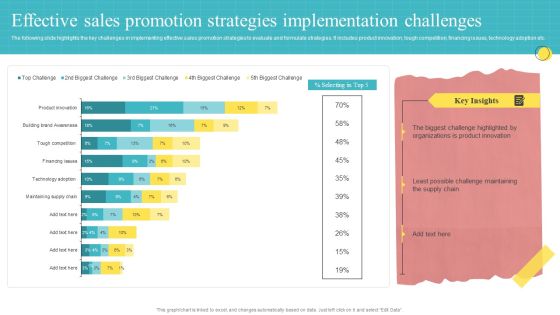
Effective Sales Promotion Strategies Implementation Challenges Ppt PowerPoint Presentation Ideas Graphics Tutorials PDF
The following slide highlights the key challenges in implementing effective sales promotion strategies to evaluate and formulate strategies. It includes product innovation, tough competition, financing issues, technology adoption etc. Pitch your topic with ease and precision using this Effective Sales Promotion Strategies Implementation Challenges Ppt PowerPoint Presentation Ideas Graphics Tutorials PDF. This layout presents information on Biggest Challenge, Product Innovation, Challenge Maintaining. It is also available for immediate download and adjustment. So, changes can be made in the color, design, graphics or any other component to create a unique layout.

Key Insights Of Digital Marketing Administration Ppt PowerPoint Presentation Styles Graphics Template PDF
The following slide highlights the KPIs of digital marketing to assess ROI. It includes monthly active user rate, customer retention rate at the end of the year, current vs previous active users, quarterly growth rate etc.Pitch your topic with ease and precision using this Key Insights Of Digital Marketing Administration Ppt PowerPoint Presentation Styles Graphics Template PDF. This layout presents information on Possible Reasons, Content Marketing, Growth Rate. It is also available for immediate download and adjustment. So, changes can be made in the color, design, graphics or any other component to create a unique layout.

Employee Risk Key Performance Indicator Dashboard With Case Incident Rate Ppt Professional Information PDF
The following slide highlights the employee safety key performance indicator dashboard with case incident rate illustrating total case occurrence rate, last reported case, days without reported, causing items, corrective actions, incident pyramid, incident by month and major causes. Pitch your topic with ease and precision using this Employee Risk Key Performance Indicator Dashboard With Case Incident Rate Ppt Professional Information PDF. This layout presents information on Total Case, Incident Rate, Last Incident Reported, Incident Causing Items. It is also available for immediate download and adjustment. So, changes can be made in the color, design, graphics or any other component to create a unique layout.

Health And Risk KPI Dashboard Ppt Pictures Designs Download PDF
The slide highlights the health and safety key performance indicator dashboard illustrating key headings which includes key objectives, inspections, total reports vs over due reports, injuries by body part and accident trends. Pitch your topic with ease and precision using this Health And Risk KPI Dashboard Ppt Pictures Designs Download PDF. This layout presents information on Key Objectives, Inspections, Accidents Trends. It is also available for immediate download and adjustment. So, changes can be made in the color, design, graphics or any other component to create a unique layout.

Patient Health And Risk Key Performance Indicator Dashboard Ppt Infographic Template Summary PDF
The following slide highlights the patient health and safety key performance indicator dashboard illustrating admission by department, admission by cost, patient satisfaction, total patients, operations cost, patient density, total staff, waiting time, treatment satisfaction and treatment confidence. Pitch your topic with ease and precision using this Patient Health And Risk Key Performance Indicator Dashboard Ppt Infographic Template Summary PDF. This layout presents information on Admission By Department, Admission Vs Cost, Patient Satisfaction. It is also available for immediate download and adjustment. So, changes can be made in the color, design, graphics or any other component to create a unique layout.

Risk Key Performance Indicator Dashboard For Manufacturing Company Ppt Gallery Graphics Design PDF
The following slide highlights the safety key performance indicator dashboard for manufacturing company. It showcases safety incident per employee, total number of cases, safety events avoided, accumulated total and safety incidents. Pitch your topic with ease and precision using this Risk Key Performance Indicator Dashboard For Manufacturing Company Ppt Gallery Graphics Design PDF. This layout presents information on Safety Incidents, Safety Incident Avoided, Safety Incident Accumulated. It is also available for immediate download and adjustment. So, changes can be made in the color, design, graphics or any other component to create a unique layout.
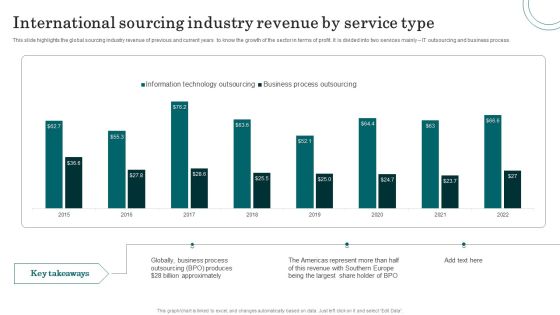
International Sourcing Industry Revenue By Service Type Mockup PDF
This slide highlights the global sourcing industry revenue of previous and current years to know the growth of the sector in terms of profit. It is divided into two services mainly IT outsourcing and business process. Pitch your topic with ease and precision using this International Sourcing Industry Revenue By Service Type Mockup PDF. This layout presents information on Business Process, Revenue, Share Holder. It is also available for immediate download and adjustment. So, changes can be made in the color, design, graphics or any other component to create a unique layout.
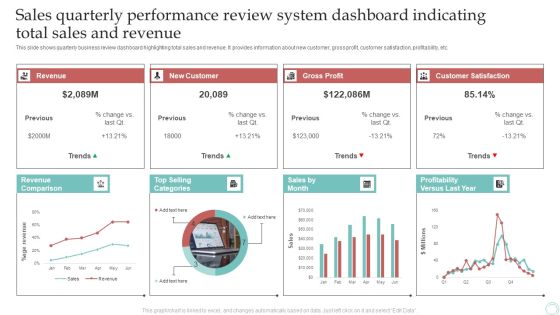
Sales Quarterly Performance Review System Dashboard Indicating Total Sales And Revenue Download PDF
This slide shows quarterly business review dashboard highlighting total sales and revenue. It provides information about new customer, gross profit, customer satisfaction, profitability, etc. Pitch your topic with ease and precision using this Sales Quarterly Performance Review System Dashboard Indicating Total Sales And Revenue Download PDF. This layout presents information on Revenue, New Customer, Gross Profit. It is also available for immediate download and adjustment. So, changes can be made in the color, design, graphics or any other component to create a unique layout.
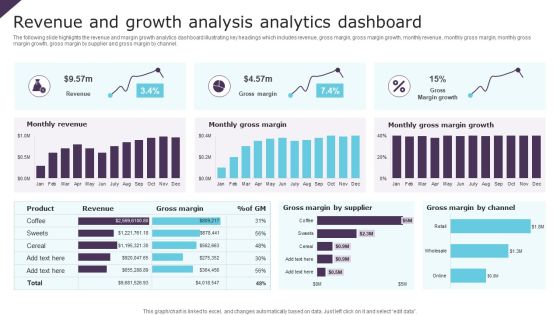
Revenue And Growth Analysis Analytics Dashboard Ppt Infographic Template Brochure PDF
The following slide highlights the revenue and margin growth analytics dashboard illustrating key headings which includes revenue, gross margin, gross margin growth, monthly revenue, monthly gross margin, monthly gross margin growth, gross margin by supplier and gross margin by channel. Pitch your topic with ease and precision using this Revenue And Growth Analysis Analytics Dashboard Ppt Infographic Template Brochure PDF. This layout presents information on Monthly Revenue, Monthly Gross Margin, Gross Margin Growth. It is also available for immediate download and adjustment. So, changes can be made in the color, design, graphics or any other component to create a unique layout.

VR Technology Adoption Barriers Ppt PowerPoint Presentation File Portfolio PDF
The following slide highlights adoption barriers for virtual reality technology. It includes components such as barriers in virtual adoption, virtual reality usage in industries, benefits of workforce development in virtual reality such as, give information in real time, develop training in real-life experience etc. Showcasing this set of slides titled VR Technology Adoption Barriers Ppt PowerPoint Presentation File Portfolio PDF. The topics addressed in these templates are Barriers Virtual, Reality Adoption, Benefits Workforce Development, Virtual Reality. All the content presented in this PPT design is completely editable. Download it and make adjustments in color, background, font etc. as per your unique business setting.
VR Technology Market Overview Ppt PowerPoint Presentation Icon Example PDF
The following slide highlights VR technology market overview, including its growth drivers such as increase in smartphone penetration, post COVID-19 growth of virtual reality market and boost in gaming industry. Pitch your topic with ease and precision using this VR Technology Market Overview Ppt PowerPoint Presentation Icon Example PDF. This layout presents information on Growth Drivers, Key Takeaways, Exponential Virtual Reality. It is also available for immediate download and adjustment. So, changes can be made in the color, design, graphics or any other component to create a unique layout.

Market Analysis Of Smart Farming Tech With Growth Drivers Template PDF
The following slide highlights smart farming tech market analysis with growth drivers to measure progress and track performance. It include growth drivers such as increase demand of weather monitoring system, increase in human resource investment and key insights such as estimated market value, forecasted revenue etc.Pitch your topic with ease and precision using this Market Analysis Of Smart Farming Tech With Growth Drivers Template PDF. This layout presents information on Estimated Growth, Estimated Market Value, Forecasted Revenue. It is also available for immediate download and adjustment. So, changes can be made in the color, design, graphics or any other component to create a unique layout.

Workforce Compensation And Salary Dashboard Brochure PDF
The following slide showcases compensation dashboard that highlights regular payroll tasks. The dashboard includes number of workforce, departments, average performance and sick days, headcount, salary breakdown and number of employees by salary. Pitch your topic with ease and precision using this Workforce Compensation And Salary Dashboard Brochure PDF. This layout presents information on Workforce Compensation, Salary Dashboard. It is also available for immediate download and adjustment. So, changes can be made in the color, design, graphics or any other component to create a unique layout.

Personnel Management Dashboard With Salary And Overtime Data Ideas PDF
The following slide highlights the payroll management dashboard with salary and overtime data illustrating key headings which includes employee cost, average salary, overtime per day, Average base salary and average overtime cost. Pitch your topic with ease and precision using this Personnel Management Dashboard With Salary And Overtime Data Ideas PDF. This layout presents information on Average, Customer Service, Cost. It is also available for immediate download and adjustment. So, changes can be made in the color, design, graphics or any other component to create a unique layout.
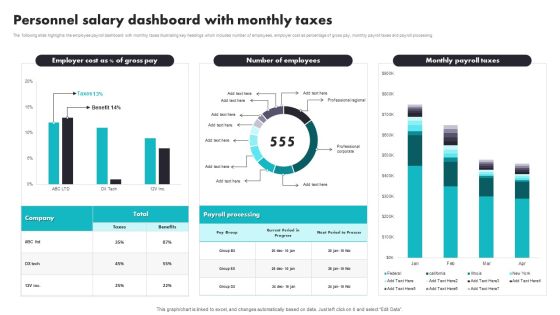
Personnel Salary Dashboard With Monthly Taxes Introduction PDF
The following slide highlights the employee payroll dashboard with monthly taxes illustrating key headings which includes number of employees, employer cost as percentage of gross pay, monthly payroll taxes and payroll processing. Pitch your topic with ease and precision using this Personnel Salary Dashboard With Monthly Taxes Introduction PDF. This layout presents information on Payroll Processing, Benefits. It is also available for immediate download and adjustment. So, changes can be made in the color, design, graphics or any other component to create a unique layout.

Personnel Salary Summary Dashboard With EPF And ESI Data Brochure PDF
The following highlights the slide employee payroll summary dashboard with EPF and ESI data illustrating key headings which includes payroll period, tasks to do, payroll deductions, employee summary and payroll cost. Pitch your topic with ease and precision using this Personnel Salary Summary Dashboard With EPF And ESI Data Brochure PDF. This layout presents information on Employee Provident Fund, Employee State Insurance, Tax Deducted At Source. It is also available for immediate download and adjustment. So, changes can be made in the color, design, graphics or any other component to create a unique layout.

Employee Performance Assessment Comparative Survey Ideas PDF
The given slide highlights the outcome of a skill assessment survey of employees from two different departments Research and Technical. The various skills include team-working, analytical reasoning, complex problem solving, and decision making along with key insights. Pitch your topic with ease and precision using this Employee Performance Assessment Comparative Survey Ideas PDF. This layout presents information on Agility And Adaptability, Team, Research Department. It is also available for immediate download and adjustment. So, changes can be made in the color, design, graphics or any other component to create a unique layout.

Department Wise Saas Organizational Expense Analysis Rules PDF
The following slide highlights the key insight of SaaS current expense incurred by each department compared to the previous years. It includes departments namely, operations, IT, customer support, marketing, sales, finance etc. Pitch your topic with ease and precision using this Department Wise Saas Organizational Expense Analysis Rules PDF. This layout presents information on Department Wise Saas Organizational, Expense Analysis. It is also available for immediate download and adjustment. So, changes can be made in the color, design, graphics or any other component to create a unique layout.

Business Projects Dashboard Template With Risk Status Report Template Topics PDF
The slide showcases a multi-project status report of a construction company. It highlights the project financials, resource allocation, portfolio risk meter and other key project parameters. Pitch your topic with ease and precision using this Business Projects Dashboard Template With Risk Status Report Template Topics PDF. This layout presents information on Portfolio Risk Meter, Project Financials, Project Parameters, Resource Allocation. It is also available for immediate download and adjustment. So, changes can be made in the color, design, graphics or any other component to create a unique layout.

Advantages Of Consumer Level Risk Assessment And Management For Banks Infographics PDF
This slide highlights the implemention of customer level risk assessment and management by banks. it includes the transformation of customer centric retail strategy from product based risk management and operations of traditional banking to bank wide holistic customer oriented customer level management. Pitch your topic with ease and precision using this Advantages Of Consumer Level Risk Assessment And Management For Banks Infographics PDF. This layout presents information on Reduced Risk, Increased Profits, Accelerated Marketing. It is also available for immediate download and adjustment. So, changes can be made in the color, design, graphics or any other component to create a unique layout.

Business Executive Summary KPI Dashboard For Year 2023 Graphics PDF
The following slide highlights the overall business performance for the financial year 2021 to assess variations and trace accuracy. It includes KPIs such as total income, expenditures, revenue and expense breakdown, fund structure etc. Pitch your topic with ease and precision using this Business Executive Summary KPI Dashboard For Year 2023 Graphics PDF. This layout presents information on Revenue Breakdown, Revenue Category, Expense Breakdown. It is also available for immediate download and adjustment. So, changes can be made in the color, design, graphics or any other component to create a unique layout.
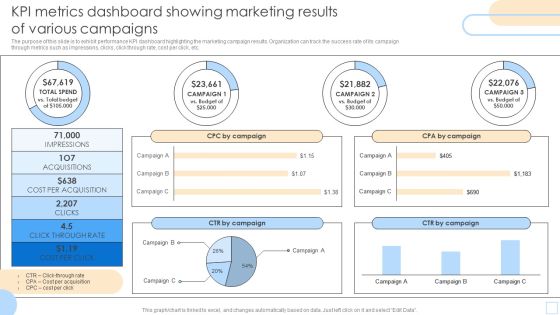
KPI Metrics Dashboard Showing Marketing Results Of Various Campaigns Pictures PDF
The purpose of this slide is to exhibit performance KPI dashboard highlighting the marketing campaign results. Organization can track the success rate of its campaign through metrics such as impressions, clicks, click through rate, cost per click, etc. Pitch your topic with ease and precision using this KPI Metrics Dashboard Showing Marketing Results Of Various Campaigns Pictures PDF. This layout presents information on Impressions, Acquisitions, CPA By Campaign. It is also available for immediate download and adjustment. So, changes can be made in the color, design, graphics or any other component to create a unique layout.
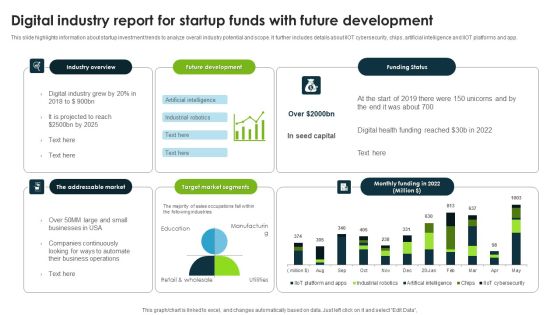
Digital Industry Report For Startup Funds With Future Development Pictures PDF
This slide highlights information about startup investment trends to analyze overall industry potential and scope. It further includes details about IIOT cybersecurity, chips, artificial intelligence and IIOT platforms and app. Pitch your topic with ease and precision using this Digital Industry Report For Startup Funds With Future Development Pictures PDF. This layout presents information on Industry Overview, Future Development, Target Market Segments. It is also available for immediate download and adjustment. So, changes can be made in the color, design, graphics or any other component to create a unique layout.
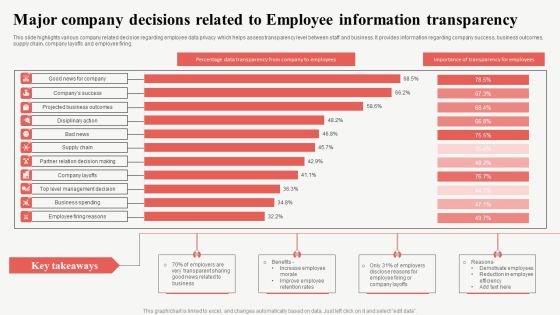
Major Company Decisions Related To Employee Information Transparency Professional PDF
This slide highlights various company related decision regarding employee data privacy which helps assess transparency level between staff and business. It provides information regarding company success, business outcomes, supply chain, company layoffs and employee firing. Pitch your topic with ease and precision using this Major Company Decisions Related To Employee Information Transparency Professional PDF. This layout presents information on Projected Business Outcomes, Supply Chain, Company Layoffs. It is also available for immediate download and adjustment. So, changes can be made in the color, design, graphics or any other component to create a unique layout.

FMCG New Product Release Budget Formats PDF
This slide highlights food manufacturing companys expenditure for releasing new product in the market. It includes activities such as market research, product testing, obtaining marketing right, social media marketing and digital campaigns along with estimated and actual budget. Pitch your topic with ease and precision using this FMCG New Product Release Budget Formats PDF. This layout presents information on Market Research, Product Testing, Obtaining Marketing Right. It is also available for immediate download and adjustment. So, changes can be made in the color, design, graphics or any other component to create a unique layout.
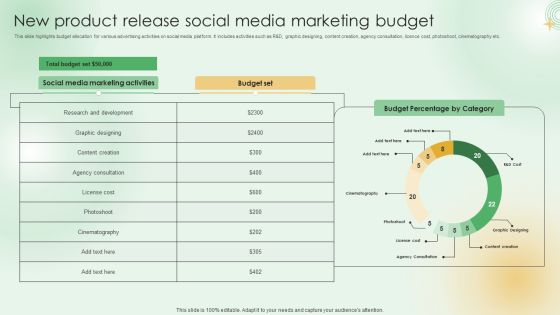
New Product Release Social Media Marketing Budget Clipart PDF
This slide highlights budget allocation for various advertising activities on social media platform. It includes activities such as R and D, graphic designing, content creation, agency consultation, licence cost, photoshoot, cinematography etc. Pitch your topic with ease and precision using this New Product Release Social Media Marketing Budget Clipart PDF. This layout presents information on Total Budget Set, Social Media Marketing Activities, Budget Percentage Category. It is also available for immediate download and adjustment. So, changes can be made in the color, design, graphics or any other component to create a unique layout.

Description Product Sales Performance Analysis Dashboard Ppt PowerPoint Presentation File Samples PDF
The following slide highlights the KPIs of product sales to assess sales performance over the past few years to formulate new strategy. It includes elements such as revenue, offline and online sales, monthly cost analysis etc. Pitch your topic with ease and precision using this Description Product Sales Performance Analysis Dashboard Ppt PowerPoint Presentation File Samples PDF. This layout presents information on Product Wise Revenue, Monthly Cost Analysis, Sales Revenue, Different Strategies. It is also available for immediate download and adjustment. So, changes can be made in the color, design, graphics or any other component to create a unique layout.

Actual Time Marketing Challenges In Using Social Data Ppt PowerPoint Presentation Icon Infographics PDF
The slide inculcates a survey highlighting various barriers in real-time marketing for using social data to increase customer engagement. Various challenges included are inadequate budget, inappropriate skills, limited search analytical tools, etc. Pitch your topic with ease and precision using this Actual Time Marketing Challenges In Using Social Data Ppt PowerPoint Presentation Icon Infographics PDF. This layout presents information on Inadequate Budget, Inappropriate Skills, Limited Staff Abilities, Quick Responses. It is also available for immediate download and adjustment. So, changes can be made in the color, design, graphics or any other component to create a unique layout.
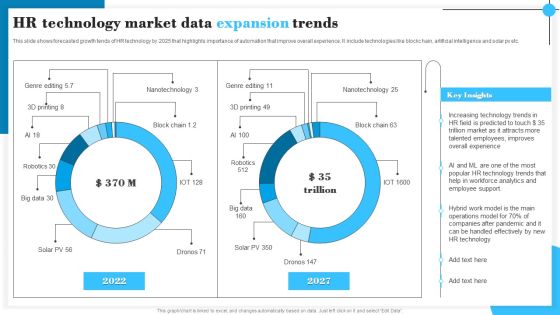
HR Technology Market Data Expansion Trends Information PDF
This slide shows forecasted growth tends of HR technology by 2025 that highlights importance of automation that improve overall experience. It include technologies like blockc hain, artificial intelligence and solar pv etc. Pitch your topic with ease and precision using this HR Technology Market Data Expansion Trends Information PDF. This layout presents information on Increasing Technology, Talented Employees, Employee Support. It is also available for immediate download and adjustment. So, changes can be made in the color, design, graphics or any other component to create a unique layout.

Company Payout Dashboard For Transaction Data Collection Themes PDF
The slide covers a dashboard to highlight the status of current and previous transactions. Various elements included are card details, my cash, my savings, money sent, amount transfers, transaction history, etc. Pitch your topic with ease and precision using this Company Payout Dashboard For Transaction Data Collection Themes PDF. This layout presents information on Amount Transfers, Earning Month, Previous Transaction. It is also available for immediate download and adjustment. So, changes can be made in the color, design, graphics or any other component to create a unique layout.
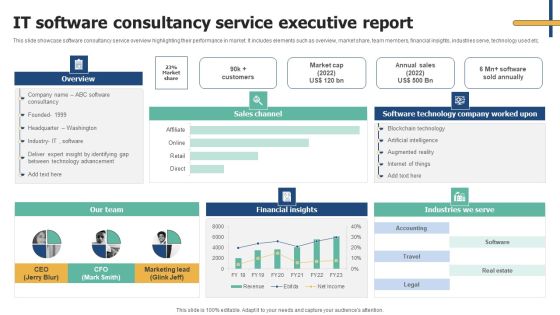
IT Software Consultancy Service Executive Report Structure PDF
This slide showcase software consultancy service overview highlighting their performance in market. It includes elements such as overview, market share, team members, financial insights, industries serve, technology used etc. Pitch your topic with ease and precision using this IT Software Consultancy Service Executive Report Structure PDF. This layout presents information on Financial Insights, Our Team, Industries We Serve. It is also available for immediate download and adjustment. So, changes can be made in the color, design, graphics or any other component to create a unique layout.

Major Abilities Required For Effective Corporate Communication Template PDF
The slide demonstrates a survey report highlighting the major communication skills required to share information within the organization. Various skills involved are non-verbal communication, written communication, emotional intelligence, etc. Pitch your topic with ease and precision using this Major Abilities Required For Effective Corporate Communication Template PDF. This layout presents information on Effective Communication, Skill Required, Boosts Teamwork. It is also available for immediate download and adjustment. So, changes can be made in the color, design, graphics or any other component to create a unique layout.
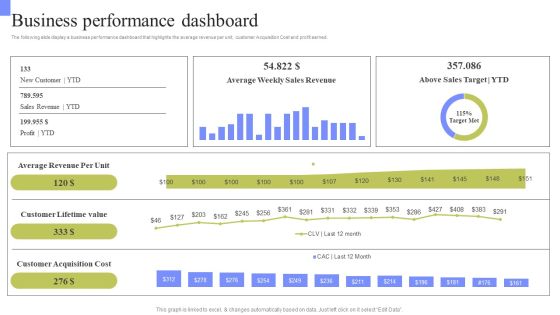
Periodic Revenue Model Business Performance Dashboard Rules PDF
The following slide display a business performance dashboard that highlights the average revenue per unit, customer Acquisition Cost and profit earned. This Periodic Revenue Model Business Performance Dashboard Rules PDF from Slidegeeks makes it easy to present information on your topic with precision. It provides customization options, so you can make changes to the colors, design, graphics, or any other component to create a unique layout. It is also available for immediate download, so you can begin using it right away. Slidegeeks has done good research to ensure that you have everything you need to make your presentation stand out. Make a name out there for a brilliant performance.

Robotic Process Automation Systemrpa For Small Business Improving Return On Investment Dashboard Ideas PDF
The following slide highlights improving return on investment using robotic process automation to streamline workflows, flexibility and responsiveness etc. It includes components such as total bots, total hours saved, total money saved, total bot runtime, hours saved by bots, results distribution, most popular flows etc. Showcasing this set of slides titled Robotic Process Automation Systemrpa For Small Business Improving Return On Investment Dashboard Ideas PDF. The topics addressed in these templates are Results Distribution, Popular Flows, Runtime. All the content presented in this PPT design is completely editable. Download it and make adjustments in color, background, font etc. as per your unique business setting.
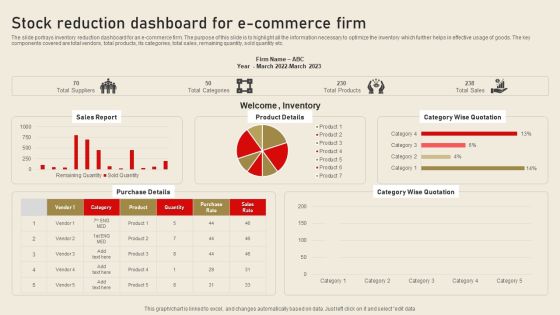
Stock Reduction Dashboard For E Commerce Firm Ideas PDF
The slide portrays inventory reduction dashboard for an e commerce firm. The purpose of this slide is to highlight all the information necessary to optimize the inventory which further helps in effective usage of goods. The key components covered are total vendors, total products, its categories, total sales, remaining quantity, sold quantity etc. Showcasing this set of slides titled Stock Reduction Dashboard For E Commerce Firm Ideas PDF. The topics addressed in these templates are Sales Report, Product Details, Category Wise Quotation. All the content presented in this PPT design is completely editable. Download it and make adjustments in color, background, font etc. as per your unique business setting.
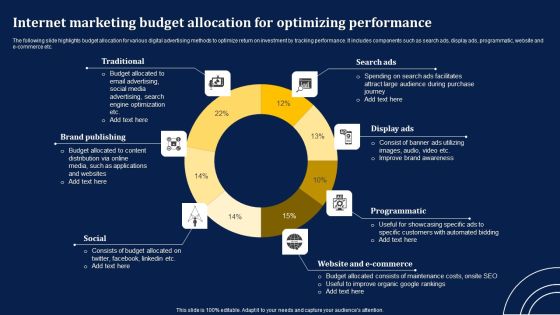
Internet Marketing Budget Allocation For Optimizing Performance Summary PDF
The following slide highlights budget allocation for various digital advertising methods to optimize return on investment by tracking performance. It includes components such as search ads, display ads, programmatic, website and e-commerce etc. Showcasing this set of slides titled Internet Marketing Budget Allocation For Optimizing Performance Summary PDF. The topics addressed in these templates are Search Ads, Display Ads, Programmatic. All the content presented in this PPT design is completely editable. Download it and make adjustments in color, background, font etc. as per your unique business setting.

E Commerce Sales Order Processing Services Market Report Structure PDF
The following slide highlights market report for e-commerce services for sales order fulfilment. It includes components such as warehousing, storage fulfilment services, bundling fulfilment services, key insights, key companies etc. Showcasing this set of slides titled E Commerce Sales Order Processing Services Market Report Structure PDF. The topics addressed in these templates are Expected Revenue Forecast, Growth Rate, Market Size Value. All the content presented in this PPT design is completely editable. Download it and make adjustments in color, background, font etc. as per your unique business setting.
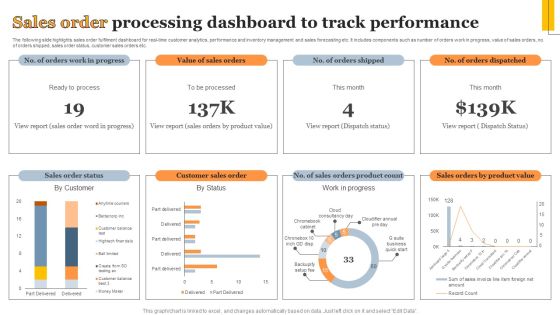
Sales Order Processing Dashboard To Track Performance Information PDF
The following slide highlights sales order fulfilment dashboard for real-time customer analytics, performance and inventory management and sales forecasting etc. It includes components such as number of orders work in progress, value of sales orders, no. of orders shipped, sales order status, customer sales orders etc. Showcasing this set of slides titled Sales Order Processing Dashboard To Track Performance Information PDF. The topics addressed in these templates are Sales Order Status, Customer Sales Order, Work Progress. All the content presented in this PPT design is completely editable. Download it and make adjustments in color, background, font etc. as per your unique business setting.

Strategic Market Insight Implementation Guide Product Yearly Sales Trend Analysis Sample Clipart PDF
The following slide showcases a graph of yearly sales for analyzing trends over different periods. It highlights components such as yearly product sales, data analysis and key reasons. Slidegeeks is one of the best resources for PowerPoint templates. You can download easily and regulate Strategic Market Insight Implementation Guide Product Yearly Sales Trend Analysis Sample Clipart PDF for your personal presentations from our wonderful collection. A few clicks is all it takes to discover and get the most relevant and appropriate templates. Use our Templates to add a unique zing and appeal to your presentation and meetings. All the slides are easy to edit and you can use them even for advertisement purposes.

Corporate Driving Innovation Hub Trends Download PDF
The following slide highlights the key statistical trends in corporate innovation center to attain expertise and optimize resources. It includes the data associated with the number of innovation centers across worldwide. Pitch your topic with ease and precision using this Corporate Driving Innovation Hub Trends Download PDF. This layout presents information on Worldwide, Key Insights, Hub Trends. It is also available for immediate download and adjustment. So, changes can be made in the color, design, graphics or any other component to create a unique layout.

Online Enterprise Customer Activity Overview Dashboard Download PDF
The following slide highlights the key performance indicators of online customer activity to create better user experience. It includes KPAs such as website traffic, device breakdown summary, average time spent etc. Pitch your topic with ease and precision using this Online Enterprise Customer Activity Overview Dashboard Download PDF. This layout presents information on Device, Analysis, Summary. It is also available for immediate download and adjustment. So, changes can be made in the color, design, graphics or any other component to create a unique layout.
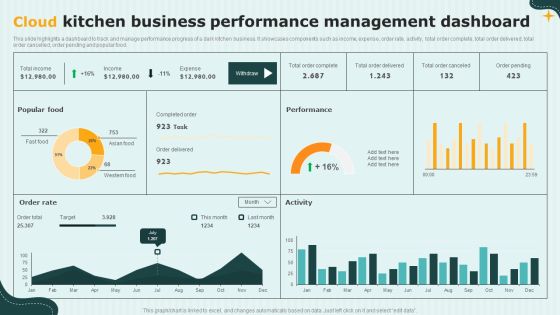
International Cloud Kitchen Industry Analysis Cloud Kitchen Business Performance Management Guidelines PDF
This slide highlights a dashboard to track and manage performance progress of a dark kitchen business. It showcases components such as income, expense, order rate, activity, total order complete, total order delivered, total order cancelled, order pending and popular food. From laying roadmaps to briefing everything in detail, our templates are perfect for you. You can set the stage with your presentation slides. All you have to do is download these easy-to-edit and customizable templates. International Cloud Kitchen Industry Analysis Cloud Kitchen Business Performance Management Guidelines PDF will help you deliver an outstanding performance that everyone would remember and praise you for. Do download this presentation today.

Customer Service E Mail Response Time Utilization Analysis Portrait PDF
The following slide highlights the time that customer expects e-mail response to enhance loyal customer base. It includes elements of response time immediate, less than one hr., within a day, two day etc. Pitch your topic with ease and precision using this Customer Service E Mail Response Time Utilization Analysis Portrait PDF. This layout presents information on Customer Service, E Mail Response, Time Utilization Analysis. It is also available for immediate download and adjustment. So, changes can be made in the color, design, graphics or any other component to create a unique layout.

Customer Experience Analysis Survey Outcome Percentage Portrait PDF
The following slide highlights percentage of results to analyze and enhance customer experience. It includes key elements such as customer experience with product, global net promoter score, regional sales agent performance, satisfaction channel, quarterly NPS, etc. Pitch your topic with ease and precision using this Customer Experience Analysis Survey Outcome Percentage Portrait PDF. This layout presents information on Customer Experience, Promoter Score, Regional Sales. It is also available for immediate download and adjustment. So, changes can be made in the color, design, graphics or any other component to create a unique layout.

Property Trust Investment Fundraising Facts And Figures Background PDF
This slide highlights a statistical data showing global facts in private real estate fundraising investments. It includes key components such as yearly statistics, number of funds closed, aggregate capital raised, debt, core, core plus, value added, opportunistic, distressed, etc.Showcasing this set of slides titled Property Trust Investment Fundraising Facts And Figures Background PDF. The topics addressed in these templates are Closed At Maximum, Opportunistic Funds. All the content presented in this PPT design is completely editable. Download it and make adjustments in color, background, font etc. as per your unique business setting.

KPI Dashboard To Monitor Performance Of Dcaas Pictures PDF
Following slide highlights major benefits of applying data center as a service to business operations which can be used by businesses looking to modernize their IT infrastructure. Major benefits are in terms of scalability, flexibility, cost effectiveness, and security. Pitch your topic with ease and precision using this KPI Dashboard To Monitor Performance Of Dcaas Pictures PDF. This layout presents information on Customer Type, Counts By Model Attributes, Items By Status. It is also available for immediate download and adjustment. So, changes can be made in the color, design, graphics or any other component to create a unique layout.
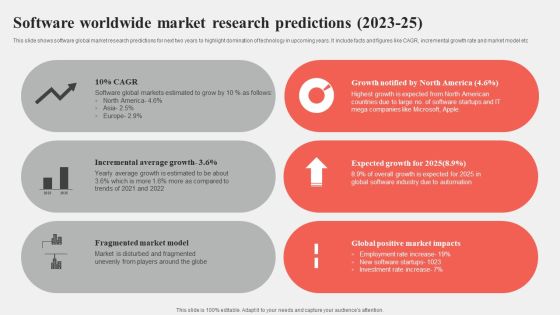
Software Worldwide Market Research Predictions 2023 25 Graphics PDF
This slide shows software global market research predictions for next two years to highlight domination of technology in upcoming years. It include facts and figures like CAGR, incremental growth rate and market model etc Pitch your topic with ease and precision using this Software Worldwide Market Research Predictions 2023 25 Graphics PDF. This layout presents information on Average Growth, Market Model, Market Impacts. It is also available for immediate download and adjustment. So, changes can be made in the color, design, graphics or any other component to create a unique layout.

AI Property Impact On Real Estate Property Management Brochure PDF
Following slide showcases impact of robotic process automation on real estate business activities which can lead to future organisational growth. It includes key components such as account consolidation, refund management, coupon management, payment correction, and accounts modification. Showcasing this set of slides titled AI Property Impact On Real Estate Property Management Brochure PDF. The topics addressed in these templates are Impact Robotic Process Automation, Highlight General Ledge, Notifications Accounts Management. All the content presented in this PPT design is completely editable. Download it and make adjustments in color, background, font etc. as per your unique business setting.
Tracking Performance Of Cloud Storage Deployment Dashboard Portrait PDF
The following slide highlights implementation of cloud storage performance tracking dashboard to improve innovation, to attain faster time to market. It includes components such as pinned folders, storage usage, recently used files, documents, images, videos, music, fonts, projects etc. Showcasing this set of slides titled Tracking Performance Of Cloud Storage Deployment Dashboard Portrait PDF. The topics addressed in these templates are Storage Usage, Dashboard, Tracking. All the content presented in this PPT design is completely editable. Download it and make adjustments in color, background, font etc. as per your unique business setting.

Bookkeeping Payable Automation Invoice Processing Dashboard Summary PDF
The following slide highlights dashboard for accounts payable automation. It includes components such as purchase order invoices, approval pending, approved, invoice status, processed status, total invoice scanned, top 5 exceptions etc. Showcasing this set of slides titled Bookkeeping Payable Automation Invoice Processing Dashboard Summary PDF. The topics addressed in these templates are Processor Productivity, Bookkeeping Payable Automation, Invoice Processing Dashboard. All the content presented in this PPT design is completely editable. Download it and make adjustments in color, background, font etc. as per your unique business setting.

Degree Of Bookkeeping And Finance Activities Automation Graphics PDF
The following slide highlights automation of finance and accounting activities using software. It includes tasks such as external reporting and financial controlling, cash disbursement, revenue management, tax, general accounting and analysis, general accounting operations, treasury, risk management etc. Pitch your topic with ease and precision using this Degree Of Bookkeeping And Finance Activities Automation Graphics PDF. This layout presents information on Tax Automation, Business Intelligence, Revenue Management. It is also available for immediate download and adjustment. So, changes can be made in the color, design, graphics or any other component to create a unique layout.

Post Website Go Live Marketing Strategy Demonstration PDF
The following slide highlights some strategies post company website go-live to gain customer trust and expand reach. It includes activities such as setting benchmarks, improving keyword performance, drafting content calendar, monitoring website health etc. Persuade your audience using this Post Website Go Live Marketing Strategy Demonstration PDF. This PPT design covers five stages, thus making it a great tool to use. It also caters to a variety of topics including Set Benchmarks, Monitor Website Health, Draft Content Calendar. Download this PPT design now to present a convincing pitch that not only emphasizes the topic but also showcases your presentation skills.

Best Practices For Building Social Media Visibility Portrait PDF
The slide highlights the tips to develop social media presence for increasing customer engagement. Various best practices included are use multiple channels, focus on profiles, develop content calendar and reply users Presenting Best Practices For Building Social Media Visibility Portrait PDF to dispense important information. This template comprises four stages. It also presents valuable insights into the topics including Multiple Channels, Profiles, Calendar. This is a completely customizable PowerPoint theme that can be put to use immediately. So, download it and address the topic impactfully.

Operations Administrator Experience Based Salary Structure Structure PDF
This slide showcases comparative assessment of operations executive salary range by different experience level. It includes key components such as annual salary range, and years of experience. Pitch your topic with ease and precision using this Operations Administrator Experience Based Salary Structure Structure PDF. This layout presents information on Budget Management, Strategic Planning, Management, Operations Executive, Responsibilities. It is also available for immediate download and adjustment. So, changes can be made in the color, design, graphics or any other component to create a unique layout.

Introducing AI Tools Impact Of Manual Process On Business Performance Ideas PDF
The following slide outlines the impact of current manual process on organization performance. The organization faces various issues such as reduction in productivity, bottom line and increase in error rate. If you are looking for a format to display your unique thoughts, then the professionally designed Introducing AI Tools Impact Of Manual Process On Business Performance Ideas PDF is the one for you. You can use it as a Google Slides template or a PowerPoint template. Incorporate impressive visuals, symbols, images, and other charts. Modify or reorganize the text boxes as you desire. Experiment with shade schemes and font pairings. Alter, share or cooperate with other people on your work. Download Introducing AI Tools Impact Of Manual Process On Business Performance Ideas PDF and find out how to give a successful presentation. Present a perfect display to your team and make your presentation unforgettable.
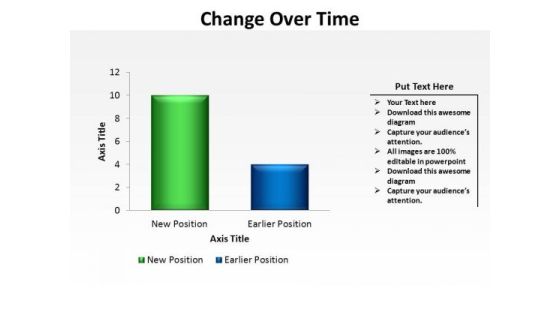
PowerPoint Designs Data Driven Change Over Time Ppt Design
PowerPoint Designs Data Driven Change Over Time PPT Design-The graphic is a symbol of growth and success. Display your ideas and highlight their ability to accelerate the growth of your company and you. Impress upon the audience how your strategy will carry all to the top of the corporate heap.
