Feature Comparison

Online Tour And Travel Company Profile Service Based Comparison Brochure PDF
This slide represents the company comparison with competitors by service which includes air ticketing, hotels and lodge reservation, car rental, travel documentation and insurance, vacation packages, etc. Deliver an awe inspiring pitch with this creative Online Tour And Travel Company Profile Service Based Comparison Brochure PDF bundle. Topics like Lodge Reservation, Vacation Packages, Travel Insurance can be discussed with this completely editable template. It is available for immediate download depending on the needs and requirements of the user.

Cosmetics And Skin Care Company Profile Financial Comparison With Competitors Elements PDF
This slide focuses on comparison with competitors based on financials such as annual revenue, operating expenses, market share, employee count, service coverage, total orders, etc. Deliver an awe inspiring pitch with this creative Cosmetics And Skin Care Company Profile Financial Comparison With Competitors Elements PDF bundle. Topics like Companies, Annual Revenue, Operating Expenses can be discussed with this completely editable template. It is available for immediate download depending on the needs and requirements of the user.

Beauty And Skincare Products Company Profile Market Share Comparison Guidelines PDF
This slide represents the comparison with competitors based on market share which shows our leading company with greatest share in US due to increased sales for skin care and makeup products, etc. Deliver an awe inspiring pitch with this creative Beauty And Skincare Products Company Profile Market Share Comparison Guidelines PDF bundle. Topics like Care Products, Distribution Product, Highest Market can be discussed with this completely editable template. It is available for immediate download depending on the needs and requirements of the user.

Advertising Solutions Company Details Market Share Comparison Ppt PowerPoint Presentation Gallery Guidelines PDF
This slide focuses on market share comparison with competitors which shows our leading company with greatest share in market due to increase in advertising projects in 2022. Deliver an awe inspiring pitch with this creative Advertising Solutions Company Details Market Share Comparison Ppt PowerPoint Presentation Gallery Guidelines PDF bundle. Topics like Key Insights, US Market Share, Competitor can be discussed with this completely editable template. It is available for immediate download depending on the needs and requirements of the user.

Advertisement And Marketing Agency Company Profile Market Share Comparison Graphics PDF
This slide focuses on market share comparison with competitors which shows our leading company with greatest share in market due to increase in advertising projects in 2022. Deliver an awe inspiring pitch with this creative Advertisement And Marketing Agency Company Profile Market Share Comparison Graphics PDF bundle. Topics like US Market Share, Distribution Advertising, Projects Behind, Highest Market Share can be discussed with this completely editable template. It is available for immediate download depending on the needs and requirements of the user.

Outsourcing Financial Accounting Solutions For Company Accounts Cost Comparison Microsoft PDF
This slide shows the comparison of permanent hiring with accounts outsourcing with their cost and position.Presenting outsourcing financial accounting solutions for company accounts cost comparison microsoft pdf to provide visual cues and insights. Share and navigate important information on one stage that need your due attention. This template can be used to pitch topics like certified public accountants, hospitals, retail chains In addtion, this PPT design contains high resolution images, graphics, etc, that are easily editable and available for immediate download.

Makeup And Beauty Care Products Company Profile Financial Comparison With Competitors Sample PDF
This slide focuses on comparison with competitors based on financials such as annual revenue, operating expenses, market share, employee count, service coverage, total orders, etc.Deliver and pitch your topic in the best possible manner with this Makeup And Beauty Care Products Company Profile Financial Comparison With Competitors Sample PDF Use them to share invaluable insights on Annual Revenue, Operating Expenses, Employee Count and impress your audience. This template can be altered and modified as per your expectations. So, grab it now.

Home Interior Styling Services Company Profile Competitor Comparison By Service Infographics PDF
This slide covers the competitor comparison on the basis of services such as space planning, initial cost analysis, electrical plans, millwork drawings, construction finishes, decorative lighting, etc.Deliver an awe inspiring pitch with this creative Home Interior Styling Services Company Profile Competitor Comparison By Service Infographics PDF bundle. Topics like Conceptual Design, Furniture Finishes, Project Management can be discussed with this completely editable template. It is available for immediate download depending on the needs and requirements of the user.

Business Advisory Solutions Company Profile Competitive Comparison By Financials Rules PDF
This slide shows the comparison with competitors on the basis of financials which includes revenue, net profit, market share, employee count and service coverage. Deliver an awe inspiring pitch with this creative Business Advisory Solutions Company Profile Competitive Comparison By Financials Rules PDF bundle. Topics like Highest Revenue, Net Profit, Market Share can be discussed with this completely editable template. It is available for immediate download depending on the needs and requirements of the user.

Employee Headcount Analysis Turnover Comparison Of Two Companies Ppt PowerPoint Presentation Infographics Smartart PDF
This slide shows the comparison of two organizations on the basis of headcount turnover. It includes turnover data of last six years. Showcasing this set of slides titled Employee Headcount Analysis Turnover Comparison Of Two Companies Ppt PowerPoint Presentation Infographics Smartart PDF. The topics addressed in these templates are Highest Turnover, Flexible Working, Lowest. All the content presented in this PPT design is completely editable. Download it and make adjustments in color, background, font etc. as per your unique business setting.

Client Planner Comparison Worksheet For Establishing Financial Direction Ppt PowerPoint Presentation Deck
This is a client planner comparison worksheet for establishing financial direction ppt powerpoint presentation deck. This is a two stage process. The stages in this process are worksheet, financial direction, communication, financial analysis.

Community Capitalization Pitch Deck Competitive Landscape Financial Comparison Count Graphics Pdf
The Slide Provides the Competitive Landscape of the Company on The Basis of Key Financial Information I.E. Number of Users, App Download, Revenue, Employee Count, Operating Net Income Etc. Deliver an awe inspiring pitch with this creative community capitalization pitch deck competitive landscape financial comparison count graphics pdf bundle. Topics like company, employee count, income, competitive landscape financial comparison can be discussed with this completely editable template. It is available for immediate download depending on the needs and requirements of the user.
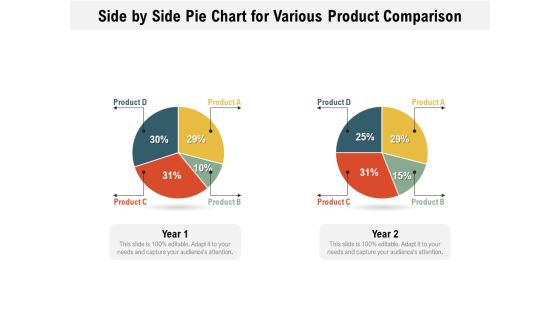
Side By Side Pie Chart For Various Product Comparison Ppt PowerPoint Presentation File Infographics PDF
Pitch your topic with ease and precision using this side by side pie chart for various product comparison ppt powerpoint presentation file infographics pdf. This layout presents information on side by side pie chart for various product comparison. It is also available for immediate download and adjustment. So, changes can be made in the color, design, graphics or any other component to create a unique layout.

Two Product Comparison Report With Price And Hardware Ppt PowerPoint Presentation Gallery Graphics Pictures PDF
Pitch your topic with ease and precision using this two product comparison report with price and hardware ppt powerpoint presentation gallery graphics pictures pdf. This layout presents information on two product comparison report with price and hardware. It is also available for immediate download and adjustment. So, changes can be made in the color, design, graphics or any other component to create a unique layout.

KPI Dashboard Of Customer And Product Sales Performance Comparison Information PDF
This slide shows the KPI dashboard of client and product sales comparison. It also includes sales by location and total sales. Pitch your topic with ease and precision using this KPI Dashboard Of Customer And Product Sales Performance Comparison Information PDF. This layout presents information on Product Sales, Client Sales, Tim Santana. It is also available for immediate download and adjustment. So, changes can be made in the color, design, graphics or any other component to create a unique layout.
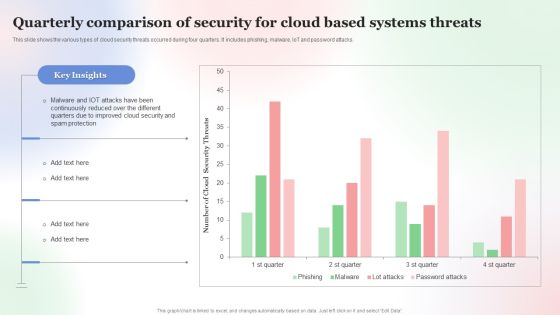
Quarterly Comparison Of Security For Cloud Based Systems Threats Infographics PDF
This slide shows the various types of cloud security threats occurred during four quarters. It includes phishing, malware, IoT and password attacks. Pitch your topic with ease and precision using this Quarterly Comparison Of Security For Cloud Based Systems Threats Infographics PDF. This layout presents information on Quarterly Comparison Of Security, Cloud Based Systems Threats. It is also available for immediate download and adjustment. So, changes can be made in the color, design, graphics or any other component to create a unique layout.

Collective Equity Funding Pitch Deck Competitive Landscape Financial Comparison Operating Infographics PDF
The slide provides the Competitive landscape of the company on the basis of key financial information i.e. number of users, app download, revenue, employee count, operating and net income etc. Deliver an awe-inspiring pitch with this creative collective equity funding pitch deck competitive landscape financial comparison operating infographics pdf. bundle. Topics like competitive landscape financial comparison can be discussed with this completely editable template. It is available for immediate download depending on the needs and requirements of the user.
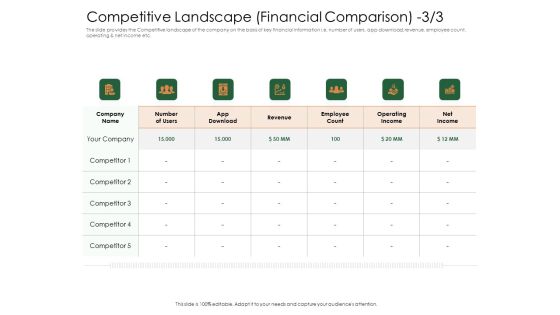
Substitute Financing Pitch Deck Competitive Landscape Financial Comparison Revenue Ideas PDF
The Slide Provides The Competitive Landscape Of The Company On The Basis Of Key Financial Information I.E. Number Of Users, App Download, Revenue, Employee Count, Operating And Net Income Etc. Deliver an awe inspiring pitch with this creative substitute financing pitch deck competitive landscape financial comparison revenue ideas pdf bundle. Topics like competitive landscape financial comparison can be discussed with this completely editable template. It is available for immediate download depending on the needs and requirements of the user.

Revenue And Expenses Comparison Historical Vs Forecasted Ppt Show Outfit PDF
This slide shows the revenue and expenses total of interest and non-interest expenses comparison of the companys historical 2015 to 2019 and forecasted 2020 to 2023 data.Deliver an awe-inspiring pitch with this creative revenue and expenses comparison historical vs forecasted ppt show outfit pdf. bundle. Topics like 2015 to 2024, revenue can be discussed with this completely editable template. It is available for immediate download depending on the needs and requirements of the user

Revenue And Expenses Comparison Historical Vs Forecasted Ppt Show Deck PDF
This slide shows the revenue and expenses total of interest and non interest expenses comparison of the companys historical 2016 to2020 and forecasted 2021 to2024 data.Deliver and pitch your topic in the best possible manner with this revenue and expenses comparison historical vs forecasted ppt show deck pdf. Use them to share invaluable insights on 2015 to 2024, revenue and impress your audience. This template can be altered and modified as per your expectations. So, grab it now.
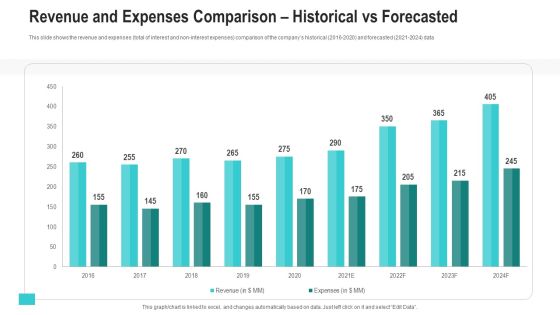
Revenue And Expenses Comparison Historical Vs Forecasted Ppt Show Tips PDF
This slide shows the revenue and expenses total of interest and non-interest expenses comparison of the companys historical 2016-2020 and forecasted 2021-2024 data. Deliver and pitch your topic in the best possible manner with this revenue and expenses comparison historical vs forecasted ppt show tips pdf. Use them to share invaluable insights on revenue, expenses and impress your audience. This template can be altered and modified as per your expectations. So, grab it now.
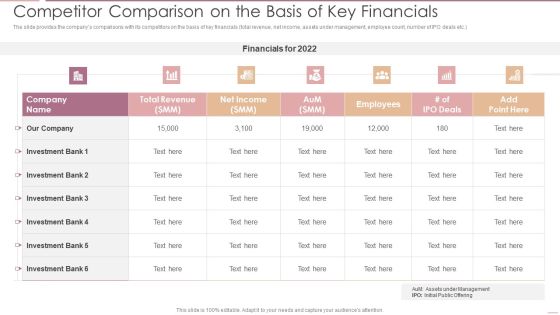
Investment Banking Security Underwriting Pitchbook Competitor Comparison On The Basis Of Key Financials Pictures PDF
The slide provides the companys comparisons with its competitors on the basis of key financials total revenue, net income, assets under management, employee count, number of IPO deals etc.Deliver an awe inspiring pitch with this creative Investment Banking Security Underwriting Pitchbook Competitor Comparison On The Basis Of Key Financials Pictures PDF bundle. Topics like Total Revenue, Net Income, Investment Bank can be discussed with this completely editable template. It is available for immediate download depending on the needs and requirements of the user.

Budget Comparison Of Two Different Projects Ppt PowerPoint Presentation Model PDF
This slide illustrates comparison of budgeted costs of companys projects. It includes various phases like initiation phase, research phase, development phase, etc.Presenting Budget Comparison Of Two Different Projects Ppt PowerPoint Presentation Model PDF to dispense important information. This template comprises one stage. It also presents valuable insights into the topics including Development, Initiation, Testing Phase. This is a completely customizable PowerPoint theme that can be put to use immediately. So, download it and address the topic impactfully.

Internal And External Business Environment Analysis Quantitative Strategy Comparison Matrix For Business Evaluation Microsoft PDF
This slide shows quantitative strategy comparison matrix to compare strategies by evaluation key factors and to choose better alternative option Deliver and pitch your topic in the best possible manner with this internal and external business environment analysis quantitative strategy comparison matrix for business evaluation microsoft pdf Use them to share invaluable insights on opportunities, weaknesses, attractiveness scores and impress your audience. This template can be altered and modified as per your expectations. So, grab it now.

Competitive Analysis Financial Comparison With The Competitors Ppt Summary Topics PDF
This slide shows the competitive analysis of the competitors with various financial comparisons i.e. Total revenue, Total profits, Total number of employees, Total defect claims, etc. Deliver and pitch your topic in the best possible manner with this competitive analysis financial comparison with the competitors ppt summary topics pdf. Use them to share invaluable insights on total revenue, total profit, financial, analysis and impress your audience. This template can be altered and modified as per your expectations. So, grab it now.

Relocation Of Business Process Offshoring Operating Cost Comparison Analysis Infographics PDF
The table shows the operating cost comparison between the home country, country A and country B in million USD, wherein the home country is the most expensive. Deliver an awe-inspiring pitch with this creative relocation of business process offshoring operating cost comparison analysis infographics pdf bundle. Topics like expenses, home country, property rentals, total expenses can be discussed with this completely editable template. It is available for immediate download depending on the needs and requirements of the user.
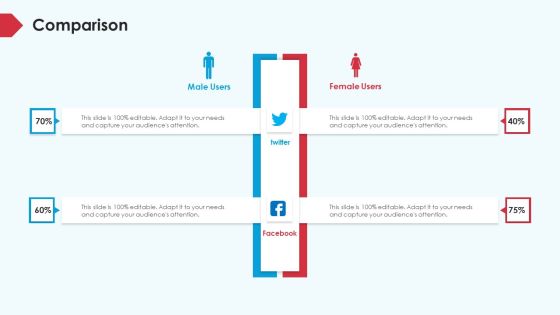
Skill Shortage In A Production Firm Case Study Solution Comparison Ppt Infographic Template Visuals PDF
Presenting skill shortage in a production firm case study solution comparison ppt infographic template visuals pdf to provide visual cues and insights. Share and navigate important information on two stages that need your due attention. This template can be used to pitch topics like comparison, male, female. In addtion, this PPT design contains high resolution images, graphics, etc, that are easily editable and available for immediate download.
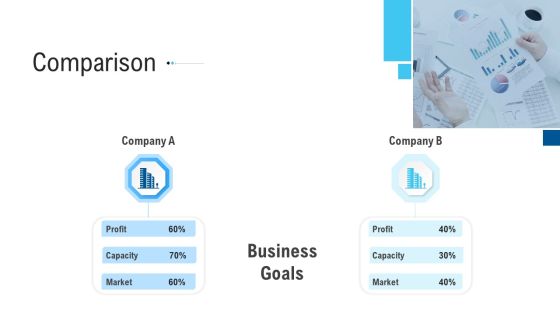
Funding Deck To Raise Grant Funds From Public Organizations Comparison Ppt Show Slide PDF
Presenting funding deck to raise grant funds from public organizations comparison ppt show slide pdf to provide visual cues and insights. Share and navigate important information on two stages that need your due attention. This template can be used to pitch topics like comparison, profit, market, business goals. In addtion, this PPT design contains high resolution images, graphics, etc, that are easily editable and available for immediate download.

Decrease Profits Supply Chain Firm Due To Surge Fuel Prices Business Case Competition Comparison Rules PDF
Presenting decrease profits supply chain firm due to surge fuel prices business case competition comparison rules pdf to provide visual cues and insights. Share and navigate important information on two stages that need your due attention. This template can be used to pitch topics like comparison, male, female. In addtion, this PPT design contains high resolution images, graphics, etc, that are easily editable and available for immediate download.

Agile Development Approach IT Comparison Between Agile Model And Waterfall Ideas PDF
This slide represents the comparison between the agile model and waterfall model and includes conception, initiation, analysis, design, construction, testing, and deployment. Deliver and pitch your topic in the best possible manner with this Agile Development Approach IT Comparison Between Agile Model And Waterfall Ideas PDF. Use them to share invaluable insights on Agile, Waterfall, Project, Deemed Unstructured and impress your audience. This template can be altered and modified as per your expectations. So, grab it now.

Agile Sprint Technique In Software Comparison Between Agile Model And Waterfall Model Guidelines PDF
This slide represents the comparison between the agile model and waterfall model and includes conception, initiation, analysis, design, construction, testing, and deployment.Deliver and pitch your topic in the best possible manner with this Agile Sprint Technique In Software Comparison Between Agile Model And Waterfall Model Guidelines PDF. Use them to share invaluable insights on Deemed Unstructured, Predict Development, Possible Estimate and impress your audience. This template can be altered and modified as per your expectations. So, grab it now.

Business Diagram Comparison Of Physical And Virtual World Explaining Virtualization Ppt Slide
Concept of comparison in between virtual and physical world has been displayed in this diagram. To display this concept we have used graphic of servers in sequential order. Download this editable diagram slide to create an impact on your viewers.
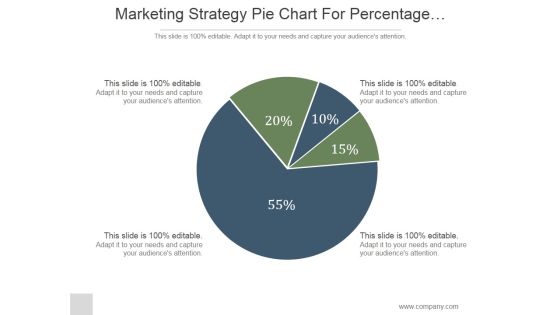
Marketing Strategy Pie Chart For Percentage Comparison Ppt PowerPoint Presentation Ideas
This is a marketing strategy pie chart for percentage comparison ppt powerpoint presentation ideas. This is a four stage process. The stages in this process are marketing, pie, strategy, finance, percentage.

PowerPoint Table Diagram For Comparison And Evaluation Ppt PowerPoint Presentation Microsoft
This is a powerpoint table diagram for comparison and evaluation ppt powerpoint presentation microsoft. This is a three stage process. The stages in this process are financial, attractiveness, strategic, implementation, difficulty.
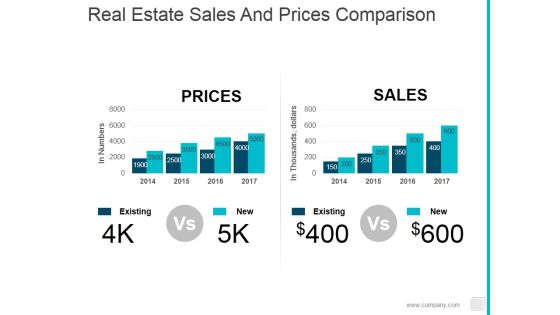
Real Estate Sales And Prices Comparison Ppt PowerPoint Presentation Show Rules
This is a real estate sales and prices comparison ppt powerpoint presentation show rules. This is a two stage process. The stages in this process are existing, new, prices, sales.

Current State Analysis Financial Comparison Ppt PowerPoint Presentation Icon Clipart Images
This is a current state analysis financial comparison ppt powerpoint presentation icon clipart images. This is a five stage process. The stages in this process are business, finance, analysis, marketing, growth, success.

Current State Analysis Financial Comparison Ppt Powerpoint Presentation File Graphic Tips
This is a current state analysis financial comparison ppt powerpoint presentation file graphic tips. This is a five stage process. The stages in this process are revenue, profits, cash balance.
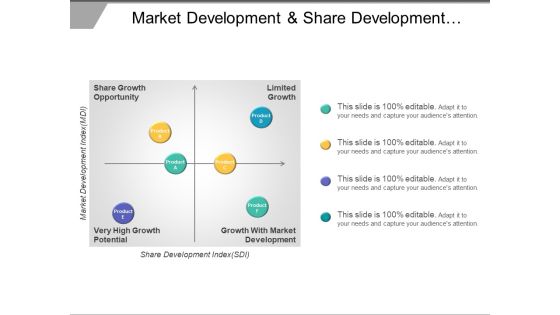
Market Development And Share Development Comparison Matrix Ppt PowerPoint Presentation File Graphics Example
This is a market development and share development comparison matrix ppt powerpoint presentation file graphics example. This is a four stage process. The stages in this process are market overview, market potential, market assessments.
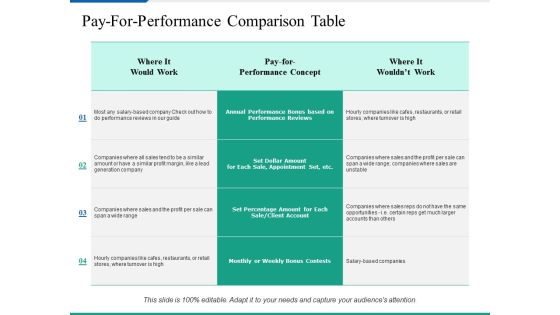
Pay For Performance Comparison Table Ppt PowerPoint Presentation Inspiration Layout Ideas
This is a pay for performance comparison table ppt powerpoint presentation inspiration layout ideas. This is a four stage process. The stages in this process are table, management, business, marketing.

Comparison Ppt PowerPoint Presentation Show Slide Download Ppt PowerPoint Presentation Professional Smartart
This is a comparison ppt powerpoint presentation show slide download ppt powerpoint presentation professional smartart. This is a four stage process. The stages in this process are compare, percentage, finance, business, marketing.

3D Bar Chart For Percentage Values Comparison Ppt PowerPoint Presentation Professional Visual Aids
This is a 3d bar chart for percentage values comparison ppt powerpoint presentation professional visual aids. This is a five stage process. The stages in this process are art, colouring, paint brush.
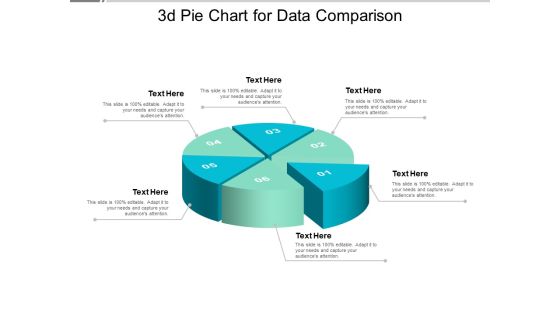
3D Pie Chart For Data Comparison Ppt PowerPoint Presentation Model Design Ideas
This is a 3d pie chart for data comparison ppt powerpoint presentation model design ideas. This is a six stage process. The stages in this process are art, colouring, paint brush.

7 Segments Pie Chart For Statistical Comparison Ppt PowerPoint Presentation Gallery Visual Aids
This is a 7 segments pie chart for statistical comparison ppt powerpoint presentation gallery visual aids. This is a seven stage process. The stages in this process are 6 piece pie chart, 6 segment pie chart, 6 parts pie chart.

8 Sections Pie Chart For Data Comparison Ppt PowerPoint Presentation Show Slideshow
This is a 8 sections pie chart for data comparison ppt powerpoint presentation show slideshow. This is a eight stage process. The stages in this process are 6 piece pie chart, 6 segment pie chart, 6 parts pie chart.

Six Sections Pie Chart For Data Comparison Ppt PowerPoint Presentation Styles Graphics Example
This is a six sections pie chart for data comparison ppt powerpoint presentation styles graphics example. This is a six stage process. The stages in this process are 6 piece pie chart, 6 segment pie chart, 6 parts pie chart.
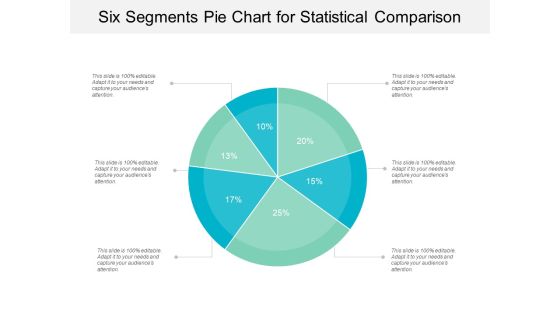
Six Segments Pie Chart For Statistical Comparison Ppt PowerPoint Presentation Gallery Background
This is a six segments pie chart for statistical comparison ppt powerpoint presentation gallery background. This is a six stage process. The stages in this process are 6 piece pie chart, 6 segment pie chart, 6 parts pie chart.
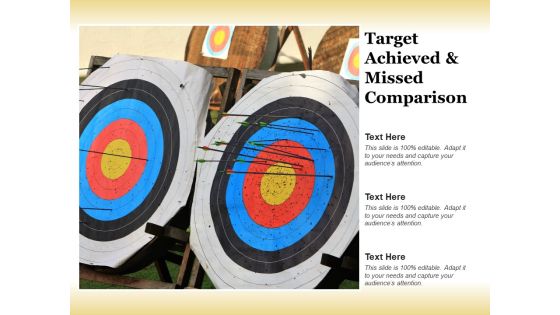
Target Achieved And Missed Comparison Ppt Powerpoint Presentation Visual Aids Deck
This is a target achieved and missed comparison ppt powerpoint presentation visual aids deck. This is a three stage process. The stages in this process are hits and misses, thumb up and thumb down, okay and not okay.

Budgeting Planned Actual Comparison Sample Budget Ppt Ppt PowerPoint Presentation Portfolio Inspiration
This is a budgeting planned actual comparison sample budget ppt ppt powerpoint presentation portfolio inspiration. This is a two stage process. The stages in this process are business, management, strategy, analysis, marketing.

Data Comparison And Analysis Chart Ppt Powerpoint Presentation File Background Images
This is a data comparison and analysis chart ppt powerpoint presentation file background images. This is a four stage process. The stages in this process are data presentation, content presentation, information presentation.

Buying Cycle Research Comparison And Purchase Ppt PowerPoint Presentation Ideas Aids
This is a buying cycle research comparison and purchase ppt powerpoint presentation ideas aids. This is a five stage process. The stages in this process are purchasing process, purchasing cycle, procurement cycle.
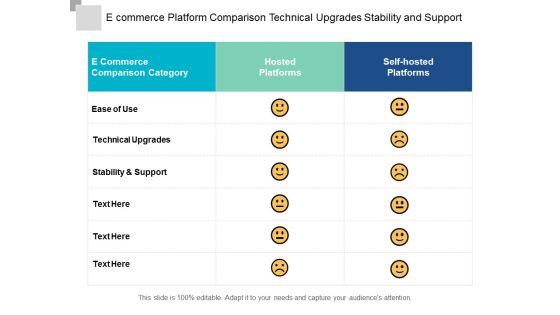
E Commerce Platform Comparison Technical Upgrades Stability And Support Ppt Powerpoint Presentation Layouts
This is a e commerce platform comparison technical upgrades stability and support ppt powerpoint presentation layouts. This is a three stage process. The stages in this process are ecommerce, mercantilism, commercialism.
Product Sales Distribution And Velocity Comparison Ppt PowerPoint Presentation Icon Outline
This is a product sales distribution and velocity comparison ppt powerpoint presentation icon outline. This is a six stage process. The stages in this process are product distribution, distribution system, numeric distribution.
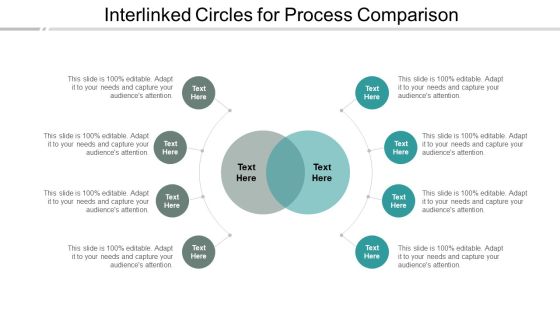
Interlinked Circles For Process Comparison Ppt Powerpoint Presentation File Slide Portrait
This is a interlinked circles for process comparison ppt powerpoint presentation file slide portrait. This is a eight stage process. The stages in this process are circle cluster, cyclic cluster, circular cluster.

Two Clusters Of Circles For Comparison Ppt Powerpoint Presentation Show Objects
This is a two clusters of circles for comparison ppt powerpoint presentation show objects. This is a two stage process. The stages in this process are circle cluster, cyclic cluster, circular cluster.

Comparison Management Marketing Ppt Powerpoint Presentation Infographics Graphics Tutorials Ppt Powerpoint Presentation File Slide
This is a comparison management marketing ppt powerpoint presentation infographics graphics tutorials ppt powerpoint presentation file slide. This is a three stage process. The stages in this process are finance, marketing, management, investment, analysis.
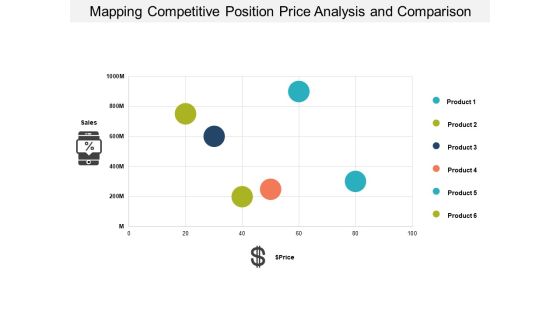
Mapping Competitive Position Price Analysis And Comparison Ppt PowerPoint Presentation Outline Demonstration
This is a mapping competitive position price analysis and comparison ppt powerpoint presentation outline demonstration. This is a six stage process. The stages in this process are competitive analysis, competitive strength assessment.
Percentage Value Comparison Pie Chart Icon Ppt PowerPoint Presentation Model Clipart Images
This is a percentage value comparison pie chart icon ppt powerpoint presentation model clipart images. This is a three stage process. The stages in this process are percentage icon, dividend icon, portion icon.

Database Expansion And Optimization Data Repository Expansion Strategies Comparison Ppt Show Graphics Template
This slide shows the comparison of vertical and horizontal scaling techniques for data repository expansion on parameters such as simplicity, cost, upgrades etc. Deliver and pitch your topic in the best possible manner with this database expansion and optimization data repository expansion strategies comparison ppt show graphics template. Use them to share invaluable insights on strategy, simplicity, cost, upgrades, long run and impress your audience. This template can be altered and modified as per your expectations. So, grab it now.

Data Warehouse Implementation Comparison Between Database And Data Warehouse Template PDF
This slide depicts a comparison between database and data warehouse based on the design, type of information both stores, data sources, data availability, and so on.Deliver and pitch your topic in the best possible manner with this Data Warehouse Implementation Comparison Between Database And Data Warehouse Template PDF. Use them to share invaluable insights on Extensive Informationtransaction Processing, Data Collecting and impress your audience. This template can be altered and modified as per your expectations. So, grab it now.

Online Food Ordering Start Up Businesses Service Comparison Matrix Template PDF
This slide covers comparison table for various services offered by online food ordering solutions. It includes delivery requests, orders management, menu customisation, cost evaluation, etc. Showcasing this set of slides titled Online Food Ordering Start Up Businesses Service Comparison Matrix Template PDF. The topics addressed in these templates are Delivery Request, Orders Management, Menu Customisation. All the content presented in this PPT design is completely editable. Download it and make adjustments in color, background, font etc. as per your unique business setting.

 Home
Home