Executive Summary Metrics

Sales Pipeline Metrics Ppt PowerPoint Presentation Pictures Microsoft Cpb Pdf
Presenting this set of slides with name sales pipeline metrics ppt powerpoint presentation pictures microsoft cpb pdf. This is an editable Powerpoint four stages graphic that deals with topics like sales pipeline metrics to help convey your message better graphically. This product is a premium product available for immediate download and is 100 percent editable in Powerpoint. Download this now and use it in your presentations to impress your audience.

Retail Retention Metrics Ppt PowerPoint Presentation Show Graphics Cpb Pdf
Presenting this set of slides with name retail retention metrics ppt powerpoint presentation show graphics cpb pdf. This is an editable Powerpoint four stages graphic that deals with topics like retail retention metrics to help convey your message better graphically. This product is a premium product available for immediate download and is 100 percent editable in Powerpoint. Download this now and use it in your presentations to impress your audience.

Marketing Metrics Analysis Ppt PowerPoint Presentation Inspiration Files Cpb Pdf
Presenting this set of slides with name marketing metrics analysis ppt powerpoint presentation inspiration files cpb pdf. This is an editable Powerpoint four stages graphic that deals with topics like marketing metrics analysis to help convey your message better graphically. This product is a premium product available for immediate download and is 100 percent editable in Powerpoint. Download this now and use it in your presentations to impress your audience.
Primary And Secondary Shipping Tracking Metrics Profile Rules PDF
This slide covers the KPI profile for defining measures to evaluate KPI performance. It also includes the details for enlisted KPIs such as ID, name, value, unit and rating. Showcasing this set of slides titled Primary And Secondary Shipping Tracking Metrics Profile Rules PDF. The topics addressed in these templates are Secondary, Primary, Metrics Profile. All the content presented in this PPT design is completely editable. Download it and make adjustments in color, background, font etc. as per your unique business setting.

Step 8 Event Management Performance Evaluation Metrics Inspiration PDF
This slide showcases the key metrics that are tracked to measure event success. The indicators covered are registration trends, post survey responses, cost per attendee, NPS and conversion rate. There are so many reasons you need a Step 8 Event Management Performance Evaluation Metrics Inspiration PDF. The first reason is you can not spend time making everything from scratch, Thus, Slidegeeks has made presentation templates for you too. You can easily download these templates from our website easily.
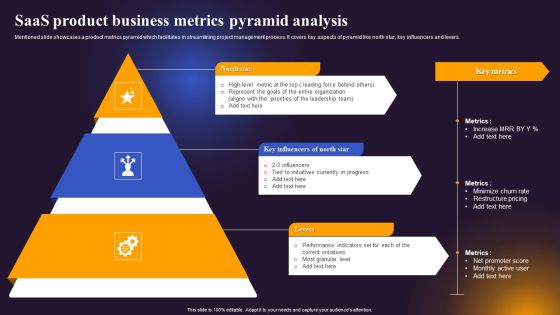
Saas Product Business Metrics Pyramid Analysis Portrait PDF
Mentioned slide showcases a product metrics pyramid which facilitates in streamlining project management process. It covers key aspects of pyramid like north star, key influencers and levers. Presenting Saas Product Business Metrics Pyramid Analysis Portrait PDF to dispense important information. This template comprises three stages. It also presents valuable insights into the topics including North Star, Key Influencers North Star, Levers. This is a completely customizable PowerPoint theme that can be put to use immediately. So, download it and address the topic impactfully.

Engineering Performance Team Operations And Metrics Assessment Demonstration PDF
This slide covers operations engineering KPIs to analyse performance of engineering team and improve results. It involves data such as schedule, surveys, efficiency utilization and hours scheduled. Showcasing this set of slides titled Engineering Performance Team Operations And Metrics Assessment Demonstration PDF. The topics addressed in these templates are Engineering Performance Team Operations, Metrics Assessment. All the content presented in this PPT design is completely editable. Download it and make adjustments in color, background, font etc. as per your unique business setting.

Vendor Performance Assessment Matrix With Scoring Metrics Style PDF
This slide shows scoring metrics with vendor performance assessment matrix. It provides information about segments, process integration, convenience, support, performance, pricing, etc. Pitch your topic with ease and precision using this Vendor Performance Assessment Matrix With Scoring Metrics Style PDF. This layout presents information on Process Integration, Convenience, Performance. It is also available for immediate download and adjustment. So, changes can be made in the color, design, graphics or any other component to create a unique layout.
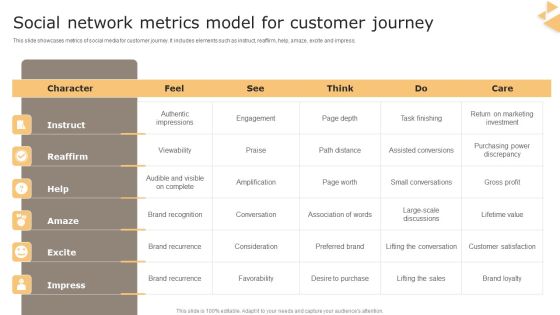
Social Network Metrics Model For Customer Journey Guidelines PDF
This slide showcases metrics of social media for customer journey. It includes elements such as instruct, reaffirm, help, amaze, excite and impress. Pitch your topic with ease and precision using this Social Network Metrics Model For Customer Journey Guidelines PDF. This layout presents information on Brand Recurrence, Marketing Investment, Customer Satisfaction. It is also available for immediate download and adjustment. So, changes can be made in the color, design, graphics or any other component to create a unique layout.
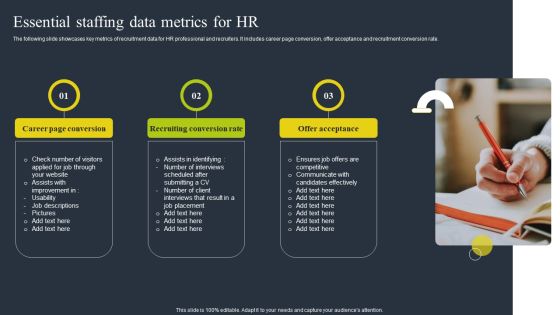
Essential Staffing Data Metrics For HR Inspiration PDF
The following slide showcases key metrics of recruitment data for HR professional and recruiters. It includes career page conversion, offer acceptance and recruitment conversion rate. Presenting Essential Staffing Data Metrics For HR Inspiration PDF to dispense important information. This template comprises three stages. It also presents valuable insights into the topics including Recruiting Conversion Rate, Offer Acceptance, Career Page Conversion. This is a completely customizable PowerPoint theme that can be put to use immediately. So, download it and address the topic impactfully.
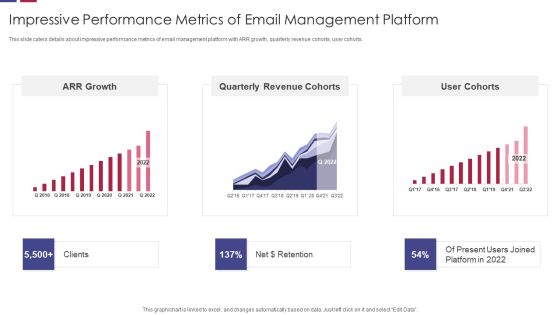
Impressive Performance Metrics Of Email Management Platform Inspiration PDF
This slide caters details about impressive performance metrics of email management platform with ARR growth, quarterly revenue cohorts, user cohorts. Pitch your topic with ease and precision using this Impressive Performance Metrics Of Email Management Platform Inspiration PDF. This layout presents information on Growth, Quarterly Revenue. It is also available for immediate download and adjustment. So, changes can be made in the color, design, graphics or any other component to create a unique layout.

Water Management KPI Metrics Showing Domestic Water Consumption Information PDF
Presenting water management KPI metrics showing domestic water consumption information pdf. to provide visual cues and insights. Share and navigate important information on three stages that need your due attention. This template can be used to pitch topics like water management kpi metrics showing domestic water consumption. In addtion, this PPT design contains high resolution images, graphics, etc, that are easily editable and available for immediate download.

Dashboard Depicting E-Commerce Business Financial Operations Metrics Topics PDF
This slide represents dashboard showcasing e-commerce financial process metrics illustrating eccentric purchase conversation rate, shipping revenue, average quantity etc.Showcasing this set of slides titled dashboard depicting e-commerce business financial operations metrics topics pdf The topics addressed in these templates are eccentric purchase, average product revenue, impression rate All the content presented in this PPT design is completely editable. Download it and make adjustments in color, background, font etc. as per your unique business setting.

Social Media Campaign Advertisement With Objectives And Metrics Structure PDF
The following slide highlights the social media promotional campaign which includes the campaign name, types, promotional tools and metrics. Showcasing this set of slides titled Social Media Campaign Advertisement With Objectives And Metrics Structure PDF. The topics addressed in these templates are Campaign Objective, Brand Development, Brand Awareness. All the content presented in this PPT design is completely editable. Download it and make adjustments in color, background, font etc. as per your unique business setting.

Comparative Metrics For Continuous Tracking In Devops Tools Clipart PDF
This slide illustrates comparison of key performance indicators of DevOps tools. It includes metrics such as observability and visualization, observability and application, pattern analysis, etc. Showcasing this set of slides titled Comparative Metrics For Continuous Tracking In Devops Tools Clipart PDF. The topics addressed in these templates are Appdynamics, Datadog, Dynatrace. All the content presented in this PPT design is completely editable. Download it and make adjustments in color, background, font etc. as per your unique business setting.
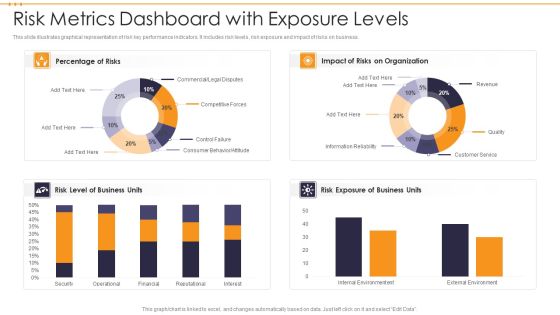
Risk Metrics Dashboard With Exposure Levels Template PDF
This slide illustrates graphical representation of risk key performance indicators. It includes risk levels, risk exposure and impact of risks on business. Pitch your topic with ease and precision using this Risk Metrics Dashboard With Exposure Levels Template PDF. This layout presents information on Risk Metrics Dashboard With Exposure Levels. It is also available for immediate download and adjustment. So, changes can be made in the color, design, graphics or any other component to create a unique layout.
Education Dashboard For Tracking Gender Based Retention Metrics Template PDF
This slide illustrates student retention analysis dashboard. It include metrics based on gender, campus, ethnicity, and age group. Pitch your topic with ease and precision using this Education Dashboard For Tracking Gender Based Retention Metrics Template PDF. This layout presents information on Gender Based, Retention Rates, Age Group, Campus Wise. It is also available for immediate download and adjustment. So, changes can be made in the color, design, graphics or any other component to create a unique layout.

Product Target Channel With Metrics And Key Initiatives Template PDF
Persuade your audience using this product target channel with metrics and key initiatives template pdf. This PPT design covers three stages, thus making it a great tool to use. It also caters to a variety of topics including product goals, metrics, key initiatives. Download this PPT design now to present a convincing pitch that not only emphasizes the topic but also showcases your presentation skills.

KPI Metrics Dashboard Icon For Freelance Content Marketing Ideas PDF
Persuade your audience using this KPI Metrics Dashboard Icon For Freelance Content Marketing Ideas PDF. This PPT design covers four stages, thus making it a great tool to use. It also caters to a variety of topics including Kpi Metrics, Freelance Content Marketing. Download this PPT design now to present a convincing pitch that not only emphasizes the topic but also showcases your presentation skills.

Enterprise Website Performance Record With Major Metrics Guidelines PDF
Persuade your audience using this Enterprise Website Performance Record With Major Metrics Guidelines PDF. This PPT design covers three stages, thus making it a great tool to use. It also caters to a variety of topics including Enterprise Website Performance Record, Major Metrics. Download this PPT design now to present a convincing pitch that not only emphasizes the topic but also showcases your presentation skills.

Logistics KPI Metrics And Analytics Dashboard Ppt Slides Images PDF
Persuade your audience using this Logistics KPI Metrics And Analytics Dashboard Ppt Slides Images PDF. This PPT design covers four stages, thus making it a great tool to use. It also caters to a variety of topics including Logistics KPI, Metrics And Analytics, Dashboard. Download this PPT design now to present a convincing pitch that not only emphasizes the topic but also showcases your presentation skills.

Human Resources Related Risk Metrics Dashboard Information PDF
This slide illustrates graphical representation of people key risk indicators. It includes indicators namely staff turnover, employee satisfaction, employee absenteeism etc. Pitch your topic with ease and precision using this Human Resources Related Risk Metrics Dashboard Information PDF. This layout presents information on Human Resources Related Risk Metrics Dashboard. It is also available for immediate download and adjustment. So, changes can be made in the color, design, graphics or any other component to create a unique layout.

Third Party Vendors Risk Metrics Performance Indicators Dashboard Topics PDF
This slide illustrates graphical representation of risk key performance indicators. It includes third party vendors trust score, impact score and risk score. Pitch your topic with ease and precision using this Third Party Vendors Risk Metrics Performance Indicators Dashboard Topics PDF. This layout presents information on Third Party Vendors Risk Metrics Performance Indicators Dashboard. It is also available for immediate download and adjustment. So, changes can be made in the color, design, graphics or any other component to create a unique layout.

Education Dashboard With Absenteeism And Grade Details Metrics Diagrams PDF
This slide covers dashboard for tracking causes and rates of student absenteeism. It also include metrics such as average grades by subject and department. Pitch your topic with ease and precision using this Education Dashboard With Absenteeism And Grade Details Metrics Diagrams PDF. This layout presents information on Grade Department, English Proficiency, Medical Abs. It is also available for immediate download and adjustment. So, changes can be made in the color, design, graphics or any other component to create a unique layout.
Training And Education Metrics Tracking Dashboard Guidelines PDF
This slide showcases dashboard for tracking training programs details. It include metrics such as training to invited percentage, unique trained, training man-days, total program names, etc. Pitch your topic with ease and precision using this Training And Education Metrics Tracking Dashboard Guidelines PDF. This layout presents information on Location Wise Training, Training Concerning Vertical, Tennessee. It is also available for immediate download and adjustment. So, changes can be made in the color, design, graphics or any other component to create a unique layout.

Asset Assessment Dashboard With ROI Metrics Topics PDF
This slide illustrates asset valuation dashboard with return on investment metrics. It provides information about internal rate of return, investment type, deal size, asset type, Pitch your topic with ease and precision using this Asset Assessment Dashboard With ROI Metrics Topics PDF. This layout presents information on Investment Amount, Asset Valuation, Internal Return. It is also available for immediate download and adjustment. So, changes can be made in the color, design, graphics or any other component to create a unique layout.
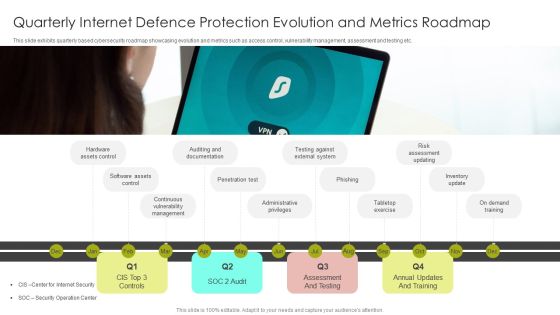
Quarterly Internet Defence Protection Evolution And Metrics Roadmap Sample PDF
This slide exhibits quarterly based cybersecurity roadmap showcasing evolution and metrics such as access control, vulnerability management, assessment and testing etc.Presenting Quarterly Internet Defence Protection Evolution And Metrics Roadmap Sample PDF to dispense important information. This template comprises one stage. It also presents valuable insights into the topics including Auditing Documentation, Penetration Test, Administrative Privileges. This is a completely customizable PowerPoint theme that can be put to use immediately. So, download it and address the topic impactfully.

Campaign Metrics With Lead Generated Through Regions Clipart PDF
This template covers about lead generated through regions on daily and monthly basis . Further, it includes top social media channels and lead breakdown. Showcasing this set of slides titled Campaign Metrics With Lead Generated Through Regions Clipart PDF. The topics addressed in these templates are Key Conversion Metrics, Quality, Social Media. All the content presented in this PPT design is completely editable. Download it and make adjustments in color, background, font etc. as per your unique business setting.

Key Metrics In Quality Analytics Procedure Framework Slides PDF
This slide showcases a framework for quality analytics. It highlights the key metrics which includes descriptive, diagnostic, predictive and perspective. Persuade your audience using this Key Metrics In Quality Analytics Procedure Framework Slides PDF. This PPT design covers four stages, thus making it a great tool to use. It also caters to a variety of topics including Descriptive, Predictive, Diagnostic. Download this PPT design now to present a convincing pitch that not only emphasizes the topic but also showcases your presentation skills.
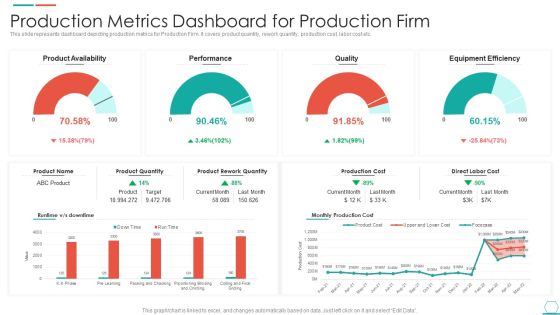
Production Metrics Dashboard For Production Firm Rules PDF
This slide represents dashboard depicting production metrics for Production Firm. It covers product quantity, rework quantity, production cost, labor cost etc. Showcasing this set of slides titled Production Metrics Dashboard For Production Firm Rules PDF. The topics addressed in these templates are Equipment Efficiency, Product Availability, Production Cost. All the content presented in this PPT design is completely editable. Download it and make adjustments in color, background, font etc. as per your unique business setting.

Finance Metrics Dashboard Illustrating Monthly Gross Profit Formats PDF
This graph or chart is linked to excel, and changes automatically based on data. Just left click on it and select edit data. Showcasing this set of slides titled Finance Metrics Dashboard Illustrating Monthly Gross Profit Formats PDF. The topics addressed in these templates are Profit Metrics Gross, Profit Target Cum, Actual Cum Target. All the content presented in this PPT design is completely editable. Download it and make adjustments in color, background, font etc. as per your unique business setting.

Dashboard For Monthly Recruitment Metrics And Analytics Themes PDF
The slide depicts the dashboard for monthly recruitment metrics and analytics depicting monthly recruitment, recruitment by department and source, candidate feedback and offer acceptance rate.Showcasing this set of slides titled Dashboard For Monthly Recruitment Metrics And Analytics Themes PDF The topics addressed in these templates are Recruitment Department, Recruitment Source, Interview Activity All the content presented in this PPT design is completely editable. Download it and make adjustments in color, background, font etc. as per your unique business setting.

Education Dashboard With Application Acceptance Metrics Clipart PDF
This slide covers dashboard for tracking registration applications. It include metrics such as admission per intake and program, applications received, under review applications, acceptance rate, students enrolled. Showcasing this set of slides titled Education Dashboard With Application Acceptance Metrics Clipart PDF. The topics addressed in these templates are Admissions Per, Intake And Program, Enrollment. All the content presented in this PPT design is completely editable. Download it and make adjustments in color, background, font etc. as per your unique business setting.

Cyber Security KPI Dashboard With Metrics Microsoft PDF
This slide showcases dashboard of security support cell based on complaints recorded from ABC company. It includes complaints, non complaints, open and close tickets and security incident by quarter. Showcasing this set of slides titled Cyber Security KPI Dashboard With Metrics Microsoft PDF. The topics addressed in these templates are Cyber Security, Kpi Dashboard With Metrics. All the content presented in this PPT design is completely editable. Download it and make adjustments in color, background, font etc. as per your unique business setting.
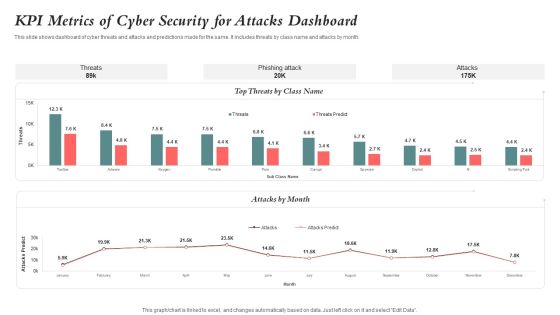
KPI Metrics Of Cyber Security For Attacks Dashboard Guidelines PDF
This slide shows dashboard of cyber threats and attacks and predictions made for the same. It includes threats by class name and attacks by month. Showcasing this set of slides titled KPI Metrics Of Cyber Security For Attacks Dashboard Guidelines PDF. The topics addressed in these templates are Kpi Metrics, Cyber Security, Attacks Dashboard. All the content presented in this PPT design is completely editable. Download it and make adjustments in color, background, font etc. as per your unique business setting.
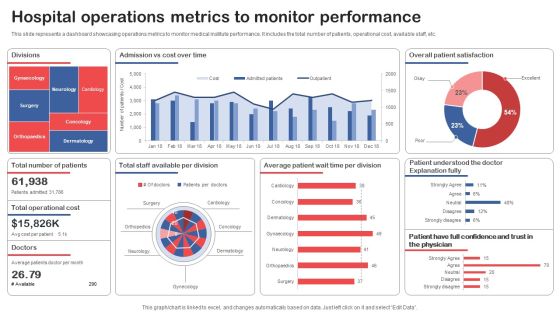
Hospital Operations Metrics To Monitor Performance Structure PDF
This slide represents a dashboard showcasing operations metrics to monitor medical institute performance. It includes the total number of patients, operational cost, available staff, etc. Showcasing this set of slides titled Hospital Operations Metrics To Monitor Performance Structure PDF. The topics addressed in these templates are Divisions, Overall Patient Satisfaction, Total Operational Cost. All the content presented in this PPT design is completely editable. Download it and make adjustments in color, background, font etc. as per your unique business setting.

Different Metrics To Determine CRM Program Success Professional PDF
This slide covers information regarding various metric that are required to determine CRM program success by analyzing leads, active members, churning members, etc. This Different Metrics To Determine CRM Program Success Professional PDF from Slidegeeks makes it easy to present information on your topic with precision. It provides customization options, so you can make changes to the colors, design, graphics, or any other component to create a unique layout. It is also available for immediate download, so you can begin using it right away. Slidegeeks has done good research to ensure that you have everything you need to make your presentation stand out. Make a name out there for a brilliant performance.

Major Metrics To Manage Cash Flow Ppt Infographics Portfolio PDF
This slide showcases main performance metric for cashflow management and improvement. The KPIs covered are account receivable turnover, sustainable growth rate, cash conversion cycle and quick ratio. Presenting Major Metrics To Manage Cash Flow Ppt Infographics Portfolio PDF to dispense important information. This template comprises four stages. It also presents valuable insights into the topics including Account Receivable Turnover, Sustainable Growth Rate, Cash Conversion Cycle. This is a completely customizable PowerPoint theme that can be put to use immediately. So, download it and address the topic impactfully.

Measure Campaign Results With Key Metrics Ppt Pictures Examples PDF
The following slide depicts the key metrics to evaluate campaign performance to track planned and actual results. It also includes elements such as click through and bounce rate, cost per click, quality score, paid and organic social media etc. Explore a selection of the finest Measure Campaign Results With Key Metrics Ppt Pictures Examples PDF here. With a plethora of professionally designed and pre made slide templates, you can quickly and easily find the right one for your upcoming presentation. You can use our Measure Campaign Results With Key Metrics Ppt Pictures Examples PDF to effectively convey your message to a wider audience. Slidegeeks has done a lot of research before preparing these presentation templates. The content can be personalized and the slides are highly editable. Grab templates today from Slidegeeks.

Comparison Metrics For Business Partner Lifecycle Management Guidelines PDF
The following slide highlights the comparison metrics for partner lifecycle management illustrating key headings which includes comparison area, comparison metric, high score, low score and partner. Where comparison are depicts business size, management, growth strategy, integration and finance. Pitch your topic with ease and precision using this Comparison Metrics For Business Partner Lifecycle Management Guidelines PDF. This layout presents information on Business Size, Management, Growth Strategy. It is also available for immediate download and adjustment. So, changes can be made in the color, design, graphics or any other component to create a unique layout.
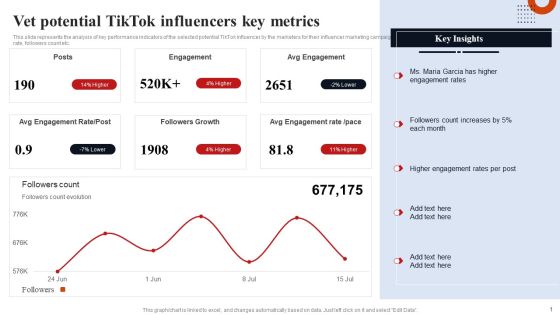
Vet Potential Tiktok Influencers Key Metrics Template PDF
This slide represents the analysis of key performance indicators of the selected potential TikTok influencer by the marketers for their influencer marketing campaign. It includes details related to key metrics such as engagement rate, followers count etc. Explore a selection of the finest Vet Potential Tiktok Influencers Key Metrics Template PDF here. With a plethora of professionally designed and pre made slide templates, you can quickly and easily find the right one for your upcoming presentation. You can use our Vet Potential Tiktok Influencers Key Metrics Template PDF to effectively convey your message to a wider audience. Slidegeeks has done a lot of research before preparing these presentation templates. The content can be personalized and the slides are highly editable. Grab templates today from Slidegeeks.

Workforce Performance Metrics Scorecard To Measure Training Effectiveness Information PDF
Mentioned slide outlines HR KPI scorecard showcasing most important kpis. Organization can measure the success rate of HR strategy by tracking metrics such as training effectiveness, absence rate and cost, benefits satisfaction, productivity rate, net promotor score, etc.Pitch your topic with ease and precision using this Workforce Performance Metrics Scorecard To Measure Training Effectiveness Information PDF. This layout presents information on Absence Rate, Internal Promotion, Engagement Index. It is also available for immediate download and adjustment. So, changes can be made in the color, design, graphics or any other component to create a unique layout.

Comparing Inventory Management Metrics With Competitors Introduction PDF
If you are looking for a format to display your unique thoughts, then the professionally designed Comparing Inventory Management Metrics With Competitors Introduction PDF is the one for you. You can use it as a Google Slides template or a PowerPoint template. Incorporate impressive visuals, symbols, images, and other charts. Modify or reorganize the text boxes as you desire. Experiment with shade schemes and font pairings. Alter, share or cooperate with other people on your work. Download Comparing Inventory Management Metrics With Competitors Introduction PDF and find out how to give a successful presentation. Present a perfect display to your team and make your presentation unforgettable.
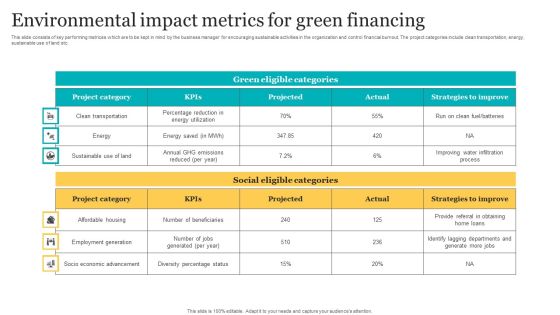
Environmental Impact Metrics For Green Financing Rules PDF
This slide consists of key performing metrices which are to be kept in mind by the business manager for encouraging sustainable activities in the organization and control financial burnout. The project categories include clean transportation, energy, sustainable use of land etc. Pitch your topic with ease and precision using this Environmental Impact Metrics For Green Financing Rules PDF. This layout presents information on Financing, Environmental, Metrics. It is also available for immediate download and adjustment. So, changes can be made in the color, design, graphics or any other component to create a unique layout.

Dashboard For Education Institutes With Student Retention Metrics Slides PDF
This slide covers dashboard for tracking student and faculty members details. It include metrics such as faculty to student ratio, student attendance rate, faculty retention rate, student enrollment details, examination results overview, etc. Showcasing this set of slides titled Dashboard For Education Institutes With Student Retention Metrics Slides PDF. The topics addressed in these templates are Student Enrollment Details, Examination Results Overview, Faculty Student Ratio. All the content presented in this PPT design is completely editable. Download it and make adjustments in color, background, font etc. as per your unique business setting.

Two Year Comparison Of Customer Service Metrics Information PDF
This slide showcases yearly comparison of customer service metrics that can help to identify percentage change as compared to previous year and evaluate reason behind decrease and increase. Its key KPIs are customer satisfaction score, avg call response time, customer effort score and average handle time. Pitch your topic with ease and precision using this Two Year Comparison Of Customer Service Metrics Information PDF. This layout presents information on Customer Effort Score, Customer Satisfaction Score, Average Handle Time. It is also available for immediate download and adjustment. So, changes can be made in the color, design, graphics or any other component to create a unique layout.
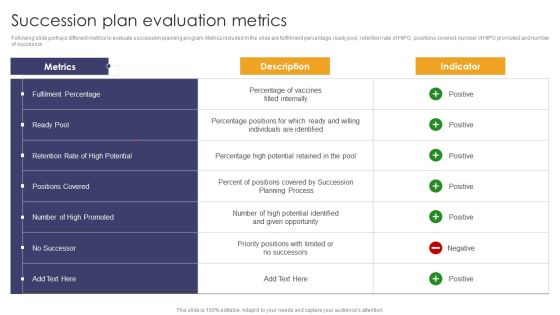
Implementing Succession Planning Succession Plan Evaluation Metrics Topics PDF
Following slide portrays different metrics to evaluate succession planning program. Metrics included in the slide are fulfillment percentage, ready pool, retention rate of HIPO, positions covered, number of HIPO promoted and number of successor. Welcome to our selection of the Implementing Succession Planning Succession Plan Evaluation Metrics Topics PDF. These are designed to help you showcase your creativity and bring your sphere to life. Planning and Innovation are essential for any business that is just starting out. This collection contains the designs that you need for your everyday presentations. All of our PowerPoints are 100 percent editable, so you can customize them to suit your needs. This multi-purpose template can be used in various situations. Grab these presentation templates today.
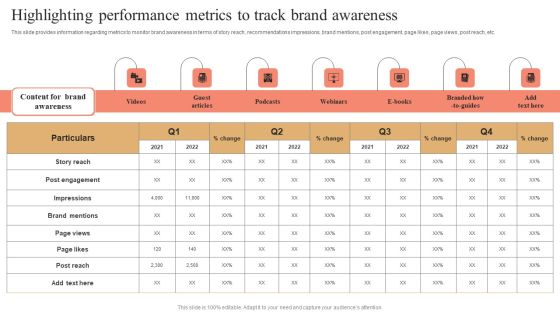
Highlighting Performance Metrics To Track Brand Awareness Designs PDF
This slide provides information regarding metrics to monitor brand awareness in terms of story reach, recommendations impressions, brand mentions, post engagement, page likes, page views, post reach, etc. The best PPT templates are a great way to save time, energy, and resources. Slidegeeks have 100 percent editable powerpoint slides making them incredibly versatile. With these quality presentation templates, you can create a captivating and memorable presentation by combining visually appealing slides and effectively communicating your message. Download Highlighting Performance Metrics To Track Brand Awareness Designs PDF from Slidegeeks and deliver a wonderful presentation.
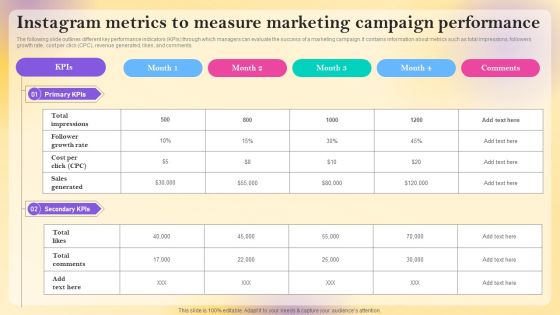
Instagram Metrics To Measure Marketing Campaign Performance Formats PDF
The following slide outlines different key performance indicators KPIs through which managers can evaluate the success of a marketing campaign. It contains information about metrics such as total impressions, followers growth rate, cost per click CPC, revenue generated, likes, and comments. Explore a selection of the finest Instagram Metrics To Measure Marketing Campaign Performance Formats PDF here. With a plethora of professionally designed and pre made slide templates, you can quickly and easily find the right one for your upcoming presentation. You can use our Instagram Metrics To Measure Marketing Campaign Performance Formats PDF to effectively convey your message to a wider audience. Slidegeeks has done a lot of research before preparing these presentation templates. The content can be personalized and the slides are highly editable. Grab templates today from Slidegeeks.

Business Referral Marketing Program Performance Metrics Dashboard Introduction PDF
This slide shows KPI dashboard to effectively track performance of business referral program in order to attract more leads and potential customers to the busines. It includes details related to key metrics such as referral participation rate, referred customers, referral conversion rate and total revenue generated. Showcasing this set of slides titled Business Referral Marketing Program Performance Metrics Dashboard Introduction PDF. The topics addressed in these templates are Referral Participation Rate, Referred Customers, Referral Conversion Rate, Total Revenue Generated. All the content presented in this PPT design is completely editable. Download it and make adjustments in color, background, font etc. as per your unique business setting.
Post Event Activities Tracking Post Event Metrics Status Elements PDF
This slide provides an overview of the status of key metrics. The KPIs covered are the number of attendees, revenue and social media engagement. Whether you have daily or monthly meetings, a brilliant presentation is necessary. Post Event Activities Tracking Post Event Metrics Status Elements PDF can be your best option for delivering a presentation. Represent everything in detail using Post Event Activities Tracking Post Event Metrics Status Elements PDF and make yourself stand out in meetings. The template is versatile and follows a structure that will cater to your requirements. All the templates prepared by Slidegeeks are easy to download and edit. Our research experts have taken care of the corporate themes as well. So, give it a try and see the results.

Internal Audit Key Performance Indicators Metrics Inspiration PDF
This slide depicts the internal audit key performance indicator KPI metrics. It includes information related to the measures and its achievement. Persuade your audience using this Internal Audit Key Performance Indicators Metrics Inspiration PDF. This PPT design covers two stages, thus making it a great tool to use. It also caters to a variety of topics including Measures, Achievement, Audit Findings Percentage. Download this PPT design now to present a convincing pitch that not only emphasizes the topic but also showcases your presentation skills.

Campaign Cost Metrics With Online Advertising Overview Pictures PDF
This template covers about conversions per click and online advertising overview on monthly basis. Further, it includes cost per impression details. Pitch your topic with ease and precision using this Campaign Cost Metrics With Online Advertising Overview Pictures PDF. This layout presents information on Cost Per Conversion, Cost Per Click, Conversion Rate. It is also available for immediate download and adjustment. So, changes can be made in the color, design, graphics or any other component to create a unique layout.

KPI Metrics Dashboard Highlighting Employee Retention Rate Structure PDF
The purpose of this slide is to exhibit a key performance indicator KPI dashboard through which managers can analyze the monthly employee retention rate. The metrics covered in the slide are active employees, new candidates hired, internal, exit, employee turnover rate, etc. Do you have to make sure that everyone on your team knows about any specific topic I yes, then you should give KPI Metrics Dashboard Highlighting Employee Retention Rate Structure PDF a try. Our experts have put a lot of knowledge and effort into creating this impeccable KPI Metrics Dashboard Highlighting Employee Retention Rate Structure PDF. You can use this template for your upcoming presentations, as the slides are perfect to represent even the tiniest detail. You can download these templates from the Slidegeeks website and these are easy to edit. So grab these today.

Social Network Promotion Campaign Metrics Ppt Portfolio Outline PDF
This slide outlines the measurement of specified goals to assess the impact of social media activities on marketing campaigns and to capture customer growth. The various measured goals are awareness, client engagement, conversion rate, and brand recognition. Showcasing this set of slides titled Social Network Promotion Campaign Metrics Ppt Portfolio Outline PDF. The topics addressed in these templates are Business Objective, Social Media Goal, Metrics. All the content presented in this PPT design is completely editable. Download it and make adjustments in color, background, font etc. as per your unique business setting.

Playbook To Formulate Efficient Web Performance Measurement Metrics Diagrams PDF
Mentioned slide shows the major key performance indicators used by organizations to measure their website performance. Metrics covered are related to organic traffic, inbound leads, bounce rate. Slidegeeks has constructed Playbook To Formulate Efficient Web Performance Measurement Metrics Diagrams PDF after conducting extensive research and examination. These presentation templates are constantly being generated and modified based on user preferences and critiques from editors. Here, you will find the most attractive templates for a range of purposes while taking into account ratings and remarks from users regarding the content. This is an excellent jumping-off point to explore our content and will give new users an insight into our top-notch PowerPoint Templates.

Determine Essential Pipeline Metrics Improving Distribution Channel Introduction PDF
This slide provides information regarding the essential pipeline metrics such as opportunity dollar size vs. average won deal size, opportunity age vs. win cycle and win rate. This is a Determine Essential Pipeline Metrics Improving Distribution Channel Introduction PDF template with various stages. Focus and dispense information on two stages using this creative set, that comes with editable features. It contains large content boxes to add your information on topics like Determine Duration, Winning Opportunity, Determine Duration. You can also showcase facts, figures, and other relevant content using this PPT layout. Grab it now.

Dashboard For Tracking Sales Target Metrics Introduction PDF
This slide presents KPI dashboard for tracking Sales Target Metrics achievement monthly and region wise helpful in adjusting activities as per ongoing performance. It includes average weekly sales revenue, average sales target, annual sales growth, regional sales performance and average revenue per unit that should be regularly tracked. Showcasing this set of slides titled Dashboard For Tracking Sales Target Metrics Introduction PDF. The topics addressed in these templates are Average Revenue, Per Unit, Average Weekly, Sales Revenue. All the content presented in this PPT design is completely editable. Download it and make adjustments in color, background, font etc. as per your unique business setting.

Business Analytics Application Employee Engagement Key Performance Metrics Icons PDF
This slide represents key metrics dashboard to analyze the engagement of employees in the organization. It includes details related to KPIs such as engagement score, response rate, net promoter score etc. Formulating a presentation can take up a lot of effort and time, so the content and message should always be the primary focus. The visuals of the PowerPoint can enhance the presenters message, so our Business Analytics Application Employee Engagement Key Performance Metrics Icons PDF was created to help save time. Instead of worrying about the design, the presenter can concentrate on the message while our designers work on creating the ideal templates for whatever situation is needed. Slidegeeks has experts for everything from amazing designs to valuable content, we have put everything into Business Analytics Application Employee Engagement Key Performance Metrics Icons PDF.

Metrics To Manage Company Cash Flow Ppt Model Gridlines PDF
This slide showcases key metrics used by organizations to manage cashflow. The key performance indicators included are days, receivable, inventory and payable outstanding. Pitch your topic with ease and precision using this Metrics To Manage Company Cash Flow Ppt Model Gridlines PDF. This layout presents information on Days Receivable Outstanding, Days Inventory Outstanding, Days Payable Outstanding. It is also available for immediate download and adjustment. So, changes can be made in the color, design, graphics or any other component to create a unique layout.

 Home
Home