Executive Summary Financial Analysis

Cost Of Employee Turnover Ppt PowerPoint Presentation Deck
This is a cost of employee turnover ppt powerpoint presentation deck. This is a five stage process. The stages in this process are cost of hiring a new employee, expense to onboard and train a new employee, lost productivity and engagement, customer service issues and errors, impact on workplace culture.

Portfolio Return And Performance Ppt PowerPoint Presentation Gallery
This is a portfolio return and performance ppt powerpoint presentation gallery. This is a five stage process. The stages in this process are process, finance, business, marketing, management.

Staff Acquisition Cost Cost Per Hire Ppt PowerPoint Presentation Styles Guidelines
This is a staff acquisition cost cost per hire ppt powerpoint presentation styles guidelines. This is a seven stage process. The stages in this process are cost per hire, bar graph, business, marketing, planning.

data collection scatter diagram ppt powerpoint presentation inspiration
This is a data collection scatter diagram ppt powerpoint presentation inspiration. This is a three stage process. The stages in this process are business, planning, marketing, scatter diagram, finance.
Workforce Diversity By Region Ppt PowerPoint Presentation Icon Graphics Pictures
This is a workforce diversity by region ppt powerpoint presentation icon graphics pictures. This is a four stage process. The stages in this process are by region, bar graph, business, presentation, marketing.
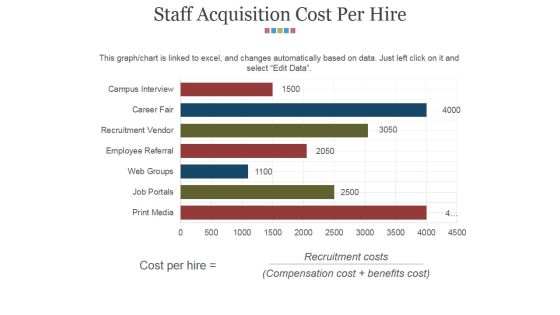
Staff Acquisition Cost Per Hire Ppt PowerPoint Presentation Show Microsoft
This is a staff acquisition cost per hire ppt powerpoint presentation show microsoft. This is a seven stage process. The stages in this process are recruitment costs, business, marketing, finance, success.
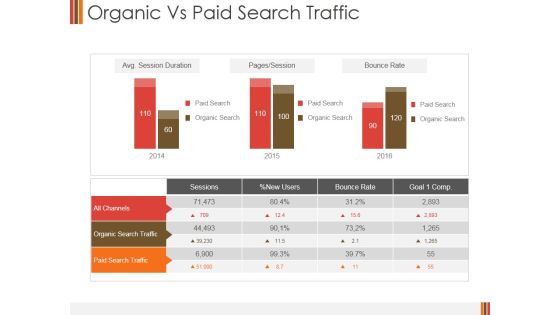
Organic Vs Paid Search Traffic Ppt PowerPoint Presentation Example 2015
This is a organic vs paid search traffic ppt powerpoint presentation example 2015. This is a two stage process. The stages in this process are avg session duration, pages session, bounce rate, paid search.
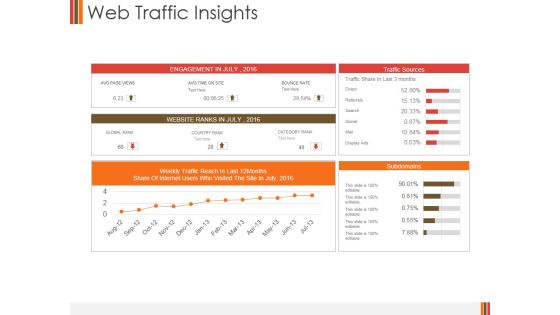
Web Traffic Insights Ppt PowerPoint Presentation Pictures Guide
This is a web traffic insights ppt powerpoint presentation pictures guide. This is a five stage process. The stages in this process are engagement in, website ranks, subdomains, traffic sources.
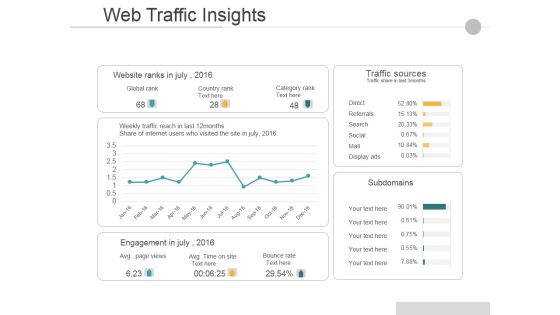
Web Traffic Insights Ppt PowerPoint Presentation Professional Show
This is a web traffic insights ppt powerpoint presentation professional show. This is a four stage process. The stages in this process are website ranks in july, traffic sources, subdomains, engagement in july.
Website Performance Review Ppt PowerPoint Presentation Icon Deck
This is a website performance review ppt powerpoint presentation icon deck. This is a three stage process. The stages in this process are conversion rate, average visit value goal, visits.
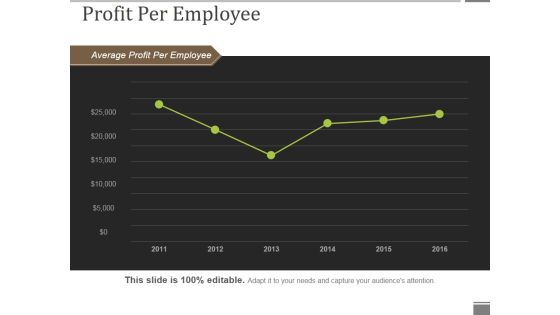
Profit Per Employee Ppt PowerPoint Presentation Show Portfolio
This is a profit per employee ppt powerpoint presentation show portfolio. This is a six stage process. The stages in this process are average profit per employee, line chart, business, marketing, success.
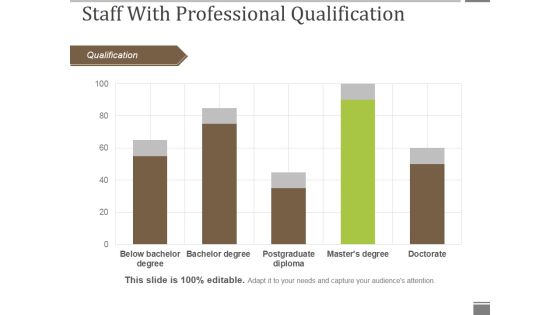
Staff With Professional Qualification Ppt PowerPoint Presentation Gallery Graphics Pictures
This is a staff with professional qualification ppt powerpoint presentation gallery graphics pictures. This is a five stage process. The stages in this process are qualification, bar graph, business, marketing, success.

Company Xx Has Wide Range Of Products Services Ppt PowerPoint Presentation Inspiration Topics
This is a company xx has wide range of products services ppt powerpoint presentation inspiration topics. This is a three stage process. The stages in this process are business, marketing, strategy, planning, finance.
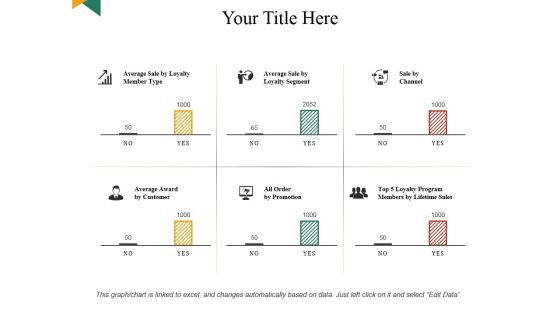
Your Title Here Ppt PowerPoint Presentation Professional File Formats
This is a your title here ppt powerpoint presentation professional file formats. This is a six stage process. The stages in this process are business, marketing, strategy, finance, planning.

Stacked Line With Markers Ppt PowerPoint Presentation Sample
This is a stacked line with markers ppt powerpoint presentation sample. This is a one stage process. The stages in this process are business, marketing, growth, management, line chart.

Workforce Diversity By Age Group Ppt PowerPoint Presentation Visual Aids Gallery
This is a workforce diversity by age group ppt powerpoint presentation visual aids gallery. This is a three stage process. The stages in this process are by age group, bar graph, business, marketing, presentation.

Core Vs Extended Customer Service Ppt PowerPoint Presentation Portfolio Graphics Download
This is a core vs extended customer service ppt powerpoint presentation portfolio graphics download. This is a four stage process. The stages in this process are customer, expectation, perceived value, customer, expectation, perceived value, unsatisfactory.
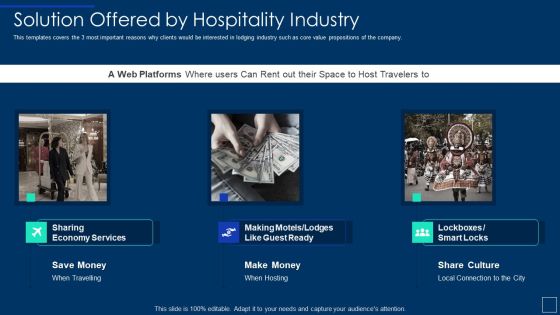
Solution Offered By Hospitality Industry Ppt Guidelines PDF
This templates covers the 3 most important reasons why clients would be interested in lodging industry such as core value propositions of the company. Presenting solution offered by hospitality industry ppt guidelines pdf to provide visual cues and insights. Share and navigate important information on three stages that need your due attention. This template can be used to pitch topics like solution offered by hospitality industry . In addtion, this PPT design contains high resolution images, graphics, etc, that are easily editable and available for immediate download.

Biotech Firm Investor Funding Determine Addressable Market Size Opportunity For Biotech Platform Graphics PDF
This slide caters details about addressable market size as revenue opportunity by introducing unconventional product in biotech market. Presenting biotech firm investor funding determine addressable market size opportunity for biotech platform graphics pdf to provide visual cues and insights. Share and navigate important information on three stages that need your due attention. This template can be used to pitch topics like average percentage, overall estimated, significant number, required to perform, cost reduction. In addtion, this PPT design contains high resolution images, graphics, etc, that are easily editable and available for immediate download.

Slides You Need For Your Pitch Deck Ppt PowerPoint Presentation Example
This is a slides you need for your pitch deck ppt powerpoint presentation example. This is a ten stage process. The stages in this process are go to market plan, competitive analysis, management team, financial projections , financial projections, problem opportunity, value proposition, underlying magic.
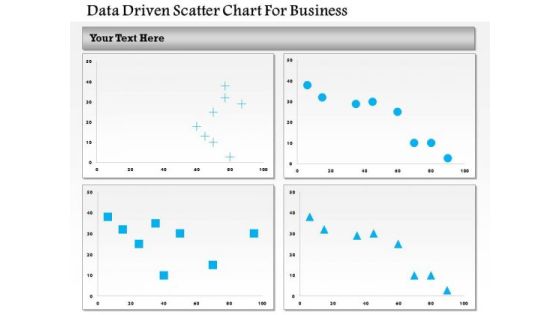
Business Diagram Data Driven Scatter Chart For Business PowerPoint Slide
This business diagram has been designed with four comparative charts. This slide suitable for data representation. You can also use this slide to present business analysis and reports. Use this diagram to present your views in a wonderful manner.

Decision Making Process In Managerial Economics PPT PowerPoint Presentation Complete Deck With Slides
This is a decision making process in managerial economics ppt powerpoint presentation complete deck with slides. This is a one stage process. The stages in this process are financial, financial analysis, economics, decision, process making.
Mode Of Finance Description Sample Ppt PowerPoint Presentation Example 2015
This is a mode of finance description sample ppt powerpoint presentation example 2015. This is a four stage process. The stages in this process are mode of finance, financial description, financial modes.
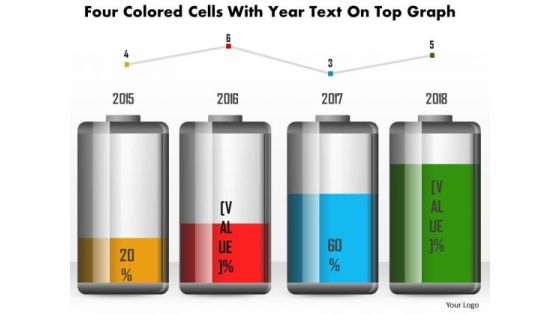
Business Diagram Four Colored Cells With Year Text On Top Graph PowerPoint Slide
This business diagram has been designed with battery cell graphic for business timeline. This slide can be used for business planning and management. Use this diagram for your business and success milestones related presentations.
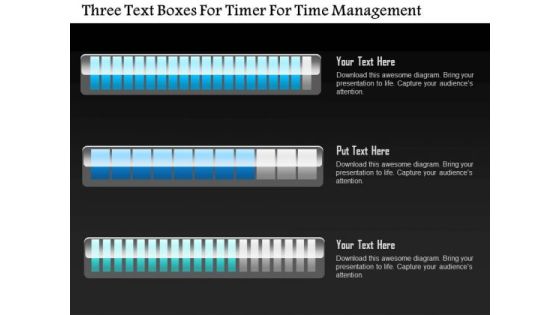
Business Diagram Three Text Boxes For Timer For Time Management PowerPoint Slide
This business diagram displays three text boxes. This diagram contains text boxes for data representation. Use this diagram to display business process workflows in any presentations.
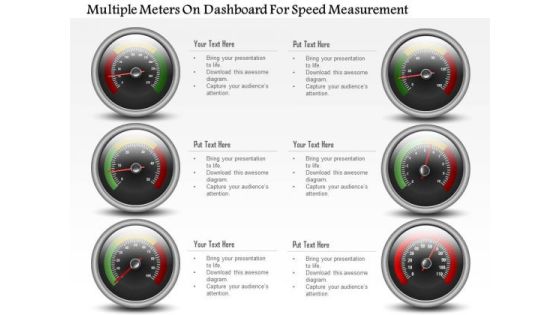
Business Diagram Multiple Meters On Dashboard For Speed Measurement PowerPoint Slide
This business diagram has been designed with multiple meters on dashboard. This slide can be used for business planning and progress. Use this diagram for your business and success milestones related presentations.

Business Diagram Five Staged Timeline Diagram For Business PowerPoint Slide
This PowerPoint template displays five points timeline diagram. This business diagram has been designed with graphic of timeline with five points, text space and start, end points. Use this diagram, in your presentations to display process steps, stages, timelines and business management. Make wonderful presentations using this business slide.
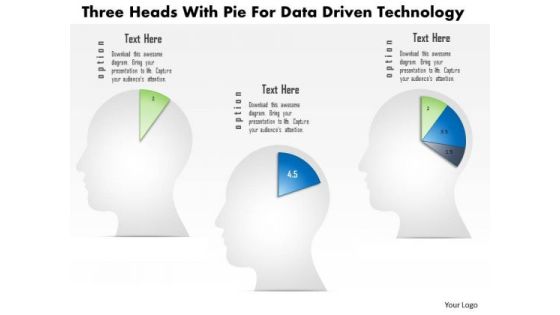
Business Diagram Three Heads With Pie For Data Driven Technology PowerPoint Slide
This business diagram displays three human faces with pie charts. This Power Point template has been designed to compare and present business data. You may use this diagram to impart professional appearance to your presentations.
Business Diagram 3d Bulb Graphic For Data Driven And Idea Generation PowerPoint Slide
This Power Point template has been designed with 3d bulb graphic. Use this slide to represent technology idea and strategy concepts. Download this diagram for your business presentations and get exclusive comments on your efforts.

Business Diagram Two Tablets With Growth Bar Graph Data Driven PowerPoint Slide
This business diagram has been designed with comparative charts on tablets. This slide suitable for data representation. You can also use this slide to present business reports and information. Use this diagram to present your views in a wonderful manner.

Business Diagram Flask With Data Driven Chart PowerPoint Slide
This data driven diagram has been designed with flask graphics. Download this diagram to give your presentations more effective look. It helps in clearly conveying your message to clients and audience.

Business Diagram Laptop With Data Driven Area Chart PowerPoint Slide
This diagram has been designed with laptop and data driven area chart. Download this diagram to give your presentations more effective look. It helps in clearly conveying your message to clients and audience.
Business Diagram 3d Capsule With Multiple Icons For Business Data Flow PowerPoint Slide
This diagram has been designed with 3d graphic of capsule with multiple icons. This data driven PowerPoint slide can be used to give your presentations more effective look. It helps in clearly conveying your message to clients and audience.
Business Diagram Flask And Test Tubes For Data Driven PowerPoint Slide
This data driven diagram has been designed with flask and test tubes. Download this diagram to give your presentations more effective look. It helps in clearly conveying your message to clients and audience.

Business Diagram Three Staged Pencil Diagram For Graph Formation PowerPoint Slide
This business diagram displays set of pencils. This Power Point template has been designed to compare and present business data. Download this diagram to represent stages of business growth.

Business Diagram Four Steps With 3d Business Person Standing Over It PowerPoint Slide
This business diagram displays bar graph with business person standing on it. This Power Point template has been designed to display personal growth. You may use this diagram to impart professional appearance to your presentations.
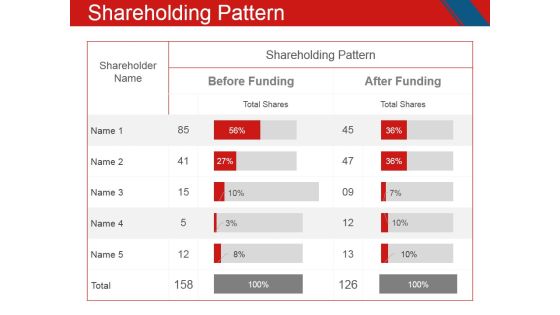
Shareholding Pattern Ppt PowerPoint Presentation Model Microsoft
This is a shareholding pattern ppt powerpoint presentation model microsoft. This is a two stage process. The stages in this process are shareholder name, shareholding pattern, before funding, after funding.

Comparison Ppt PowerPoint Presentation Portfolio Inspiration
This is a comparison ppt powerpoint presentation portfolio inspiration. This is a two stage process. The stages in this process are business, marketing, comparison, finance, management.
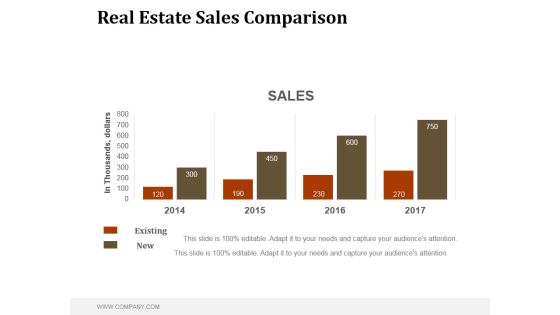
Real Estate Sales Comparison Ppt PowerPoint Presentation Good
This is a real estate sales comparison ppt powerpoint presentation good. This is a four stage process. The stages in this process are business, marketing, management, sales, comparison.
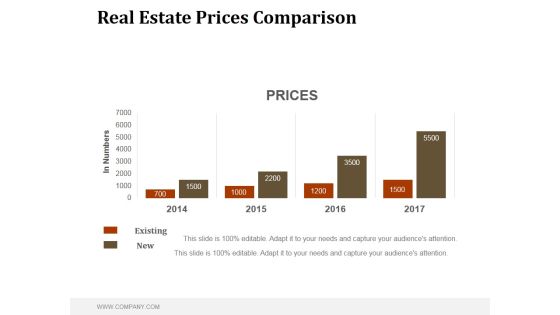
Real Estate Prices Comparison Ppt PowerPoint Presentation Example File
This is a real estate prices comparison ppt powerpoint presentation example file. This is a four stage process. The stages in this process are business, marketing, management, comparison, prices.
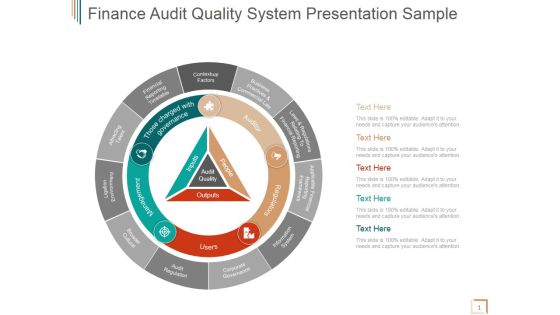
Finance Audit Quality System Ppt PowerPoint Presentation Slides
This is a finance audit quality system ppt powerpoint presentation slides. This is a six stage process. The stages in this process are contextual factors, financial reporting timetable, attracting talent, ligation environment, broader cultural, audit regulation.

How Much Money We Need Ppt PowerPoint Presentation Outline
This is a how much money we need ppt powerpoint presentation outline. This is a three stage process. The stages in this process are business, marketing, management, production, sales.

Data Analytics Ppt PowerPoint Presentation Graphics
This is a data analytics ppt powerpoint presentation graphics. This is a five stage process. The stages in this process are data analysis, business, marketing, success, graph.
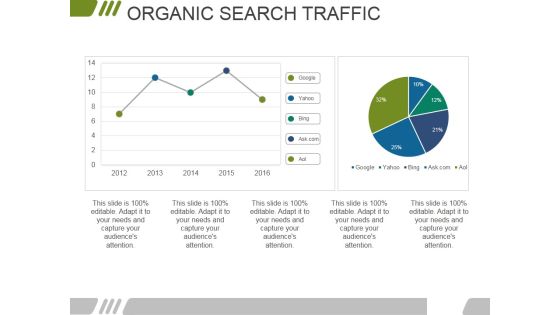
Organic Search Traffic Ppt PowerPoint Presentation Model Slideshow
This is a organic search traffic ppt powerpoint presentation model slideshow. This is a two stage process. The stages in this process are business, marketing, finance, management, organic.

Balance Sheet Kpis Template 1 Ppt PowerPoint Presentation Layouts Design Ideas
This is a balance sheet kpis template 1 ppt powerpoint presentation layouts design ideas. This is a four stage process. The stages in this process are current assets, current liabilities, total assets, total liabilities.

Production Costs Template 1 Ppt PowerPoint Presentation Layout
This is a production costs template 1 ppt powerpoint presentation layout. This is a two stage process. The stages in this process are cots, product, business, marketing, strategy.

Key Performance Indicators Template 2 Ppt PowerPoint Presentation Layouts Portfolio
This is a key performance indicators template 2 ppt powerpoint presentation layouts portfolio. This is a four stage process. The stages in this process are objective, measures, targets, invites.

Budgeting Planned Actual Comparison Ppt PowerPoint Presentation Infographic Template
This is a budgeting planned actual comparison ppt powerpoint presentation infographic template. This is a two stage process. The stages in this process are planned costs vs actual costs, deviation, actual costs, planned costs.
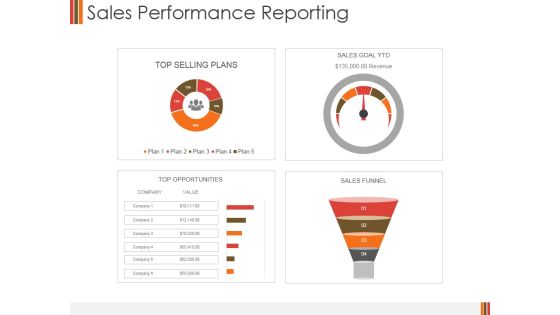
Sales Performance Reporting Ppt PowerPoint Presentation Slides Background Designs
This is a sales performance reporting ppt powerpoint presentation slides background designs. This is a four stage process. The stages in this process are top selling plans, sales goal ytd, top opportunities, sales funnel.

Project Progress And Reasons For Delay Ppt PowerPoint Presentation Layout
This is a project progress and reasons for delay ppt powerpoint presentation layout. This is a two stage process. The stages in this process are business, marketing, management, progress, finance.

Revenue Model Ppt PowerPoint Presentation Visual Aids
This is a revenue model ppt powerpoint presentation visual aids. This is a five stage process. The stages in this process are business, marketing, management, finance, planning.

Monthly Run Revenue Ppt PowerPoint Presentation Deck
This is a monthly run revenue ppt powerpoint presentation deck. This is a four stage process. The stages in this process are Business, Marketing, Management, Revenue, Finance.

Marketing Dashboard Ppt PowerPoint Presentation Templates
This is a marketing dashboard ppt powerpoint presentation templates. This is a two stage process. The stages in this process are business, marketing, management, finance, dashboard.

Revenue Dashboard Ppt PowerPoint Presentation Files
This is a revenue dashboard ppt powerpoint presentation files. This is a five stage process. The stages in this process are business, marketing, management, revenue, dashboard.
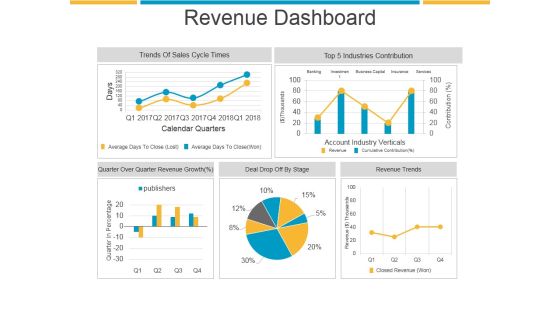
Revenue Dashboard Ppt PowerPoint Presentation Sample
This is a revenue dashboard ppt powerpoint presentation sample. This is a five stage process. The stages in this process are trends of sales cycle times, industries contribution, revenue trends, deal drop off by stage.
Website Performance Review Template 1 Ppt PowerPoint Presentation Slides Icons
This is a website performance review template 1 ppt powerpoint presentation slides icons. This is a three stage process. The stages in this process are online transaction, conversion rate, traffic source, site consumption time, organic branded.

Customer Trends Template 1 Ppt PowerPoint Presentation Diagrams
This is a customer trends template 1 ppt powerpoint presentation diagrams. This is a five stage process. The stages in this process are business, marketing, bar graph, finance, management.

Data Analytics Ppt PowerPoint Presentation Themes
This is a data analytics ppt powerpoint presentation themes. This is a five stage process. The stages in this process are business, marketing, presentation, data analyst, management.
Production Costs Ppt PowerPoint Presentation Icon
This is a production costs ppt powerpoint presentation icon. This is a two stage process. The stages in this process are business, marketing, management, production, finance.

Sales Performance Dashboard Ppt PowerPoint Presentation Show
This is a sales performance dashboard ppt powerpoint presentation show. This is a four stage process. The stages in this process are lead sources revenue share, total sales by month, opportunities total sales by probability, win loss ratio.
 Home
Home