Executive Summary Dashboard

Definitive Guide To Conduct Digital Marketing Inspection Content Performance Tracking Dashboard For Social Media Template PDF
This slide indicates the content performance tracking dashboard for social media channels providing information regarding the total number of posts, engagement rate, audience sentiments and multiple hashtags performance. This Definitive Guide To Conduct Digital Marketing Inspection Content Performance Tracking Dashboard For Social Media Template PDF from Slidegeeks makes it easy to present information on your topic with precision. It provides customization options, so you can make changes to the colors, design, graphics, or any other component to create a unique layout. It is also available for immediate download, so you can begin using it right away. Slidegeeks has done good research to ensure that you have everything you need to make your presentation stand out. Make a name out there for a brilliant performance.

Cognitive Analytics Strategy And Techniques Tracking Essential Virtual Agents Activities Dashboard Template PDF
This slide provides information regarding virtual agents essential activities dashboard in terms of daily number of new conversation, unique users weekly conversations by channel, etc. Do you know about Slidesgeeks Cognitive Analytics Strategy And Techniques Tracking Essential Virtual Agents Activities Dashboard Template PDF These are perfect for delivering any kind od presentation. Using it, create PowerPoint presentations that communicate your ideas and engage audiences. Save time and effort by using our pre designed presentation templates that are perfect for a wide range of topic. Our vast selection of designs covers a range of styles, from creative to business, and are all highly customizable and easy to edit. Download as a PowerPoint template or use them as Google Slides themes.

Analyzing The Economic Project Management Dashboard With Priority Projects Icons PDF
This slide showcases a project management dashboard with information related to project manager, project risks, project category, project priority, status of project portfolio, budget consumption by project priority etc. Are you in need of a template that can accommodate all of your creative concepts This one is crafted professionally and can be altered to fit any style. Use it with Google Slides or PowerPoint. Include striking photographs, symbols, depictions, and other visuals. Fill, move around, or remove text boxes as desired. Test out color palettes and font mixtures. Edit and save your work, or work with colleagues. Download Analyzing The Economic Project Management Dashboard With Priority Projects Icons PDF and observe how to make your presentation outstanding. Give an impeccable presentation to your group and make your presentation unforgettable.
SEO Tracking Dashboard For Backlinks And Keywords Ppt PowerPoint Presentation File Outline PDF
Purpose of the following slide is to measure the SEO performance of the organization as it measures the keywords, backlinks, the total number of sessions and average call duration. This SEO Tracking Dashboard For Backlinks And Keywords Ppt PowerPoint Presentation File Outline PDF from Slidegeeks makes it easy to present information on your topic with precision. It provides customization options, so you can make changes to the colors, design, graphics, or any other component to create a unique layout. It is also available for immediate download, so you can begin using it right away. Slidegeeks has done good research to ensure that you have everything you need to make your presentation stand out. Make a name out there for a brilliant performance.
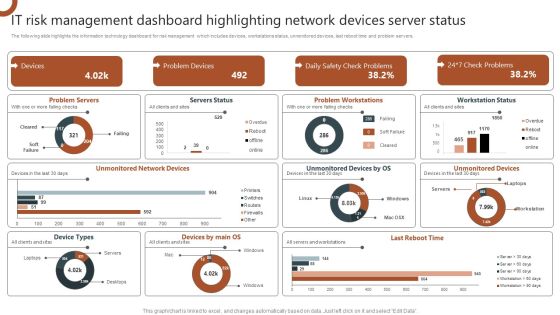
IT Risk Management Dashboard Highlighting Network Devices Server Status Pictures PDF
The following slide highlights the information technology dashboard for risk management which includes devices, workstations status, unmonitored devices, last reboot time and problem servers. Are you in need of a template that can accommodate all of your creative concepts This one is crafted professionally and can be altered to fit any style. Use it with Google Slides or PowerPoint. Include striking photographs, symbols, depictions, and other visuals. Fill, move around, or remove text boxes as desired. Test out color palettes and font mixtures. Edit and save your work, or work with colleagues. Download IT Risk Management Dashboard Highlighting Network Devices Server Status Pictures PDF and observe how to make your presentation outstanding. Give an impeccable presentation to your group and make your presentation unforgettable.
Playbook For Advancing Technology Managing It Services Spending Tracking Dashboard Clipart PDF
This slide provides information regarding the management of the digital services performance and IT spending tracking dashboard in terms of ROI, spend vs. budget, IT costs software, hardware, personnel and goals, IT spending in terms of revenues, etc. Are you in need of a template that can accommodate all of your creative concepts This one is crafted professionally and can be altered to fit any style. Use it with Google Slides or PowerPoint. Include striking photographs, symbols, depictions, and other visuals. Fill, move around, or remove text boxes as desired. Test out color palettes and font mixtures. Edit and save your work, or work with colleagues. Download Playbook For Advancing Technology Managing It Services Spending Tracking Dashboard Clipart PDF and observe how to make your presentation outstanding. Give an impeccable presentation to your group and make your presentation unforgettable.
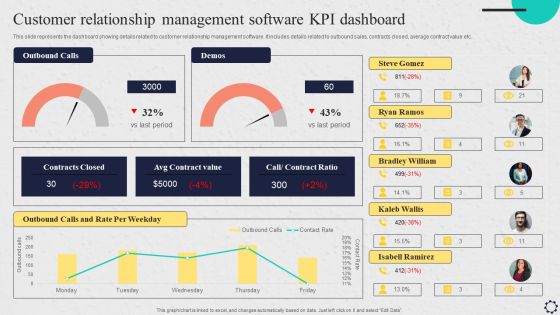
Software Implementation Strategy Customer Relationship Management Software Kpi Dashboard Clipart PDF
This slide represents the dashboard showing details related to customer relationship management software. It includes details related to outbound sales, contracts closed, average contract value etc. Are you in need of a template that can accommodate all of your creative concepts This one is crafted professionally and can be altered to fit any style. Use it with Google Slides or PowerPoint. Include striking photographs, symbols, depictions, and other visuals. Fill, move around, or remove text boxes as desired. Test out color palettes and font mixtures. Edit and save your work, or work with colleagues. Download Software Implementation Strategy Customer Relationship Management Software Kpi Dashboard Clipart PDF and observe how to make your presentation outstanding. Give an impeccable presentation to your group and make your presentation unforgettable.
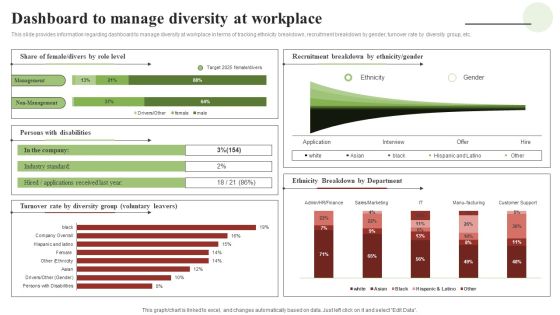
Transforming Human Resource Service Delivery Procedure Dashboard To Manage Diversity At Workplace Download PDF
This slide provides information regarding dashboard to manage diversity at workplace in terms of tracking ethnicity breakdown, recruitment breakdown by gender, turnover rate by diversity group, etc. Are you in need of a template that can accommodate all of your creative concepts This one is crafted professionally and can be altered to fit any style. Use it with Google Slides or PowerPoint. Include striking photographs, symbols, depictions, and other visuals. Fill, move around, or remove text boxes as desired. Test out color palettes and font mixtures. Edit and save your work, or work with colleagues. Download Transforming Human Resource Service Delivery Procedure Dashboard To Manage Diversity At Workplace Download PDF and observe how to make your presentation outstanding. Give an impeccable presentation to your group and make your presentation unforgettable.
Dashboard For Tracking Social Media Platforms Consumer Contact Point Guide Graphics PDF
This slide covers the KPI dashboard for analyzing social media channels. It includes metrics such as social media followers, Facebook daily reach, Facebook engaged users and page impressions, etc. Retrieve professionally designed Dashboard For Tracking Social Media Platforms Consumer Contact Point Guide Graphics PDF to effectively convey your message and captivate your listeners. Save time by selecting pre-made slideshows that are appropriate for various topics, from business to educational purposes. These themes come in many different styles, from creative to corporate, and all of them are easily adjustable and can be edited quickly. Access them as PowerPoint templates or as Google Slides themes. You do not have to go on a hunt for the perfect presentation because Slidegeeks got you covered from everywhere.
Comprehensive Personal Branding Guidelines Social Media Marketing Performance Tracking Dashboard Pictures PDF
Following slide displays KPI dashboard that can be used to monitor the performance of social media marketing campaign. Metrics covered are related to fans number, engagement rate and page impressions.Retrieve professionally designed Comprehensive Personal Branding Guidelines Social Media Marketing Performance Tracking Dashboard Pictures PDF to effectively convey your message and captivate your listeners. Save time by selecting pre-made slideshows that are appropriate for various topics, from business to educational purposes. These themes come in many different styles, from creative to corporate, and all of them are easily adjustable and can be edited quickly. Access them as PowerPoint templates or as Google Slides themes. You do not have to go on a hunt for the perfect presentation because Slidegeeks got you covered from everywhere.
How To Boost Brand Recognition Brand Awareness Activities Tracking Dashboard Ideas PDF
This slide provides information regarding brand activities tracking dashboard in terms of site traffic, attention, search, brand mentions, inbound traffic, etc. Retrieve professionally designed How To Boost Brand Recognition Brand Awareness Activities Tracking Dashboard Ideas PDF to effectively convey your message and captivate your listeners. Save time by selecting pre-made slideshows that are appropriate for various topics, from business to educational purposes. These themes come in many different styles, from creative to corporate, and all of them are easily adjustable and can be edited quickly. Access them as PowerPoint templates or as Google Slides themes. You dont have to go on a hunt for the perfect presentation because Slidegeeks got you covered from everywhere.

Workforce Diversity Dashboard Based On Gender And Ethnicity Distribution Inspiration PDF
This slide represents the diversity dashboard providing information regarding work force distribution on gender and ethnicity. It also includes details of year wise involuntary and voluntary turnover rates. Retrieve professionally designed Workforce Diversity Dashboard Based On Gender And Ethnicity Distribution Inspiration PDF to effectively convey your message and captivate your listeners. Save time by selecting pre made slideshows that are appropriate for various topics, from business to educational purposes. These themes come in many different styles, from creative to corporate, and all of them are easily adjustable and can be edited quickly. Access them as PowerPoint templates or as Google Slides themes. You do not have to go on a hunt for the perfect presentation because Slidegeeks got you covered from everywhere.

Workforce Diversity Dashboard Based On Gender And Ethnicity Distribution Sample PDF
This slide represents the diversity dashboard providing information regarding work force distribution on gender and ethnicity. It also includes details of year wise involuntary and voluntary turnover rates. Retrieve professionally designed Workforce Diversity Dashboard Based On Gender And Ethnicity Distribution Sample PDF to effectively convey your message and captivate your listeners. Save time by selecting pre made slideshows that are appropriate for various topics, from business to educational purposes. These themes come in many different styles, from creative to corporate, and all of them are easily adjustable and can be edited quickly. Access them as PowerPoint templates or as Google Slides themes. You do not have to go on a hunt for the perfect presentation because Slidegeeks got you covered from everywhere.

Deploying B2B Advertising Techniques For Lead Generation Kpi Dashboard To Assess Performance Marketing Demonstration PDF
This slide covers KPI dashboard to analyze performance of strategies for effective b2b lead generation. It involves details such as sales lead funnel, traffic sources and leads generated on monthly basis. Retrieve professionally designed Deploying B2B Advertising Techniques For Lead Generation Kpi Dashboard To Assess Performance Marketing Demonstration PDF to effectively convey your message and captivate your listeners. Save time by selecting pre made slideshows that are appropriate for various topics, from business to educational purposes. These themes come in many different styles, from creative to corporate, and all of them are easily adjustable and can be edited quickly. Access them as PowerPoint templates or as Google Slides themes. You do not have to go on a hunt for the perfect presentation because Slidegeeks got you covered from everywhere.
Dashboard To Track Results Of Performance Marketing Ad Campaigns Formats PDF
This slide showcases dashboard that can help marketers to track and evaluate the outcomes of performance marketing ad campaigns. Its key elements are impressions, clicks, conversions, click through rate, cost per conversion, revenue per click etc. Retrieve professionally designed Dashboard To Track Results Of Performance Marketing Ad Campaigns Formats PDF to effectively convey your message and captivate your listeners. Save time by selecting pre-made slideshows that are appropriate for various topics, from business to educational purposes. These themes come in many different styles, from creative to corporate, and all of them are easily adjustable and can be edited quickly. Access them as PowerPoint templates or as Google Slides themes. You do not have to go on a hunt for the perfect presentation because Slidegeeks got you covered from everywhere.
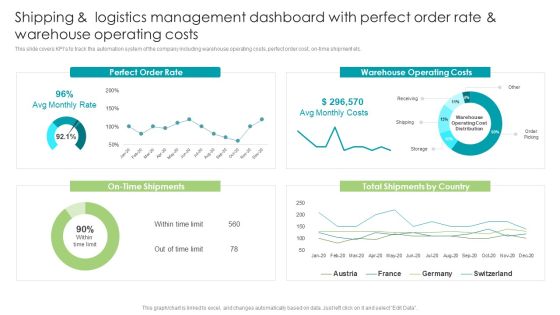
Robotic Process Automation Shipping And Logistics Management Dashboard With Perfect Brochure PDF
This slide covers KPIs to track the automation system of the company including warehouse operating costs, perfect order cost, on-time shipment etc. Find highly impressive Robotic Process Automation Shipping And Logistics Management Dashboard With Perfect Brochure PDF on Slidegeeks to deliver a meaningful presentation. You can save an ample amount of time using these presentation templates. No need to worry to prepare everything from scratch because Slidegeeks experts have already done a huge research and work for you. You need to download Robotic Process Automation Shipping And Logistics Management Dashboard With Perfect Brochure PDF for your upcoming presentation. All the presentation templates are 100 percent editable and you can change the color and personalize the content accordingly. Download now

Marketing Mix Strategy Handbook Social Media Campaign Management Dashboard Professional PDF
This slide showcases a dashboard for managing ad social media campaign to assists marketers in tracking success of ads, content engagement and reach. It highlights element such as date period, goals completion all, goals conversion rate, target progress bar, users, sessions, etc. Want to ace your presentation in front of a live audience Our Marketing Mix Strategy Handbook Social Media Campaign Management Dashboard Professional PDF can help you do that by engaging all the users towards you. Slidegeeks experts have put their efforts and expertise into creating these impeccable powerpoint presentations so that you can communicate your ideas clearly. Moreover, all the templates are customizable, and easy-to-edit and downloadable. Use these for both personal and commercial use.

Employee Performance Management To Enhance Organizational Growth KPI Dashboard To Assess Training Diagrams PDF
The best PPT templates are a great way to save time, energy, and resources. Slidegeeks have 100 percent editable powerpoint slides making them incredibly versatile. With these quality presentation templates, you can create a captivating and memorable presentation by combining visually appealing slides and effectively communicating your message. Download Employee Performance Management To Enhance Organizational Growth KPI Dashboard To Assess Training Diagrams PDF from Slidegeeks and deliver a wonderful presentation.

Information Technology Company Monthly Sales Forecast Dashboard Ppt Portfolio Images PDF
This slide shows the dashboard representing the data related to monthly sales forecast of an Information Technology Company. It shows information related to the net sales by customer, variance between actual and forecasted sales, total net sales, net sales per customer and total net sales per time for actual and forecasted sales. Pitch your topic with ease and precision using this Information Technology Company Monthly Sales Forecast Dashboard Ppt Portfolio Images PDF. This layout presents information on Total Net Sales, Actual vs Forecast, Net Sales Customer. It is also available for immediate download and adjustment. So, changes can be made in the color, design, graphics or any other component to create a unique layout.

Shipping And Logistics Management Dashboard With Perfect Order Rate And Warehouse Operating Costs Topics PDF
This slide covers KPIs to track the automation system of the company including warehouse operating costs, perfect order cost, on-time shipment etc. Do you have to make sure that everyone on your team knows about any specific topic I yes, then you should give Shipping And Logistics Management Dashboard With Perfect Order Rate And Warehouse Operating Costs Topics PDF a try. Our experts have put a lot of knowledge and effort into creating this impeccable Shipping And Logistics Management Dashboard With Perfect Order Rate And Warehouse Operating Costs Topics PDF. You can use this template for your upcoming presentations, as the slides are perfect to represent even the tiniest detail. You can download these templates from the Slidegeeks website and these are easy to edit. So grab these today.

Customer Relationship Management And Daily Payments Dashboard With Top Reviews Professional PDF
This slide illustrates graphical representation of customer relationship management figures. It includes revenue, daily payments graph and top products etc. Showcasing this set of slides titled Customer Relationship Management And Daily Payments Dashboard With Top Reviews Professional PDF. The topics addressed in these templates are Quality Product, Services, Revenue. All the content presented in this PPT design is completely editable. Download it and make adjustments in color, background, font etc. as per your unique business setting.

Customer Relationship Management Dashboard Technologies Initiatives To Improve Customer Relationship Clipart PDF
Presenting customer relationship management dashboard technologies initiatives to improve customer relationship clipart pdf to provide visual cues and insights. Share and navigate important information on six stages that need your due attention. This template can be used to pitch topics like attractiveness of offer, targeting of profitable customers, ability to deal with follow up contacts. In addtion, this PPT design contains high resolution images, graphics, etc, that are easily editable and available for immediate download.
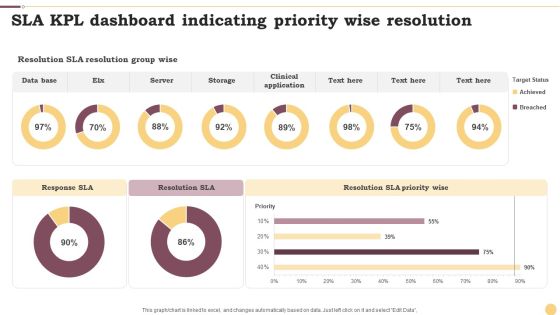
SLA KPL Dashboard Indicating Priority Wise Resolution Ppt Infographics Example File PDF
This graph or chart is linked to excel, and changes automatically based on data. Just left click on it and select Edit Data. Pitch your topic with ease and precision using this SLA KPL Dashboard Indicating Priority Wise Resolution Ppt Infographics Example File PDF. This layout presents information on Data Base, Server, Storage. It is also available for immediate download and adjustment. So, changes can be made in the color, design, graphics or any other component to create a unique layout.

Guide To Healthcare Services Administration KPI Metrics Dashboard To Measure Effectiveness Healthcare Information PDF
The following slide showcases key performance indicator KPI metrics dashboard which can be used to evaluate the success rate of healthcare recruitment. It covers information about technical and non-technical hiring, recruitment costs, current hiring pipeline etc. This Guide To Healthcare Services Administration KPI Metrics Dashboard To Measure Effectiveness Healthcare Information PDF from Slidegeeks makes it easy to present information on your topic with precision. It provides customization options, so you can make changes to the colors, design, graphics, or any other component to create a unique layout. It is also available for immediate download, so you can begin using it right away. Slidegeeks has done good research to ensure that you have everything you need to make your presentation stand out. Make a name out there for a brilliant performance.

Manufacturing Process Automation For Enhancing Productivity Supply Chain And Logistics RPA Management Dashboard Diagrams PDF
This slide illustrates supply chain and logistics robotic process automation RPA management dashboard. It provides information about active bots, bot hours, carton pickup, pickup productivity, etc. Present like a pro with Manufacturing Process Automation For Enhancing Productivity Supply Chain And Logistics RPA Management Dashboard Diagrams PDF Create beautiful presentations together with your team, using our easy to use presentation slides. Share your ideas in real time and make changes on the fly by downloading our templates. So whether you are in the office, on the go, or in a remote location, you can stay in sync with your team and present your ideas with confidence. With Slidegeeks presentation got a whole lot easier. Grab these presentations today.

Cloud Kitchen Business Performance Management Dashboard Analyzing Global Commissary Guidelines PDF
This slide highlights a dashboard to track and manage performance progress of a dark kitchen business. It showcases components such as income, expense, order rate, activity, total order complete, total order delivered, total order cancelled, order pending and popular food.Present like a pro with Cloud Kitchen Business Performance Management Dashboard Analyzing Global Commissary Guidelines PDF Create beautiful presentations together with your team, using our easy-to-use presentation slides. Share your ideas in real-time and make changes on the fly by downloading our templates. So whether you are in the office, on the go, or in a remote location, you can stay in sync with your team and present your ideas with confidence. With Slidegeeks presentation got a whole lot easier. Grab these presentations today.

Service SLA KPL Changes And Incidents Dashboard Ppt Inspiration Infographics PDF
This graph or chart is linked to excel, and changes automatically based on data. Just left click on it and select Edit Data. Pitch your topic with ease and precision using this Service SLA KPL Changes And Incidents Dashboard Ppt Inspiration Infographics PDF. This layout presents information on Time Spent Department, Incidents Closed, Operator Group. It is also available for immediate download and adjustment. So, changes can be made in the color, design, graphics or any other component to create a unique layout.

SLA KPL Dashboard Indicating Top Week Performers Ppt Infographics Examples PDF
This graph or chart is linked to excel, and changes automatically based on data. Just left click on it and select Edit Data. Showcasing this set of slides titled SLA KPL Dashboard Indicating Top Week Performers Ppt Infographics Examples PDF. The topics addressed in these templates are Active Slas Risk, Active Slas Breached, Active Slas. All the content presented in this PPT design is completely editable. Download it and make adjustments in color, background, font etc. as per your unique business setting.
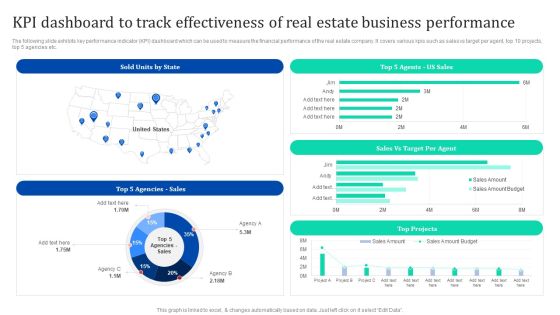
KPI Dashboard To Track Effectiveness Of Real Estate Business Enhancing Process Improvement By Regularly Themes PDF
The following slide exhibits key performance indicator KPI dashboard which can be used to measure the financial performance of the real estate company. It covers various kpis such as sales vs target per agent, top 10 projects, top 5 agencies etc. Welcome to our selection of the KPI Dashboard To Track Effectiveness Of Real Estate Business Enhancing Process Improvement By Regularly Themes PDF. These are designed to help you showcase your creativity and bring your sphere to life. Planning and Innovation are essential for any business that is just starting out. This collection contains the designs that you need for your everyday presentations. All of our PowerPoints are 100 parcent editable, so you can customize them to suit your needs. This multi-purpose template can be used in various situations. Grab these presentation templates today.

PIM Software Deployment To Enhance Conversion Rates Enterprise Product Page Information Key Metrics Dashboard Mockup PDF
This slide represents key metrics dashboard showing information related to enterprise products. It includes details related to report breakdown, product grade distribution etc. This PIM Software Deployment To Enhance Conversion Rates Enterprise Product Page Information Key Metrics Dashboard Mockup PDF from Slidegeeks makes it easy to present information on your topic with precision. It provides customization options, so you can make changes to the colors, design, graphics, or any other component to create a unique layout. It is also available for immediate download, so you can begin using it right away. Slidegeeks has done good research to ensure that you have everything you need to make your presentation stand out. Make a name out there for a brilliant performance.
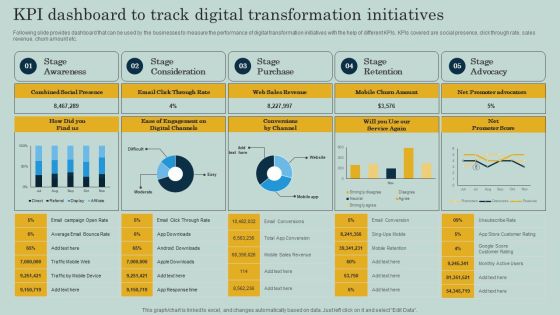
KPI Dashboard To Track Digital Transformation Initiatives Ppt Show Backgrounds PDF
Following slide provides dashboard that can be used by the businesses to measure the performance of digital transformation initiatives with the help of different KPIs. KPIs covered are social presence, click through rate, sales revenue, churn amount etc. The KPI Dashboard To Track Digital Transformation Initiatives Ppt Show Backgrounds PDF is a compilation of the most recent design trends as a series of slides. It is suitable for any subject or industry presentation, containing attractive visuals and photo spots for businesses to clearly express their messages. This template contains a variety of slides for the user to input data, such as structures to contrast two elements, bullet points, and slides for written information. Slidegeeks is prepared to create an impression.

PIM Software Deployment To Enhance Conversion Rates Product Information Dashboard Representing Data Quality Statistics Download PDF
This slide represents the KPI dashboard representing PIM data quality statistics. It includes details related to top users, channels, number of entities created etc. Coming up with a presentation necessitates that the majority of the effort goes into the content and the message you intend to convey. The visuals of a PowerPoint presentation can only be effective if it supplements and supports the story that is being told. Keeping this in mind our experts created PIM Software Deployment To Enhance Conversion Rates Product Information Dashboard Representing Data Quality Statistics Download PDF to reduce the time that goes into designing the presentation. This way, you can concentrate on the message while our designers take care of providing you with the right template for the situation.

Echniques To Enhance Brand Dashboard Depicting Website Data Insights Clipart PDF
This slide shows the dashboard that depicts website data insights which covers channels such as display, social and email with total sessions, pages, average session duration, bounce rate, goal completion. Coming up with a presentation necessitates that the majority of the effort goes into the content and the message you intend to convey. The visuals of a PowerPoint presentation can only be effective if it supplements and supports the story that is being told. Keeping this in mind our experts created Echniques To Enhance Brand Dashboard Depicting Website Data Insights Clipart PDF to reduce the time that goes into designing the presentation. This way, you can concentrate on the message while our designers take care of providing you with the right template for the situation.
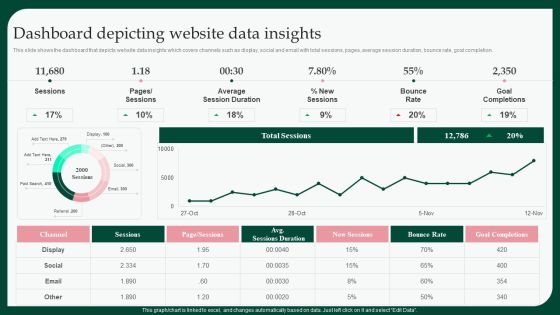
Boosting Product Sales Through Branding Dashboard Depicting Website Data Brochure PDF
This slide shows the dashboard that depicts website data insights which covers channels such as display, social and email with total sessions, pages, average session duration, bounce rate, goal completion. Coming up with a presentation necessitates that the majority of the effort goes into the content and the message you intend to convey. The visuals of a PowerPoint presentation can only be effective if it supplements and supports the story that is being told. Keeping this in mind our experts created Boosting Product Sales Through Branding Dashboard Depicting Website Data Brochure PDF to reduce the time that goes into designing the presentation. This way, you can concentrate on the message while our designers take care of providing you with the right template for the situation.
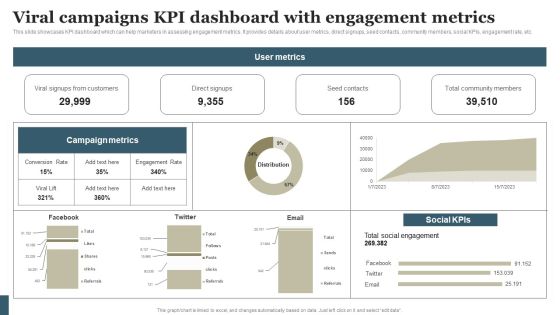
Viral Marketing Techniques To Increase Annual Business Sales Viral Campaigns KPI Dashboard With Engagement Guidelines PDF
This slide showcases KPI dashboard which can help marketers in assessing engagement metrics. It provides details about user metrics, direct signups, seed contacts, community members, social KPIs, engagement rate, etc. Present like a pro with Viral Marketing Techniques To Increase Annual Business Sales Viral Campaigns KPI Dashboard With Engagement Guidelines PDF Create beautiful presentations together with your team, using our easy-to-use presentation slides. Share your ideas in real-time and make changes on the fly by downloading our templates. So whether you are in the office, on the go, or in a remote location, you can stay in sync with your team and present your ideas with confidence. With Slidegeeks presentation got a whole lot easier. Grab these presentations today.

Prevention Of Information KPI Metrics Dashboard To Effectively Track Cyber Guidelines PDF
The purpose of this slide is to highlight performance KPI dashboard used to monitor the cyber threat management. The metrics highlighted in the slide are risk score, compliance status, threat level, monitoring and operational status. Welcome to our selection of the Prevention Of Information KPI Metrics Dashboard To Effectively Track Cyber Guidelines PDF. These are designed to help you showcase your creativity and bring your sphere to life. Planning and Innovation are essential for any business that is just starting out. This collection contains the designs that you need for your everyday presentations. All of our PowerPoints are 100 percent editable, so you can customize them to suit your needs. This multi-purpose template can be used in various situations. Grab these presentation templates today

Client Life Cycle Dashboard With Marketing Metrics Ppt File Format PDF
This slide shows the key marketing KPIs such as conversion rate, impressions, etc. in customer journey cycle Showcasing this set of slides titled client life cycle dashboard with marketing metrics ppt file format pdf. The topics addressed in these templates are average customer rating, conversion rate, purchases. All the content presented in this PPT design is completely editable. Download it and make adjustments in color, background, font etc. as per your unique business setting.
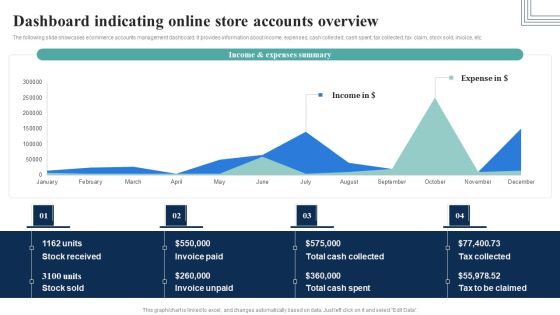
How Electronic Commerce Financial Procedure Can Be Enhanced Dashboard Indicating Online Store Pictures PDF
The following slide showcases ecommerce accounts management dashboard. It provides information about income, expenses, cash collected, cash spent, tax collected, tax claim, stock sold, invoice, etc.Do you know about Slidesgeeks How Electronic Commerce Financial Procedure Can Be Enhanced Dashboard Indicating Online Store Pictures PDF These are perfect for delivering any kind od presentation. Using it, create PowerPoint presentations that communicate your ideas and engage audiences. Save time and effort by using our pre-designed presentation templates that are perfect for a wide range of topic. Our vast selection of designs covers a range of styles, from creative to business, and are all highly customizable and easy to edit. Download as a PowerPoint template or use them as Google Slides themes.

Supplier Planning Dashboard Highlighting Compliance Stats With Procurement Time Topics PDF
From laying roadmaps to briefing everything in detail, our templates are perfect for you. You can set the stage with your presentation slides. All you have to do is download these easy to edit and customizable templates. Supplier Planning Dashboard Highlighting Compliance Stats With Procurement Time Topics PDF will help you deliver an outstanding performance that everyone would remember and praise you for. Do download this presentation today.

Customer Support Services Customer Service Dashboard To Monitor Kpis Microsoft PDF
This slide showcases support service dashboard to track relevant performance metrics. Major KPIs covered are customer satisfaction, average time to resolve problem, cost per support, customer retention, request volume, etc. Slidegeeks is here to make your presentations a breeze with Customer Support Services Customer Service Dashboard To Monitor Kpis Microsoft PDF With our easy-to-use and customizable templates, you can focus on delivering your ideas rather than worrying about formatting. With a variety of designs to choose from, youre sure to find one that suits your needs. And with animations and unique photos, illustrations, and fonts, you can make your presentation pop. So whether youre giving a sales pitch or presenting to the board, make sure to check out Slidegeeks first.
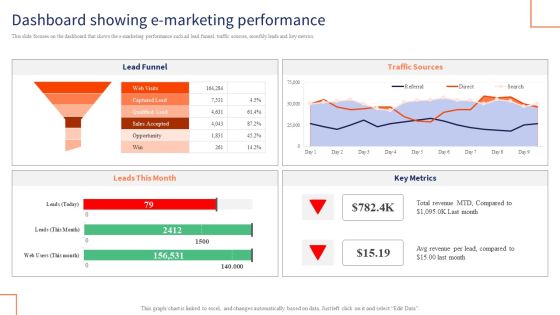
Optimizing Digital Channels To Enhance Marketing Strategy Dashboard Showing E Marketing Performance Brochure PDF
This slide focuses on the dashboard that shows the e marketing performance such ad lead funnel, traffic sources, monthly leads and key metrics. Do you know about Slidesgeeks Optimizing Digital Channels To Enhance Marketing Strategy Dashboard Showing E Marketing Performance Brochure PDF These are perfect for delivering any kind od presentation. Using it, create PowerPoint presentations that communicate your ideas and engage audiences. Save time and effort by using our pre designed presentation templates that are perfect for a wide range of topic. Our vast selection of designs covers a range of styles, from creative to business, and are all highly customizable and easy to edit. Download as a PowerPoint template or use them as Google Slides themes.

Performance KPI Dashboard To Analyze Healthcare Marketing Strategies Performance Guidelines PDF
The following slide showcases a comprehensive dashboard which can be used to evaluate the effectiveness of marketing strategies. The key metrics are total searches, brand mentions, customer value, total spending on advertisement etc. Do you know about Slidesgeeks Performance KPI Dashboard To Analyze Healthcare Marketing Strategies Performance Guidelines PDF. These are perfect for delivering any kind od presentation. Using it, create PowerPoint presentations that communicate your ideas and engage audiences. Save time and effort by using our pre designed presentation templates that are perfect for a wide range of topic. Our vast selection of designs covers a range of styles, from creative to business, and are all highly customizable and easy to edit. Download as a PowerPoint template or use them as Google Slides themes.

Dashboard For Tracking Viral Posts Across Digital Channels Deploying Viral Marketing Strategies Structure PDF
This slide showcases dashboard which can help marketers track viral posts across multiple platforms. It provides details about viral views, seed views, direct, searh, referrer, network, Facebook, Twitter, etc. Welcome to our selection of the Dashboard For Tracking Viral Posts Across Digital Channels Deploying Viral Marketing Strategies Structure PDF. These are designed to help you showcase your creativity and bring your sphere to life. Planning and Innovation are essential for any business that is just starting out. This collection contains the designs that you need for your everyday presentations. All of our PowerPoints are 100 precent editable, so you can customize them to suit your needs. This multi-purpose template can be used in various situations. Grab these presentation templates today.
Ultimate Guide To Improve Customer Support And Services Kpi Dashboard For Tracking Customer Retention Guidelines PDF
This slide covers the dashboard for analyzing customer loyalty with metrics such as NPS, loyal customer rate, premium users, CLV, customer churn, revenue churn, net retention, MRR growth, etc. Welcome to our selection of the Ultimate Guide To Improve Customer Support And Services Kpi Dashboard For Tracking Customer Retention Guidelines PDF. These are designed to help you showcase your creativity and bring your sphere to life. Planning and Innovation are essential for any business that is just starting out. This collection contains the designs that you need for your everyday presentations. All of our PowerPoints are 100 percent editable, so you can customize them to suit your needs. This multi purpose template can be used in various situations. Grab these presentation templates today.

Product Marketing Leadership Product Marketing Dashboard For Pay Per Microsoft PDF
This graph or chart is linked to excel, and changes automatically based on data. Just left click on it and select Edit Data. Find a pre-designed and impeccable Product Marketing Leadership Product Marketing Dashboard For Pay Per Microsoft PDF. The templates can ace your presentation without additional effort. You can download these easy-to-edit presentation templates to make your presentation stand out from others. So, what are you waiting for Download the template from Slidegeeks today and give a unique touch to your presentation.
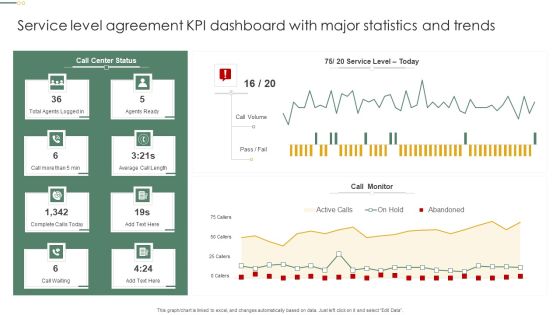
Service Level Agreement KPI Dashboard With Major Statistics And Trends Pictures PDF
This graph or chart is linked to excel, and changes automatically based on data. Just left click on it and select Edit Data. Pitch your topic with ease and precision using this Service Level Agreement KPI Dashboard With Major Statistics And Trends Pictures PDF. This layout presents information on Call Monitor, Call Volume, Agents Ready. It is also available for immediate download and adjustment. So, changes can be made in the color, design, graphics or any other component to create a unique layout.
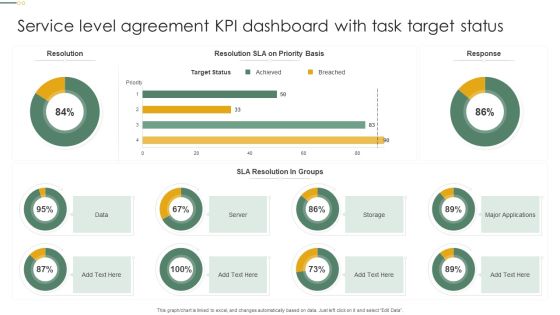
Service Level Agreement KPI Dashboard With Task Target Status Microsoft PDF
This graph or chart is linked to excel, and changes automatically based on data. Just left click on it and select Edit Data. Pitch your topic with ease and precision using this Service Level Agreement KPI Dashboard With Task Target Status Microsoft PDF. This layout presents information on Target Status, Sla Resolution, Groups, Server. It is also available for immediate download and adjustment. So, changes can be made in the color, design, graphics or any other component to create a unique layout.

Implementing Digital Transformation Kpi Dashboard To Track Digital Transformation Initiatives Structure PDF
Following slide provides dashboard that can be used by the businesses to measure the performance of digital transformation initiatives with the help of different KPIs. KPIs covered are social presence, click through rate, sales revenue, churn amount etc. The Implementing Digital Transformation Kpi Dashboard To Track Digital Transformation Initiatives Structure PDF is a compilation of the most recent design trends as a series of slides. It is suitable for any subject or industry presentation, containing attractive visuals and photo spots for businesses to clearly express their messages. This template contains a variety of slides for the user to input data, such as structures to contrast two elements, bullet points, and slides for written information. Slidegeeks is prepared to create an impression.

Client Helpline Dashboard Average Time To Solve Issue Ppt Portfolio Visuals PDF
This graph or chart is linked to excel, and changes automatically based on data. Just left click on it and select Edit Data. Showcasing this set of slides titled Client Helpline Dashboard Average Time To Solve Issue Ppt Portfolio Visuals PDF. The topics addressed in these templates are Cost Per Support, Customer Satisfaction, Costs To Revenue. All the content presented in this PPT design is completely editable. Download it and make adjustments in color, background, font etc. as per your unique business setting.

Client Helpline Dashboard With Average Talk Time Distribution Ppt Gallery Backgrounds PDF
This graph or chart is linked to excel, and changes automatically based on data. Just left click on it and select Edit Data. Showcasing this set of slides titled Client Helpline Dashboard With Average Talk Time Distribution Ppt Gallery Backgrounds PDF. The topics addressed in these templates are External Incoming Call, Occupancy, Break Time, Sales. All the content presented in this PPT design is completely editable. Download it and make adjustments in color, background, font etc. as per your unique business setting.

Client Helpline Dashboard With Resolution And Response Rate Ppt File Example Topics PDF
This graph or chart is linked to excel, and changes automatically based on data. Just left click on it and select Edit Data. Showcasing this set of slides titled Client Helpline Dashboard With Resolution And Response Rate Ppt File Example Topics PDF. The topics addressed in these templates are Resolutions, Response Time, Response Time Weekday. All the content presented in this PPT design is completely editable. Download it and make adjustments in color, background, font etc. as per your unique business setting.

Helpdesk SLA KPL Dashboard Illustrating Calls Details Ppt Slides Show PDF
This graph or chart is linked to excel, and changes automatically based on data. Just left click on it and select Edit Data. Showcasing this set of slides titled Helpdesk SLA KPL Dashboard Illustrating Calls Details Ppt Slides Show PDF. The topics addressed in these templates are Call Type Today, Trunk Utilization Today, Call Summery Today. All the content presented in this PPT design is completely editable. Download it and make adjustments in color, background, font etc. as per your unique business setting.

SLA KPL Dashboard Indicating Compliance Priority With KPI Ppt File Format PDF
This graph or chart is linked to excel, and changes automatically based on data. Just left click on it and select Edit Data. Showcasing this set of slides titled SLA KPL Dashboard Indicating Compliance Priority With KPI Ppt File Format PDF. The topics addressed in these templates are KPI Graph, Insights Here, SLA Compliance Priority. All the content presented in this PPT design is completely editable. Download it and make adjustments in color, background, font etc. as per your unique business setting.

Water NRM Water Management KPI Dashboard Showing Water Quality Test Results Information PDF
Presenting this set of slides with name water nrm water management kpi dashboard showing water quality test results information pdf. The topics discussed in these slides are contaminants causing epa non compliance, water quality, water quality test results, samples exceeding health guidelines samples with unregulated contaminates detected. This is a completely editable PowerPoint presentation and is available for immediate download. Download now and impress your audience.
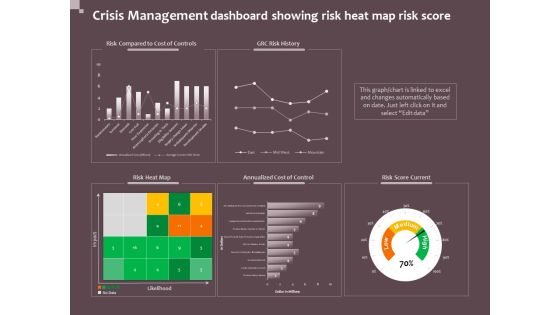
Hazard Administration Crisis Management Dashboard Showing Risk Heat Map Risk Score Guidelines PDF
Presenting this set of slides with name hazard administration crisis management dashboard showing risk heat map risk score guidelines pdf. The topics discussed in these slides are risk heat map, annualized cost of control, risk score current, grc risk history, risk compared to cost of controls. This is a completely editable PowerPoint presentation and is available for immediate download. Download now and impress your audience.
SEO Tracking Dashboard For Backlinks And Keywords Ppt PowerPoint Presentation File Deck PDF
Purpose of the following slide is to measure the SEO performance of the organization as it measures the keywords, backlinks, the total number of sessions and average call duration The SEO Tracking Dashboard For Backlinks And Keywords Ppt PowerPoint Presentation File Deck PDF is a compilation of the most recent design trends as a series of slides. It is suitable for any subject or industry presentation, containing attractive visuals and photo spots for businesses to clearly express their messages. This template contains a variety of slides for the user to input data, such as structures to contrast two elements, bullet points, and slides for written information. Slidegeeks is prepared to create an impression.

Implementing Cyber Security Incident Cyber Supply Chain Risk Dashboard Download PDF
This slide shows the dashboard representing details related to management of supply chain risks by the incident management team. It includes details related to KPIs such as policy and compliance, resource security hygiene etc. Slidegeeks is here to make your presentations a breeze with Implementing Cyber Security Incident Cyber Supply Chain Risk Dashboard Download PDF With our easy to use and customizable templates, you can focus on delivering your ideas rather than worrying about formatting. With a variety of designs to choose from, you are sure to find one that suits your needs. And with animations and unique photos, illustrations, and fonts, you can make your presentation pop. So whether you are giving a sales pitch or presenting to the board, make sure to check out Slidegeeks first.

Guide For Systematic Performance Metrics Dashboard To Track Overall Rebranding Background PDF
This slide provides information regarding essential characteristics of co-branding in terms of strategic partnership, build credibility, developing marketing strategy, develop innovation and value addition, etc. Formulating a presentation can take up a lot of effort and time, so the content and message should always be the primary focus. The visuals of the PowerPoint can enhance the presenters message, so our Guide For Systematic Performance Metrics Dashboard To Track Overall Rebranding Background PDF was created to help save time. Instead of worrying about the design, the presenter can concentrate on the message while our designers work on creating the ideal templates for whatever situation is needed. Slidegeeks has experts for everything from amazing designs to valuable content, we have put everything into Guide For Systematic Performance Metrics Dashboard To Track Overall Rebranding Background PDF.
Reinforcement Learning Techniques And Applications Performance Tracking Dashboard Reinforcement Diagrams PDF
This slide shows the roadmap for the reinforcement learning project, including the list of tasks to be performed from March 2023 to February 2024. The tasks include initializing the values table, observing the current state, choosing an action for that state, and so on. Formulating a presentation can take up a lot of effort and time, so the content and message should always be the primary focus. The visuals of the PowerPoint can enhance the presenters message, so our Reinforcement Learning Techniques And Applications Performance Tracking Dashboard Reinforcement Diagrams PDF was created to help save time. Instead of worrying about the design, the presenter can concentrate on the message while our designers work on creating the ideal templates for whatever situation is needed. Slidegeeks has experts for everything from amazing designs to valuable content, we have put everything into Reinforcement Learning Techniques And Applications Performance Tracking Dashboard Reinforcement Diagrams PDF

Integrating ITSM To Enhance Service Service Desk Dashboard For Monitoring It Infrastructure Infographics PDF
This slide illustrates service desk dashboard for monitoring information technology IT infrastructure. It provides information about issues, safety inspection, problem servers, workstations, operating system, Windows, Mac, Linux, etc. Do you know about Slidesgeeks Integrating ITSM To Enhance Service Service Desk Dashboard For Monitoring It Infrastructure Infographics PDF These are perfect for delivering any kind od presentation. Using it, create PowerPoint presentations that communicate your ideas and engage audiences. Save time and effort by using our pre-designed presentation templates that are perfect for a wide range of topic. Our vast selection of designs covers a range of styles, from creative to business, and are all highly customizable and easy to edit. Download as a PowerPoint template or use them as Google Slides themes.
 Home
Home