Executive Summary Dashboard

Business Restructuring Process Dashboard To Measure Business Financial Performance Rules PDF
This slide shows the dashboard to measure business financial performance which focuses on revenues, debt to equity, net profit margin, gross profit margin and return on equity. If you are looking for a format to display your unique thoughts, then the professionally designed Business Restructuring Process Dashboard To Measure Business Financial Performance Rules PDF is the one for you. You can use it as a Google Slides template or a PowerPoint template. Incorporate impressive visuals, symbols, images, and other charts. Modify or reorganize the text boxes as you desire. Experiment with shade schemes and font pairings. Alter, share or cooperate with other people on your work. Download Business Restructuring Process Dashboard To Measure Business Financial Performance Rules PDF and find out how to give a successful presentation. Present a perfect display to your team and make your presentation unforgettable.

Optimizing Production Process Smart Manufacturing Dashboard To Track Production Diagrams PDF
This slide represents smart manufacturing dashboard. It covers production volume, downtime causes, top product sold item, sales revenue, active machinery etc. If you are looking for a format to display your unique thoughts, then the professionally designed Optimizing Production Process Smart Manufacturing Dashboard To Track Production Diagrams PDF is the one for you. You can use it as a Google Slides template or a PowerPoint template. Incorporate impressive visuals, symbols, images, and other charts. Modify or reorganize the text boxes as you desire. Experiment with shade schemes and font pairings. Alter, share or cooperate with other people on your work. Download Optimizing Production Process Smart Manufacturing Dashboard To Track Production Diagrams PDF and find out how to give a successful presentation. Present a perfect display to your team and make your presentation unforgettable.
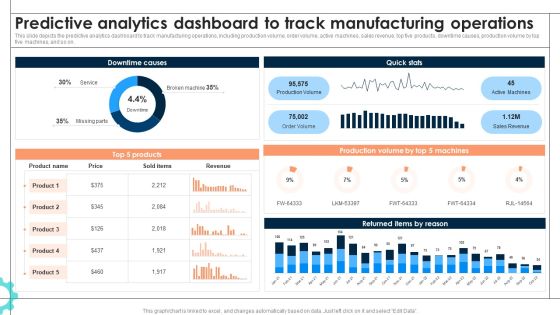
Intelligent Manufacturing Predictive Analytics Dashboard To Track Manufacturing Operations Information PDF
This slide depicts the predictive analytics dashboard to track manufacturing operations, including production volume, order volume, active machines, sales revenue, top five products, downtime causes, production volume by top five machines, and so on. If you are looking for a format to display your unique thoughts, then the professionally designed Intelligent Manufacturing Predictive Analytics Dashboard To Track Manufacturing Operations Information PDF is the one for you. You can use it as a Google Slides template or a PowerPoint template. Incorporate impressive visuals, symbols, images, and other charts. Modify or reorganize the text boxes as you desire. Experiment with shade schemes and font pairings. Alter, share or cooperate with other people on your work. Download Intelligent Manufacturing Predictive Analytics Dashboard To Track Manufacturing Operations Information PDF and find out how to give a successful presentation. Present a perfect display to your team and make your presentation unforgettable.
Product Branding To Enhance Product Branding Performance Tracking Dashboard Graphics PDF
This slide provides information regarding product branding performance tracking dashboard in terms of revenues, new customers, customer satisfaction rate. If you are looking for a format to display your unique thoughts, then the professionally designed Product Branding To Enhance Product Branding Performance Tracking Dashboard Graphics PDF is the one for you. You can use it as a Google Slides template or a PowerPoint template. Incorporate impressive visuals, symbols, images, and other charts. Modify or reorganize the text boxes as you desire. Experiment with shade schemes and font pairings. Alter, share or cooperate with other people on your work. Download Product Branding To Enhance Product Branding Performance Tracking Dashboard Graphics PDF and find out how to give a successful presentation. Present a perfect display to your team and make your presentation unforgettable.
Effective Lead Generation For Higher Conversion Rates Dashboard For Tracking Leads Generated From Various Guidelines PDF
This slide covers the KPI dashboard for tracking metrics such as leads, ACV wins, customer acquisition cost, click-through rate, and cost per conversion. It also includes leads per various campaigns such as social media, paid marketing, email marketing, etc. If you are looking for a format to display your unique thoughts, then the professionally designed Effective Lead Generation For Higher Conversion Rates Dashboard For Tracking Leads Generated From Various Guidelines PDF is the one for you. You can use it as a Google Slides template or a PowerPoint template. Incorporate impressive visuals, symbols, images, and other charts. Modify or reorganize the text boxes as you desire. Experiment with shade schemes and font pairings. Alter, share or cooperate with other people on your work. Download Effective Lead Generation For Higher Conversion Rates Dashboard For Tracking Leads Generated From Various Guidelines PDF and find out how to give a successful presentation. Present a perfect display to your team and make your presentation unforgettable.

Iot Integration In Manufacturing Predictive Analytics Dashboard To Track Manufacturing Operations Background PDF
This slide depicts the predictive analytics dashboard to track manufacturing operations, including production volume, order volume, active machines, sales revenue, top five products, downtime causes, production volume by top five machines, and so on. If you are looking for a format to display your unique thoughts, then the professionally designed Iot Integration In Manufacturing Predictive Analytics Dashboard To Track Manufacturing Operations Background PDF is the one for you. You can use it as a Google Slides template or a PowerPoint template. Incorporate impressive visuals, symbols, images, and other charts. Modify or reorganize the text boxes as you desire. Experiment with shade schemes and font pairings. Alter, share or cooperate with other people on your work. Download Iot Integration In Manufacturing Predictive Analytics Dashboard To Track Manufacturing Operations Background PDF and find out how to give a successful presentation. Present a perfect display to your team and make your presentation unforgettable.
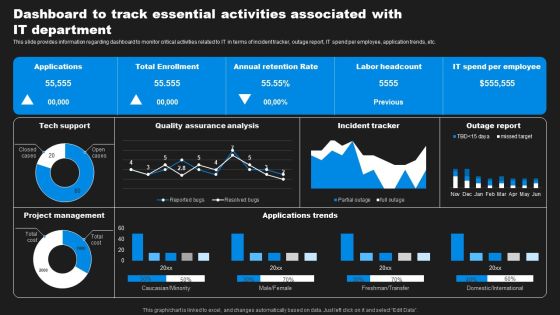
Enhancing Information Technology With Strategic Dashboard To Track Essential Activities Formats PDF
This slide provides information regarding dashboard to monitor critical activities related to IT in terms of incident tracker, outage report, IT spend per employee, application trends, etc. If you are looking for a format to display your unique thoughts, then the professionally designed Enhancing Information Technology With Strategic Dashboard To Track Essential Activities Formats PDF is the one for you. You can use it as a Google Slides template or a PowerPoint template. Incorporate impressive visuals, symbols, images, and other charts. Modify or reorganize the text boxes as you desire. Experiment with shade schemes and font pairings. Alter, share or cooperate with other people on your work. Download Enhancing Information Technology With Strategic Dashboard To Track Essential Activities Formats PDF and find out how to give a successful presentation. Present a perfect display to your team and make your presentation unforgettable.

Retail KPI Dashboard To Evaluate Merchandising Sales Plan Performance Rules PDF
Mentioned slide showcases merchandising dashboard which can be used to analyze sales performance of various products. It covers metrics such as different types of product sold, revenue earned, payment methods used, sales in different years etc.Showcasing this set of slides titled Retail KPI Dashboard To Evaluate Merchandising Sales Plan Performance Rules PDF. The topics addressed in these templates are Clothing Apparel, Trend Merchandise, Items Sold. All the content presented in this PPT design is completely editable. Download it and make adjustments in color, background, font etc. as per your unique business setting.
You Tube Advertising Campaign Performance Analytics Dashboard Ppt Icon Diagrams PDF
This slide represents dashboard showing analytics of performance of you tube marketing campaign. It includes data related to no. of visitors, qualified leads, customers and annual recurring revenue, lifetime value, gross volume etc generated through the campaign. Showcasing this set of slides titled You Tube Advertising Campaign Performance Analytics Dashboard Ppt Icon Diagrams PDF. The topics addressed in these templates are Monthly Recurring Revenue, Bounce Rate, Customer Churn Rate. All the content presented in this PPT design is completely editable. Download it and make adjustments in color, background, font etc. as per your unique business setting.
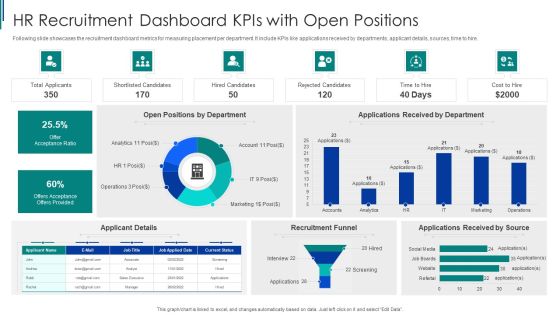
HR Recruitment Dashboard Kpis With Open Positions Ppt Model Good PDF
Following slide showcases the recruitment dashboard metrics for measuring placement per department. It include KPIs like applications received by departments, applicant details, sources, time to hire. Pitch your topic with ease and precision using this HR Recruitment Dashboard Kpis With Open Positions Ppt Model Good PDF. This layout presents information on Offer Acceptance Ratio, Recruitment Funnel, Applicant Details. It is also available for immediate download and adjustment. So, changes can be made in the color, design, graphics or any other component to create a unique layout.

Introduction To New Product Portfolio Product Portfolio Monitoring Dashboard Ppt Portfolio Background PDF
Mentioned slide shows a dashboard that can be used by a product manager to monitor different product portfolios developed and offered by the organization. KPIs included are portfolio budget, issues across portfolios and portfolio risks by impact. Welcome to our selection of the Introduction To New Product Portfolio Product Portfolio Monitoring Dashboard Ppt Portfolio Background PDF. These are designed to help you showcase your creativity and bring your sphere to life. Planning and Innovation are essential for any business that is just starting out. This collection contains the designs that you need for your everyday presentations. All of our PowerPoints are 100 percent editable, so you can customize them to suit your needs. This multi-purpose template can be used in various situations. Grab these presentation templates today.

KPI Dashboard To Track Sales And Operations Process Of Manufacturing Enterprise Brochure PDF
This slide depicts a dashboard to track the key performance metrics in sales and operations process of a manufacturing enterprise to analyze deviations in the actual and planned output. The key performing indicators are percentage deviation, dollar deviation, inventory in hand etc.Pitch your topic with ease and precision using this KPI Dashboard To Track Sales And Operations Process Of Manufacturing Enterprise Brochure PDF. This layout presents information on Planned Output, Yearly Growth, Inventory Hand. It is also available for immediate download and adjustment. So, changes can be made in the color, design, graphics or any other component to create a unique layout.

KPI Dashboard Highlighting Automation Results In Supply Chain Management Rules PDF
The following slide outlines a comprehensive dashboard depicting the business process automation BPA results in the supply chain. Information covered in the slide is related to average order processing days, average shipping days, etc. Deliver and pitch your topic in the best possible manner with this KPI Dashboard Highlighting Automation Results In Supply Chain Management Rules PDF. Use them to share invaluable insights on Average Order Fulfillment Days, Average Shipping Days, Average Order Processing Days and impress your audience. This template can be altered and modified as per your expectations. So, grab it now.
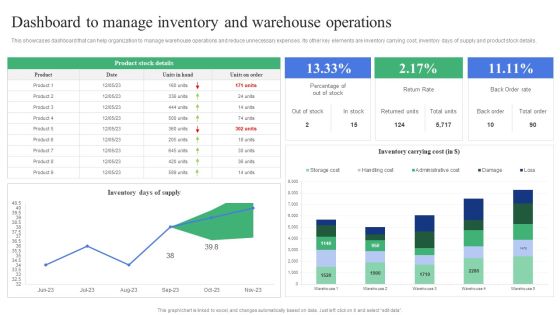
Strategic Guidelines To Administer Dashboard To Manage Inventory And Warehouse Introduction PDF
This showcases dashboard that can help organization to manage warehouse operations and reduce unnecessary expenses. Its other key elements are inventory carrying cost, inventory days of supply and product stock details. This Strategic Guidelines To Administer Dashboard To Manage Inventory And Warehouse Introduction PDF from Slidegeeks makes it easy to present information on your topic with precision. It provides customization options, so you can make changes to the colors, design, graphics, or any other component to create a unique layout. It is also available for immediate download, so you can begin using it right away. Slidegeeks has done good research to ensure that you have everything you need to make your presentation stand out. Make a name out there for a brilliant performance.

Dashboard For Measuring Product Sales Performance Multi Brand Promotion Campaign For Customer Engagement Professional PDF
This slide showcases dashboard that can help organization to measure product sales performance after dual branding campaign. Its key components are sales, sales target, gross profit, sales by channel, inventory days outstanding, sales growth etc From laying roadmaps to briefing everything in detail, our templates are perfect for you. You can set the stage with your presentation slides. All you have to do is download these easy to edit and customizable templates. Dashboard For Measuring Product Sales Performance Multi Brand Promotion Campaign For Customer Engagement Professional PDF will help you deliver an outstanding performance that everyone would remember and praise you for. Do download this presentation today.

Cloud Dashboard For Tracking Project Sprints Integrating Cloud Computing To Enhance Projects Effectiveness Microsoft PDF
The following slide depicts cloud dashboard for monitoring project sprints. It provides information about sprint blockers, resolved issues, under performers, sprint health, releases, sprint burndown, etc. Boost your pitch with our creative Cloud Dashboard For Tracking Project Sprints Integrating Cloud Computing To Enhance Projects Effectiveness Microsoft PDF. Deliver an awe inspiring pitch that will mesmerize everyone. Using these presentation templates you will surely catch everyones attention. You can browse the ppts collection on our website. We have researchers who are experts at creating the right content for the templates. So you do not have to invest time in any additional work. Just grab the template now and use them.

Dashboard For Insider Threat In Cyber Security Cases Management Background PDF
This slide shows insider threat dashboard for managing multiple cases. It provides information such as active and closed, high and low risk cases, status, user, case time, policy alerts, content update, etc. Showcasing this set of slides titled Dashboard For Insider Threat In Cyber Security Cases Management Background PDF. The topics addressed in these templates are Total Policy Alerts, High, Low, Time Case Opened. All the content presented in this PPT design is completely editable. Download it and make adjustments in color, background, font etc. as per your unique business setting.
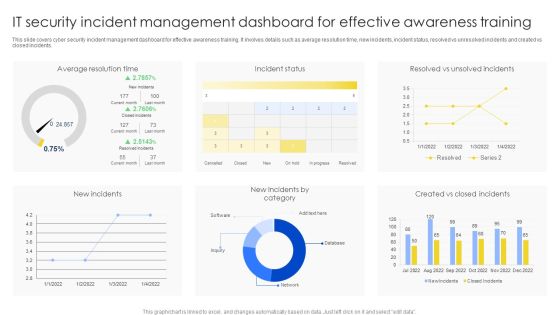
IT Security Incident Management Dashboard For Effective Awareness Training Pictures PDF
This slide covers cyber security incident management dashboard for effective awareness training. It involves details such as average resolution time, new incidents, incident status, resolved vs unresolved incidents and created vs closed incidents. Showcasing this set of slides titled IT Security Incident Management Dashboard For Effective Awareness Training Pictures PDF. The topics addressed in these templates are Average Resolution Time, Incident Status, New Incidents. All the content presented in this PPT design is completely editable. Download it and make adjustments in color, background, font etc. as per your unique business setting.

Transport Management Dashboard For Logistics Company With Fleet Status Ideas PDF
This slide displays KPI dashboard to measure efficiency of transportation management in the company for optimizing its overall delivery time. It includes details about revenue, cost, shipments, profit by country, etc. Showcasing this set of slides titled Transport Management Dashboard For Logistics Company With Fleet Status Ideas PDF. The topics addressed in these templates are Logistics Company, Fleet Status. All the content presented in this PPT design is completely editable. Download it and make adjustments in color, background, font etc. as per your unique business setting.
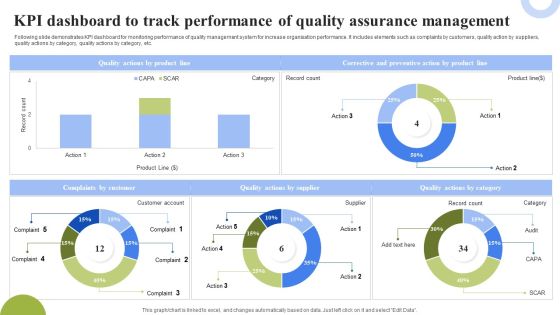
KPI Dashboard To Track Performance Of Quality Assurance Management Topics PDF
Following slide demonstrates KPI dashboard for monitoring performance of quality management system for increase organisation performance. It includes elements such as complaints by customers, quality action by suppliers, quality actions by category, quality actions by category, etc. Showcasing this set of slides titled KPI Dashboard To Track Performance Of Quality Assurance Management Topics PDF. The topics addressed in these templates are Corrective Preventive Action, Quality Actions Supplier, Quality Actions Category. All the content presented in this PPT design is completely editable. Download it and make adjustments in color, background, font etc. as per your unique business setting.

Product Procurement Management Dashboard With Defect Rate Supplier Availability And Lead Time Pictures PDF
This slide shows a dashboard of procurement to provide real time information about various components. It includes defect rate, on time supplies , supplier availability and lead time. Showcasing this set of slides titled Product Procurement Management Dashboard With Defect Rate Supplier Availability And Lead Time Pictures PDF. The topics addressed in these templates are Supplier Defect Rate, Supplier Availability, Lead Time. All the content presented in this PPT design is completely editable. Download it and make adjustments in color, background, font etc. as per your unique business setting.

Change Management Training Calendar Dashboard With Actual And Budgeted Cost Demonstration PDF
This slide showcases KPI dashboard of training program to assess its efficiency and proper functioning. It includes details such as cost, total hours, occupancy rate, etc. Showcasing this set of slides titled Change Management Training Calendar Dashboard With Actual And Budgeted Cost Demonstration PDF. The topics addressed in these templates are Actual, Budget, Cost Per Participant, Cost Per Hour. All the content presented in this PPT design is completely editable. Download it and make adjustments in color, background, font etc. as per your unique business setting.

KPI Dashboard To Track Management Rate Throughout User Lifecycle Portrait PDF
This slide demonstrates KPI dashboard monitoring customer lifecycle to determine progress in customer response rate. It includes elements such as abandonment rate, response rate, engagement rate, response on popular topics and response on non popular topics. Showcasing this set of slides titled KPI Dashboard To Track Management Rate Throughout User Lifecycle Portrait PDF. The topics addressed in these templates are Customer Engagement, Response, Response Rate. All the content presented in this PPT design is completely editable. Download it and make adjustments in color, background, font etc. as per your unique business setting.
Dashboard For Managing Support Ticket Resolution In Customer Services Ideas PDF
The following slide represents dashboard to track tickets in progress, including ones that are pending or overdue in customer support services. It also covers meantime to resolve and support status, number of tickets resolved, monthly analysis of ticket resolved and unresolved etc. Showcasing this set of slides titled Dashboard For Managing Support Ticket Resolution In Customer Services Ideas PDF. The topics addressed in these templates are Resolved Tickets, Ticket Resolved Unresolved, Support Status. All the content presented in this PPT design is completely editable. Download it and make adjustments in color, background, font etc. as per your unique business setting.
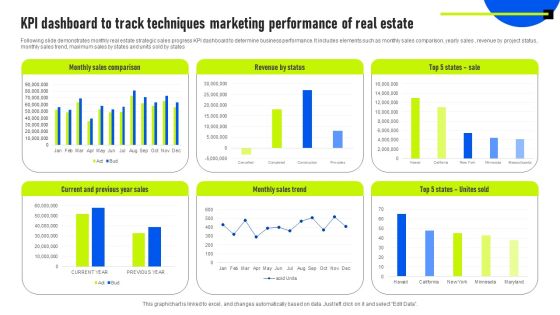
KPI Dashboard To Track Techniques Marketing Performance Of Real Estate Information PDF
Following slide demonstrates monthly real estate strategic sales progress KPI dashboard to determine business performance. It includes elements such as monthly sales comparison, yearly sales , revenue by project status, monthly sales trend, maximum sales by states and units sold by states. Showcasing this set of slides titled KPI Dashboard To Track Techniques Marketing Performance Of Real Estate Information PDF. The topics addressed in these templates are Revenue By Status, Monthly Sales Comparison, Monthly Sales Trend. All the content presented in this PPT design is completely editable. Download it and make adjustments in color, background, font etc. as per your unique business setting.

Customer Journey Enhancement Playbook Customer Success KPI Dashboard To Measure Portrait PDF
Mentioned slide showcases customer success dashboard that company is currently using to measure its support team performance. KPIs covered in the dashboard are health score, retention cost, churn rate etc. Slidegeeks is here to make your presentations a breeze with Customer Journey Enhancement Playbook Customer Success KPI Dashboard To Measure Portrait PDF With our easy-to-use and customizable templates, you can focus on delivering your ideas rather than worrying about formatting. With a variety of designs to choose from, youre sure to find one that suits your needs. And with animations and unique photos, illustrations, and fonts, you can make your presentation pop. So whether youre giving a sales pitch or presenting to the board, make sure to check out Slidegeeks first.
Loyalty Program Performance Tracking Dashboard Consumer Contact Point Guide Demonstration PDF
This slide covers the KPI dashboard for analyzing customer loyalty campaign results. It includes metrics such as revenue, liability, NQP accrued, transaction count, members, redemption ratio, etc. Find a pre-designed and impeccable Loyalty Program Performance Tracking Dashboard Consumer Contact Point Guide Demonstration PDF. The templates can ace your presentation without additional effort. You can download these easy-to-edit presentation templates to make your presentation stand out from others. So, what are you waiting for Download the template from Slidegeeks today and give a unique touch to your presentation.

Digital And Offline Marketing Campaign Comparison Dashboard Ppt Inspiration Microsoft PDF
This slide showcases analysis of offline and online marketing in a dashboard covering key metrics. Performance indicators involved are purchases, free trial pay up rate and sign ups and monthly visitors. Pitch your topic with ease and precision using this Digital And Offline Marketing Campaign Comparison Dashboard Ppt Inspiration Microsoft PDF. This layout presents information on Online Marketing, Offline Marketing, Free Trial Sign, UPS. It is also available for immediate download and adjustment. So, changes can be made in the color, design, graphics or any other component to create a unique layout.

Comprehensive Guide To Strengthen Brand Equity Brand Awareness Measuring KPI Dashboard Rules PDF
Following slide illustrates KPI dashboard that can be used to track the awareness level of a specific brand. KPIs covered in the slide are traffic, attention, authority, inbound channel performance etc. Are you searching for a Comprehensive Guide To Strengthen Brand Equity Brand Awareness Measuring KPI Dashboard Rules PDF that is uncluttered, straightforward, and original Its easy to edit, and you can change the colors to suit your personal or business branding. For a presentation that expresses how much effort you have put in, this template is ideal With all of its features, including tables, diagrams, statistics, and lists, its perfect for a business plan presentation. Make your ideas more appealing with these professional slides. Download Comprehensive Guide To Strengthen Brand Equity Brand Awareness Measuring KPI Dashboard Rules PDF from Slidegeeks today.
New Product Launch To Market Playbook Product Launch Activities Tracking Dashboard Graphics PDF
This slide provides information regarding product launch activities tracking dashboard in terms of project budget, projected launch date, overdue tasks, workload, risks, etc. Get a simple yet stunning designed New Product Launch To Market Playbook Product Launch Activities Tracking Dashboard Graphics PDF. It is the best one to establish the tone in your meetings. It is an excellent way to make your presentations highly effective. So, download this PPT today from Slidegeeks and see the positive impacts. Our easy to edit New Product Launch To Market Playbook Product Launch Activities Tracking Dashboard Graphics PDF can be your go to option for all upcoming conferences and meetings. So, what are you waiting for Grab this template today.
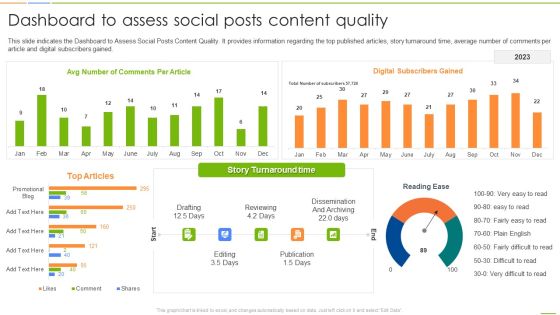
Social Media Channels Auditing Dashboard To Assess Social Posts Content Quality Sample PDF
This slide indicates the Dashboard to Assess Social Posts Content Quality. It provides information regarding the top published articles, story turnaround time, average number of comments per article and digital subscribers gained. Get a simple yet stunning designed Social Media Channels Auditing Dashboard To Assess Social Posts Content Quality Sample PDF. It is the best one to establish the tone in your meetings. It is an excellent way to make your presentations highly effective. So, download this PPT today from Slidegeeks and see the positive impacts. Our easy-to-edit Social Media Channels Auditing Dashboard To Assess Social Posts Content Quality Sample PDF can be your go-to option for all upcoming conferences and meetings. So, what are you waiting for Grab this template today.

Brand Personality Improvement To Increase Profits Customer Tracking Dashboard To Monitor Brand Themes PDF
This slide provides information brand loyalty tracking dashboard in order to monitor customer engagement, average revenues, new vs. returning visitors performance, etc. Get a simple yet stunning designed Brand Personality Improvement To Increase Profits Customer Tracking Dashboard To Monitor Brand Themes PDF. It is the best one to establish the tone in your meetings. It is an excellent way to make your presentations highly effective. So, download this PPT today from Slidegeeks and see the positive impacts. Our easy to edit Brand Personality Improvement To Increase Profits Customer Tracking Dashboard To Monitor Brand Themes PDF can be your go to option for all upcoming conferences and meetings. So, what are you waiting for Grab this template today.
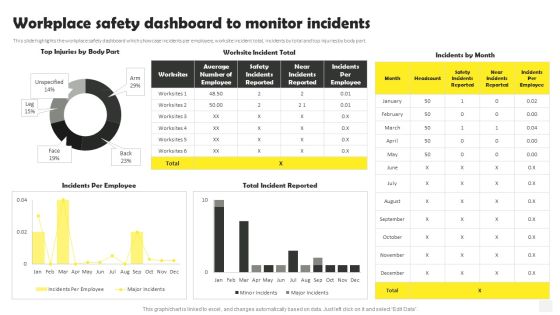
Occupational Health And Safety At Workplace Workplace Safety Dashboard To Monitor Incidents Inspiration PDF
This slide highlights the workplace safety dashboard which showcase incidents per employee, worksite incident total, incidents by total and top injuries by body part. Get a simple yet stunning designed Occupational Health And Safety At Workplace Workplace Safety Dashboard To Monitor Incidents Inspiration PDF. It is the best one to establish the tone in your meetings. It is an excellent way to make your presentations highly effective. So, download this PPT today from Slidegeeks and see the positive impacts. Our easy to edit Occupational Health And Safety At Workplace Workplace Safety Dashboard To Monitor Incidents Inspiration PDF can be your go to option for all upcoming conferences and meetings. So, what are you waiting for Grab this template today.
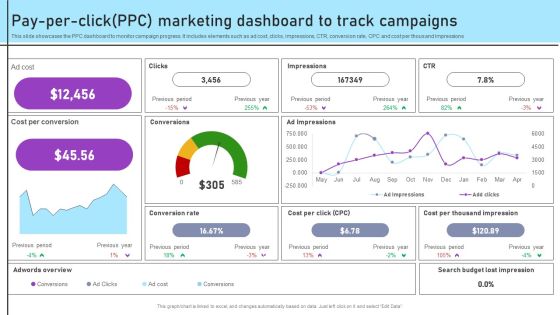
Inbound And Outbound Marketing Tactics Pay Per Click Ppc Marketing Dashboard Topics PDF
This slide showcases the PPC dashboard to monitor campaign progress. It includes elements such as ad cost, clicks, impressions, CTR, conversion rate, CPC and cost per thousand impressions. Get a simple yet stunning designed Inbound And Outbound Marketing Tactics Pay Per Click Ppc Marketing Dashboard Topics PDF. It is the best one to establish the tone in your meetings. It is an excellent way to make your presentations highly effective. So, download this PPT today from Slidegeeks and see the positive impacts. Our easy to edit Inbound And Outbound Marketing Tactics Pay Per Click Ppc Marketing Dashboard Topics PDF can be your go to option for all upcoming conferences and meetings. So, what are you waiting for Grab this template today.
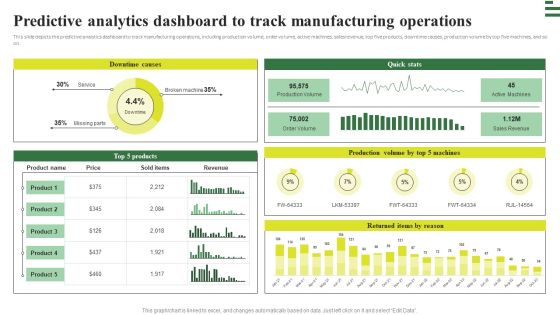
Transforming Manufacturing With Automation Predictive Analytics Dashboard To Track Diagrams PDF
This slide depicts the predictive analytics dashboard to track manufacturing operations, including production volume, order volume, active machines, sales revenue, top five products, downtime causes, production volume by top five machines, and so on. Get a simple yet stunning designed Transforming Manufacturing With Automation Predictive Analytics Dashboard To Track Diagrams PDF. It is the best one to establish the tone in your meetings. It is an excellent way to make your presentations highly effective. So, download this PPT today from Slidegeeks and see the positive impacts. Our easy to edit Transforming Manufacturing With Automation Predictive Analytics Dashboard To Track Diagrams PDF can be your go to option for all upcoming conferences and meetings. So, what are you waiting for Grab this template today.

Sales Performance Monitoring Dashboard With Customer Details Ppt Infographics Themes PDF
This slide illustrates sales performance tracking dashboard with critical information. It provides information about customer details, invoice, earnings, leads, pending delivery, revenue, etc. Pitch your topic with ease and precision using this Sales Performance Monitoring Dashboard With Customer Details Ppt Infographics Themes PDF. This layout presents information on Todays Revenue, Today Delivered, Pending Delivery, Total Leads. It is also available for immediate download and adjustment. So, changes can be made in the color, design, graphics or any other component to create a unique layout.

Operational Innovation In Banking Banking Operation Strategy Dashboard Highlighting Inspiration PDF
This slide highlights the banking operation strategy which includes accounts opened and closed, total deposit vs branch goal, accounts by type, expense to budget and referrals by product. Create an editable Operational Innovation In Banking Banking Operation Strategy Dashboard Highlighting Inspiration PDF that communicates your idea and engages your audience. Whether youre presenting a business or an educational presentation, pre-designed presentation templates help save time. Operational Innovation In Banking Banking Operation Strategy Dashboard Highlighting Inspiration PDF is highly customizable and very easy to edit, covering many different styles from creative to business presentations. Slidegeeks has creative team members who have crafted amazing templates. So, go and get them without any delay.

Corporate Social Responsibility Dashboard With Number Of Projects Undertaken Infographics PDF
Showcasing this set of slides titled corporate social responsibility dashboard with number of projects undertaken infographics pdf. The topics addressed in these templates are people, finances, environment, health and safety . All the content presented in this PPT design is completely editable. Download it and make adjustments in color, background, font etc. as per your unique business setting.
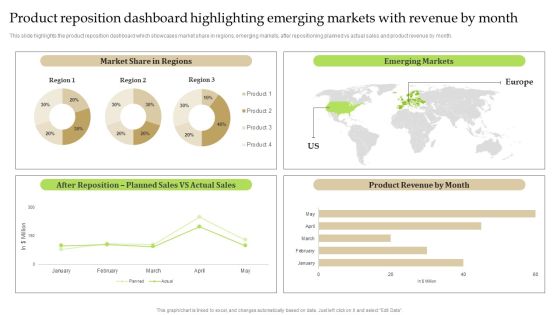
Product Reposition Dashboard Highlighting Emerging Markets With Revenue By Month Brochure PDF
This slide highlights the product reposition dashboard which showcases market share in regions, emerging markets, after repositioning planned vs actual sales and product revenue by month. Are you searching for a Product Reposition Dashboard Highlighting Emerging Markets With Revenue By Month Brochure PDF that is uncluttered, straightforward, and original Its easy to edit, and you can change the colors to suit your personal or business branding. For a presentation that expresses how much effort you have put in, this template is ideal. With all of its features, including tables, diagrams, statistics, and lists, its perfect for a business plan presentation. Make your ideas more appealing with these professional slides. Download Product Reposition Dashboard Highlighting Emerging Markets With Revenue By Month Brochure PDF from Slidegeeks today.

Successful Risk Administration KPI Dashboard To Track Effectiveness Of Real Estate Business Template PDF
The following slide exhibits key performance indicator KPI dashboard which can be used to measure the financial performance of the real estate company. It covers various kpis such as sales vs target per agent, top 10 projects, top 5 agencies etc. If your project calls for a presentation, then Slidegeeks is your go-to partner because we have professionally designed, easy-to-edit templates that are perfect for any presentation. After downloading, you can easily edit Successful Risk Administration KPI Dashboard To Track Effectiveness Of Real Estate Business Template PDF and make the changes accordingly. You can rearrange slides or fill them with different images. Check out all the handy templates.
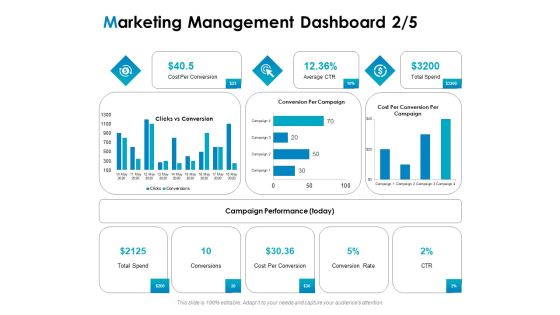
Strategic Marketing Plan Marketing Management Dashboard Cost Ppt PowerPoint Presentation Infographics Slides PDF
Deliver an awe-inspiring pitch with this creative strategic marketing plan marketing management dashboard cost ppt powerpoint presentation infographics slides pdf bundle. Topics like cost per conversion, campaign performance, conversion rate, conversions, total speed, average ctr can be discussed with this completely editable template. It is available for immediate download depending on the needs and requirements of the user.
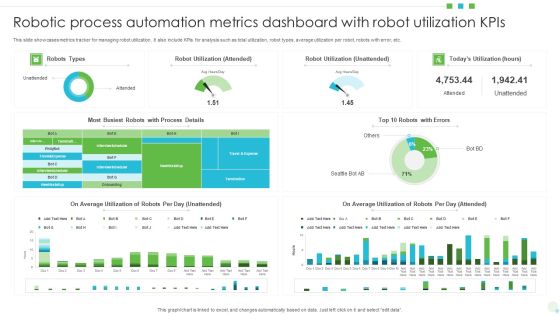
Robotic Process Automation Metrics Dashboard With Robot Utilization Kpis Background PDF
This slide showcases metrics tracker for managing robot utilization. It also include KPIs for analysis such as total utilization, robot types, average utilization per robot, robots with error, etc. Pitch your topic with ease and precision using this Robotic Process Automation Metrics Dashboard With Robot Utilization Kpis Background PDF. This layout presents information on Average Utilization, Robot Utilization, Automation Metrics Dashboard. It is also available for immediate download and adjustment. So, changes can be made in the color, design, graphics or any other component to create a unique layout.

Effective Brand Reputation Management Brand Equity Performance Assessment Dashboard Slides PDF
This slide provides information regarding brand equity performance assessment dashboard that highlights customer lifecycle value, customer adoption rate, mentions, engagement, etc. If your project calls for a presentation, then Slidegeeks is your go-to partner because we have professionally designed, easy-to-edit templates that are perfect for any presentation. After downloading, you can easily edit Effective Brand Reputation Management Brand Equity Performance Assessment Dashboard Slides PDF and make the changes accordingly. You can rearrange slides or fill them with different images. Check out all the handy templates.
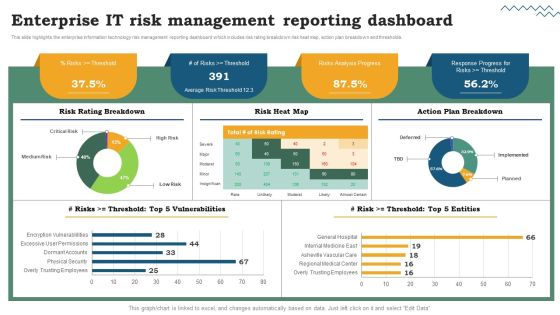
Risk Evaluation Of Information Technology Systems Enterprise IT Risk Management Reporting Dashboard Formats PDF
This slide highlights the enterprise information technology risk management reporting dashboard which includes risk rating breakdown risk heat map, action plan breakdown and thresholds. From laying roadmaps to briefing everything in detail, our templates are perfect for you. You can set the stage with your presentation slides. All you have to do is download these easy-to-edit and customizable templates. Risk Evaluation Of Information Technology Systems Enterprise IT Risk Management Reporting Dashboard Formats PDF will help you deliver an outstanding performance that everyone would remember and praise you for. Do download this presentation today.

KPI Dashboard To Monitor Workforce Diversity Data And Inclusion Of IT Firm Slides PDF
Following slide demonstrates KPI dashboard to track diversity and inclusion which can be used by managers to develop workforce for business . It includes elements such as hiring data diversity, performance rating, promotion rate, promotion percentage, employee turnover, top management gender diversity, etc. Showcasing this set of slides titled KPI Dashboard To Monitor Workforce Diversity Data And Inclusion Of IT Firm Slides PDF. The topics addressed in these templates are Employee Turnover, Management, Promotion Rate. All the content presented in this PPT design is completely editable. Download it and make adjustments in color, background, font etc. as per your unique business setting.

Strategies For Effective Product Metric Dashboard To Track Product Success Elements PDF
This slide represents dashboard for tracking product success. It covers new customer, total sessions, purchase, total inquires, total crashes etc. Explore a selection of the finest Strategies For Effective Product Metric Dashboard To Track Product Success Elements PDF here. With a plethora of professionally designed and pre-made slide templates, you can quickly and easily find the right one for your upcoming presentation. You can use our Strategies For Effective Product Metric Dashboard To Track Product Success Elements PDF to effectively convey your message to a wider audience. Slidegeeks has done a lot of research before preparing these presentation templates. The content can be personalized and the slides are highly editable. Grab templates today from Slidegeeks.
Performance Tracking Dashboard For 5G Architecture 5G Network Structure Diagrams PDF
This slide describes the performance tracking dashboard for 5G architecture by covering the details of subscribers, quality of experience, consumption, customer support, coverage, devices, and dimensions.Explore a selection of the finest Performance Tracking Dashboard For 5G Architecture 5G Network Structure Diagrams PDF here. With a plethora of professionally designed and pre-made slide templates, you can quickly and easily find the right one for your upcoming presentation. You can use our Performance Tracking Dashboard For 5G Architecture 5G Network Structure Diagrams PDF to effectively convey your message to a wider audience. Slidegeeks has done a lot of research before preparing these presentation templates. The content can be personalized and the slides are highly editable. Grab templates today from Slidegeeks.

Customer Goods Production Manufacturing Company Production Dashboard With Active Slides PDF
This slide highlights the manufacturing company production dashboard which showcases production rate, lost units with causes, productivity by machine, operations available and overall productivity. Explore a selection of the finest Customer Goods Production Manufacturing Company Production Dashboard With Active Slides PDF here. With a plethora of professionally designed and pre-made slide templates, you can quickly and easily find the right one for your upcoming presentation. You can use our Customer Goods Production Manufacturing Company Production Dashboard With Active Slides PDF to effectively convey your message to a wider audience. Slidegeeks has done a lot of research before preparing these presentation templates. The content can be personalized and the slides are highly editable. Grab templates today from Slidegeeks.
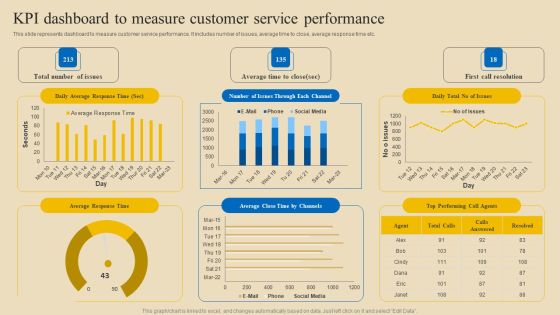
Implementing Digital Customer Service Kpi Dashboard To Measure Customer Service Structure PDF
This slide represents dashboard to measure customer service performance. It includes number of issues, average time to close, average response time etc. Explore a selection of the finest Implementing Digital Customer Service Kpi Dashboard To Measure Customer Service Structure PDF here. With a plethora of professionally designed and pre-made slide templates, you can quickly and easily find the right one for your upcoming presentation. You can use our Implementing Digital Customer Service Kpi Dashboard To Measure Customer Service Structure PDF to effectively convey your message to a wider audience. Slidegeeks has done a lot of research before preparing these presentation templates. The content can be personalized and the slides are highly editable. Grab templates today from Slidegeeks.

Operational Strategy For ML In IT Sector Customer Service Dashboard Through AI Topics PDF
The following slide highlights the customer service dashboard that shows the use of AI in customer satisfaction. Explore a selection of the finest Operational Strategy For ML In IT Sector Customer Service Dashboard Through AI Topics PDF here. With a plethora of professionally designed and pre-made slide templates, you can quickly and easily find the right one for your upcoming presentation. You can use our Operational Strategy For ML In IT Sector Customer Service Dashboard Through AI Topics PDF to effectively convey your message to a wider audience. Slidegeeks has done a lot of research before preparing these presentation templates. The content can be personalized and the slides are highly editable. Grab templates today from Slidegeeks.
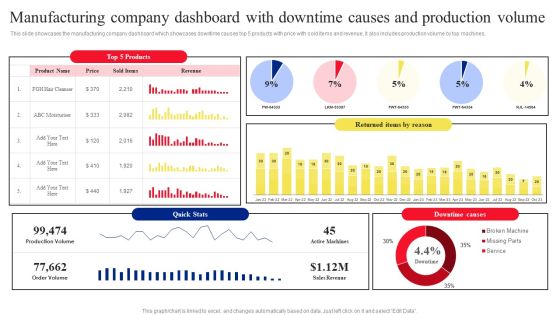
Manufacturing Company Dashboard With Downtime Causes And Production Volume Microsoft PDF
This slide showcases the manufacturing company dashboard which showcases downtime causes top 5 products with price with sold items and revenue, it also includes production volume by top machines. Explore a selection of the finest Manufacturing Company Dashboard With Downtime Causes And Production Volume Microsoft PDF here. With a plethora of professionally designed and pre made slide templates, you can quickly and easily find the right one for your upcoming presentation. You can use our Manufacturing Company Dashboard With Downtime Causes And Production Volume Microsoft PDF to effectively convey your message to a wider audience. Slidegeeks has done a lot of research before preparing these presentation templates. The content can be personalized and the slides are highly editable. Grab templates today from Slidegeeks.
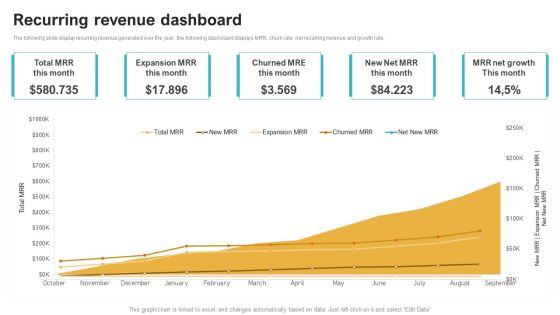
Saas Continuous Income Generation Model For Software Startup Recurring Revenue Dashboard Demonstration PDF
The following slide display recurring revenue generated over the year, the following dashboard displays MRR, churn rate net recurring revenue and growth rate. Explore a selection of the finest Saas Continuous Income Generation Model For Software Startup Recurring Revenue Dashboard Demonstration PDF here. With a plethora of professionally designed and pre made slide templates, you can quickly and easily find the right one for your upcoming presentation. You can use our Saas Continuous Income Generation Model For Software Startup Recurring Revenue Dashboard Demonstration PDF to effectively convey your message to a wider audience. Slidegeeks has done a lot of research before preparing these presentation templates. The content can be personalized and the slides are highly editable. Grab templates today from Slidegeeks.

Implementing Lean Production Tool And Techniques Lean Manufacturing Dashboard Showcasing Infographics PDF
This slide represents lean manufacturing dashboard showcasing production progress. It covers production volume, order volume, downtime, returned item etc. Explore a selection of the finest Implementing Lean Production Tool And Techniques Lean Manufacturing Dashboard Showcasing Infographics PDF here. With a plethora of professionally designed and pre made slide templates, you can quickly and easily find the right one for your upcoming presentation. You can use our Implementing Lean Production Tool And Techniques Lean Manufacturing Dashboard Showcasing Infographics PDF to effectively convey your message to a wider audience. Slidegeeks has done a lot of research before preparing these presentation templates. The content can be personalized and the slides are highly editable. Grab templates today from Slidegeeks.
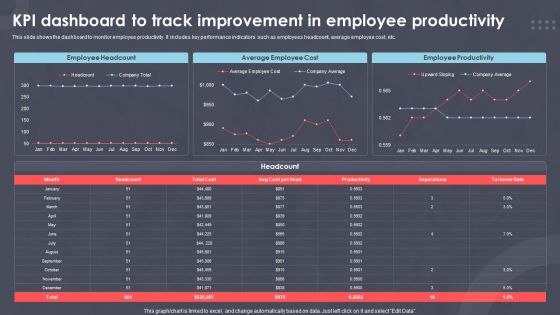
Kpi Dashboard To Track Improvement In Employee Productivity Ppt PowerPoint Presentation Outline Samples PDF
This slide shows the dashboard to monitor employee productivity. It includes key performance indicators such as employees headcount, average employee cost, etc.Showcasing this set of slides titled XXXXXXXXX. The topics addressed in these templates are Employee Headcount, Average Employee, Employee Productivity. All the content presented in this PPT design is completely editable. Download it and make adjustments in color, background, font etc. as per your unique business setting.

Service Level Agreement Management Dashboard Indicating Customer Satisfaction Status Designs PDF
Pitch your topic with ease and precision using this service level agreement management dashboard indicating customer satisfaction status designs pdf. This layout presents information on customer satisfaction, service level management, contracts by manufacturer. It is also available for immediate download and adjustment. So, changes can be made in the color, design, graphics or any other component to create a unique layout.

Dashboard Highlighting Internal Hiring Sources And Costs Ppt Show Templates PDF
This slide illustrates dashboard for recruiting employees internally. It provides information about sourcing status, yield ratio, hiring pipeline, positions filled, recruitment costs, hire cost per team, etc. Showcasing this set of slides titled Dashboard Highlighting Internal Hiring Sources And Costs Ppt Show Templates PDF. The topics addressed in these templates are Hiring Pipeline, Sourcing Status, Recruitment Costs. All the content presented in this PPT design is completely editable. Download it and make adjustments in color, background, font etc. as per your unique business setting.

Automobile Company Actual And Forecasted Monthly Sales Dashboard Ppt Infographic Template Aids PDF
This slide shows the dashboard for forecasting the sales of an automobile company for the current month. It represents details related to revenue by pipeline, new deals, sales forecast, revenue goal attainment by owner for the current month and pipeline coverage by next month. Showcasing this set of slides titled Automobile Company Actual And Forecasted Monthly Sales Dashboard Ppt Infographic Template Aids PDF. The topics addressed in these templates are Forecast Month, Revenue Goal Attainment, Revenue Goal Attainment. All the content presented in this PPT design is completely editable. Download it and make adjustments in color, background, font etc. as per your unique business setting.

Global Products Customer Segmentation Dashboard With Descriptions Ppt Styles Template PDF
This slide represents a dashboard showing the customer segmentation for an international product. It shows details related to total customers in each segments, segments description, characteristics and search customers by ID. Showcasing this set of slides titled Global Products Customer Segmentation Dashboard With Descriptions Ppt Styles Template PDF. The topics addressed in these templates are Total Customer, Each Segments, Segments Description, Search Customers. All the content presented in this PPT design is completely editable. Download it and make adjustments in color, background, font etc. as per your unique business setting.

Dashboard To Track Project Essential Activities Project Administration Plan Playbook Elements PDF
This slide provides information about dashboard to track project essential activities by tracking project KPIs in terms of schedule, budget, resources, risk issues, quality, etc. Present like a pro with Dashboard To Track Project Essential Activities Project Administration Plan Playbook Elements PDF Create beautiful presentations together with your team, using our easy-to-use presentation slides. Share your ideas in real-time and make changes on the fly by downloading our templates. So whether you are in the office, on the go, or in a remote location, you can stay in sync with your team and present your ideas with confidence. With Slidegeeks presentation got a whole lot easier. Grab these presentations today.

Engineering Performance Metrics Dashboard To Track Cloud Services Cost Clipart PDF
This slide covers engineering KPI dashboard to track cost of cloud services. It involves KPIs such as average delay of product, cost of cloud services, pageview by browser and pull requests by projects. Showcasing this set of slides titled Engineering Performance Metrics Dashboard To Track Cloud Services Cost Clipart PDF. The topics addressed in these templates are Cost Of Cloud Services, Average, Product. All the content presented in this PPT design is completely editable. Download it and make adjustments in color, background, font etc. as per your unique business setting.
 Home
Home