Executive Summary Dashboard

Project Metrics Dashboard With Monthly Workload Topics PDF
This slide shows the project management dashboard which covers the number of tasks completed in last one week, return on investment on overall project, milestones covered, performance of employees, tasks created, competed, work in progress, started, etc. Pitch your topic with ease and precision using this Project Metrics Dashboard With Monthly Workload Topics PDF. This layout presents information on Investment, Employee Performance, Project Metrics Dashboard. It is also available for immediate download and adjustment. So, changes can be made in the color, design, graphics or any other component to create a unique layout.
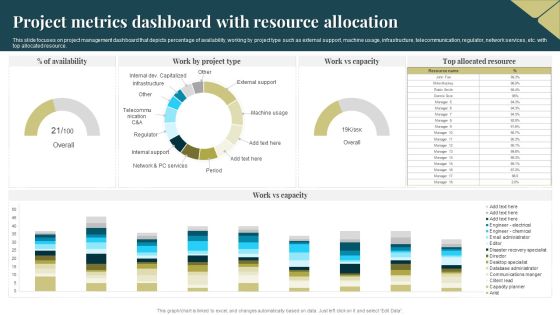
Project Metrics Dashboard With Resource Allocation Portrait PDF
This slide focuses on project management dashboard that depicts percentage of availability, working by project type such as external support, machine usage, infrastructure, telecommunication, regulator, network services, etc. with top allocated resource. Pitch your topic with ease and precision using this Project Metrics Dashboard With Resource Allocation Portrait PDF. This layout presents information on Project Metrics Dashboard, Resource Allocation. It is also available for immediate download and adjustment. So, changes can be made in the color, design, graphics or any other component to create a unique layout.

Crm Dashboard Leads By Source Ppt PowerPoint Presentation Slides
This is a crm dashboard leads by source ppt powerpoint presentation slides. This is a four stage process. The stages in this process are online site, exhibition, email campaign, advertisement.

Crm Dashboard Pipeline By Sales Stage Ppt PowerPoint Presentation Show
This is a crm dashboard pipeline by sales stage ppt powerpoint presentation show. This is a five stage process. The stages in this process are total, quality, develop, propose, close.
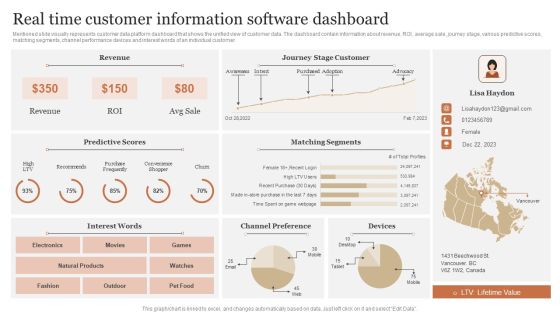
Real Time Customer Information Software Dashboard Portrait PDF
Mentioned slide visually represents customer data platform dashboard that shows the unified view of customer data. The dashboard contain information about revenue, ROI, average sale, journey stage, various predictive scores, matching segments, channel performance devices and interest words of an individual customer. Showcasing this set of slides titled Real Time Customer Information Software Dashboard Portrait PDF. The topics addressed in these templates are Predictive Scores, Matching Segments, Channel Preference. All the content presented in this PPT design is completely editable. Download it and make adjustments in color, background, font etc. as per your unique business setting.

Portfolio Management Securities Allocation Dashboard Ppt PowerPoint Presentation Infographics Examples
This is a portfolio management securities allocation dashboard ppt powerpoint presentation infographics examples. The topics discussed in this diagram are finance, marketing, management, investment, analysis. This is a completely editable PowerPoint presentation, and is available for immediate download.

Debt Recovery And Funds Recovery Dashboard Structure PDF
This slide illustrates debt collection and funds recovery dashboard which includes todays contacts, past collectionweeks todays collection by operator and regular collected funds data. It can help businesses in streamlining the process of bad debts recovery.Showcasing this set of slides titled Debt Recovery And Funds Recovery Dashboard Structure PDF The topics addressed in these templates are Debt Recovery, Funds Recovery Dashboard All the content presented in this PPT design is completely editable. Download it and make adjustments in color, background, font etc. as per your unique business setting.

KPI Metrics And Dashboard Ppt PowerPoint Presentation Inspiration Format Ideas
This is a kpi metrics and dashboard ppt powerpoint presentation inspiration format ideas. This is a three stage process. The stages in this process are business, planning, strategy, marketing, management.
Project Management Dashboard Testing Ppt PowerPoint Presentation Icon File Formats
This is a project management dashboard testing ppt powerpoint presentation icon file formats. This is a three stage process. The stages in this process are business, management, marketing, percentage.
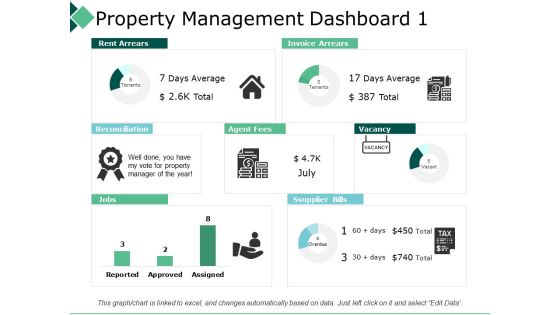
Property Management Dashboard 1 Reconciliation Ppt PowerPoint Presentation Professional Visuals
This is a property management dashboard 1 reconciliation ppt powerpoint presentation professional visuals. This is a three stage process. The stages in this process are business, management, strategy, analysis, icon.
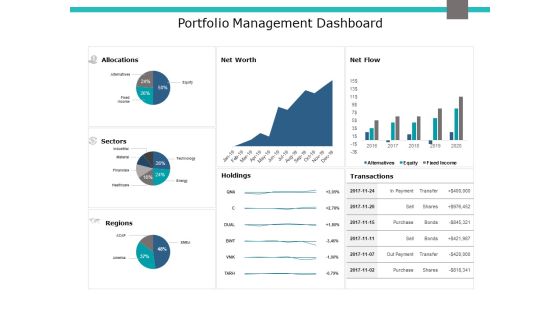
Portfolio Management Dashboard Ppt PowerPoint Presentation Gallery Example Introduction
This is a portfolio management dashboard ppt powerpoint presentation gallery example introduction. This is a three stage process. The stages in this process are area chart, finance, marketing, management, investment.

Portfolio Management Securities Allocation Dashboard Ppt PowerPoint Presentation Pictures Objects
This is a portfolio management securities allocation dashboard ppt powerpoint presentation pictures objects. This is a five stage process. The stages in this process are finance, marketing, management, investment.

Marketing Management Dashboard Business Ppt PowerPoint Presentation Show Format
This is a marketing management dashboard business ppt powerpoint presentation show format. This is a four stage process. The stages in this process are finance, marketing, management, investment, analysis.

Marketing Management Dashboard Marketing Ppt PowerPoint Presentation Slides Graphics
This is a marketing management dashboard marketing ppt powerpoint presentation slides graphics. This is a three stage process. The stages in this process are finance, marketing, management, investment, analysis.
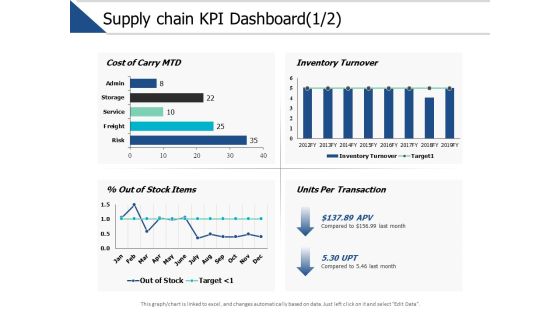
Supply Chain Kpi Dashboard Management Ppt PowerPoint Presentation Model Picture
This is a supply chain kpi dashboard management ppt powerpoint presentation model picture. This is a three stage process. The stages in this process are finance, marketing, management, investment, analysis.

Property Leasing Dashboard Depicting Sale And Rent Analysis Diagrams PDF
This slide shows real estate leasing dashboard depicting sale and rent analysis which can be referred by property managers to manage various listing. It includes information about monthly stats of rent and sales, total proceeds, monthly target, rental properties, etc.Showcasing this set of slides titled property leasing dashboard depicting sale and rent analysis diagrams pdf The topics addressed in these templates are property leasing dashboard depicting sale and rent analysis All the content presented in this PPT design is completely editable. Download it and make adjustments in color, background, font etc. as per your unique business setting.
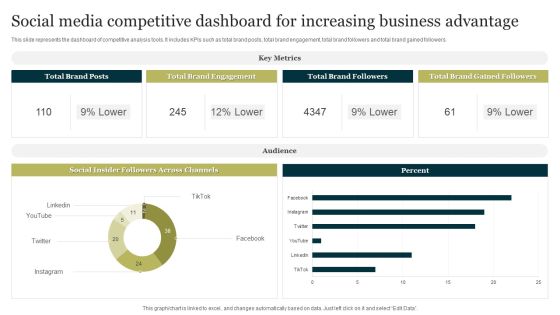
Social Media Competitive Dashboard For Increasing Business Advantage Portrait PDF
This slide represents the dashboard of competitive analysis tools. It includes KPIs such as total brand posts, total brand engagement, total brand followers and total brand gained followers. Pitch your topic with ease and precision using this Social Media Competitive Dashboard For Increasing Business Advantage Portrait PDF. This layout presents information on Social Media Competitive Dashboard, Increasing Business Advantage. It is also available for immediate download and adjustment. So, changes can be made in the color, design, graphics or any other component to create a unique layout.

Engineering Performance Metrics Dashboard To Track Pull Requests Background PDF
This slide covers engineering KPI dashboard to track pull request. It involves KPIs such as open time of average pull requests, average comment received, revision rounds, frequency of posting pull requests. Pitch your topic with ease and precision using this Engineering Performance Metrics Dashboard To Track Pull Requests Background PDF. This layout presents information on Dashboard Track Pull Requests, Engineering Performance Metrics. It is also available for immediate download and adjustment. So, changes can be made in the color, design, graphics or any other component to create a unique layout.

Batch Processing KPI Metrics Dashboard With Rejection Rate Topics PDF
Mentioned slide highlights performance KPI dashboard of batch processing system. The KPIs covered in the slide are batch rejection rate by product, number of reprocessed lots, rejection by product and reasons for the rejection. Pitch your topic with ease and precision using this Batch Processing KPI Metrics Dashboard With Rejection Rate Topics PDF. This layout presents information on Batch Processing KPI Metrics, Dashboard Rejection Rate. It is also available for immediate download and adjustment. So, changes can be made in the color, design, graphics or any other component to create a unique layout.
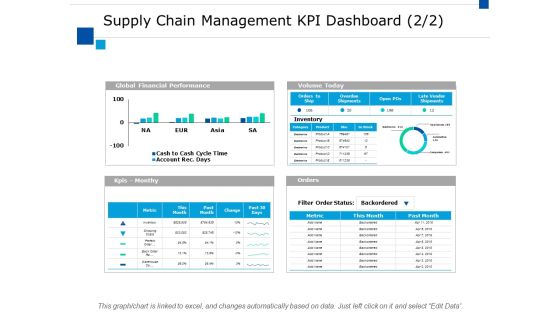
Supply Chain Management Kpi Dashboard Ppt PowerPoint Presentation File Slides
This is a supply chain management kpi dashboard ppt powerpoint presentation file slides. This is a four stage process. The stages in this process are finance, marketing, analysis, investment, million.
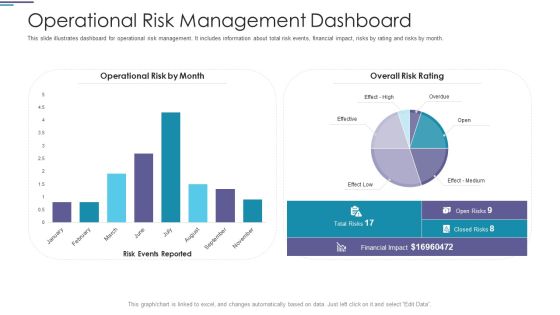
Operational Risk Management Dashboard Ppt PowerPoint Presentation Styles Pictures PDF
This slide illustrates dashboard for operational risk management. It includes information about total risk events, financial impact, risks by rating and risks by month.Deliver an awe-inspiring pitch with this creative operational risk management dashboard ppt powerpoint presentation styles pictures pdf. bundle. Topics like financial impact, operational risk by month, overall risk rating can be discussed with this completely editable template. It is available for immediate download depending on the needs and requirements of the user.
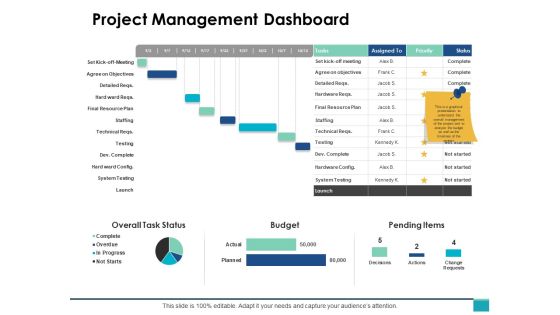
Project Management Dashboard Ppt PowerPoint Presentation Gallery Portrait
This is a project management dashboard ppt powerpoint presentation gallery portrait. The topics discussed in this diagram are finance, marketing, management, investment, analysis. This is a completely editable PowerPoint presentation, and is available for immediate download.

Dashboard For Tracking Green Financing Activities Themes PDF
This slide presents a finance dashboard to track the progress of sustainability activities based on finance allocations. The key performing indicators are overall progress, energy usage by month, budget allocation and application etc. Showcasing this set of slides titled Dashboard For Tracking Green Financing Activities Themes PDF. The topics addressed in these templates are Activities, Application, Dashboard. All the content presented in this PPT design is completely editable. Download it and make adjustments in color, background, font etc. as per your unique business setting.

Crm Dashboard Top Customers Ppt PowerPoint Presentation Graphics
This is a crm dashboard top customers ppt powerpoint presentation graphics. This is a ten stage process. The stages in this process are top customers, business, marketing, process, management.
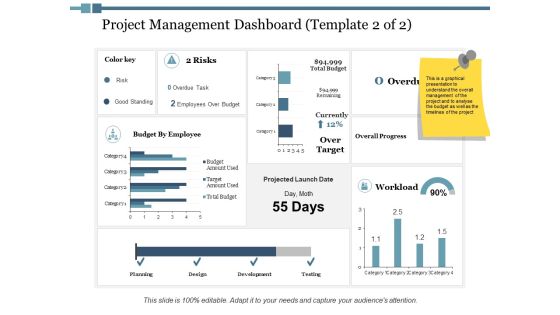
Project Management Dashboard Workload Ppt PowerPoint Presentation Inspiration Show
This is a project management dashboard workload ppt powerpoint presentation inspiration show. This is a four stage process. The stages in this process are finance, marketing, management, investment, analysis.

Change Management Performance Dashboard Ppt PowerPoint Presentation Professional Slides
This is a change management performance dashboard ppt powerpoint presentation professional slides. This is a three stage process. The stages in this process are finance, marketing, management, investment, analysis.

Project Management Monthly Growth Dashboard Ppt PowerPoint Presentation Pictures Guide
This is a project management monthly growth dashboard ppt powerpoint presentation pictures guide. This is a four stage process. The stages in this process are finance, marketing, management, investment, analysis.

Crm Dashboard Project Management Ppt PowerPoint Presentation Show
This is a crm dashboard project management ppt powerpoint presentation show. This is a two stage process. The stages in this process are total projects, projects on hold, overdue projects, available resources, schedule.

Project Management Dashboard Ppt PowerPoint Presentation Portfolio Portrait
This is a project management dashboard ppt powerpoint presentation portfolio portrait. This is a five stage process. The stages in this process are overall task status, assigned to, budget, pending items, business.

Project Management Dashboard Ppt PowerPoint Presentation Portfolio Objects
This is a project management dashboard ppt powerpoint presentation portfolio objects. This is a three stage process. The stages in this process are complete, overdue, overall task status, budget, pending items.
Project Management Dashboard Finance Ppt PowerPoint Presentation Styles Icons
This is a project management dashboard finance ppt powerpoint presentation styles icons. This is a three stage process. The stages in this process are finance, analysis, business, investment, marketing.

Crm Dashboard Opportunity By Rating Ppt PowerPoint Presentation Backgrounds
This is a crm dashboard opportunity by rating ppt powerpoint presentation backgrounds. This is a three stage process. The stages in this process are open opportunity, count all opportunity, rating.
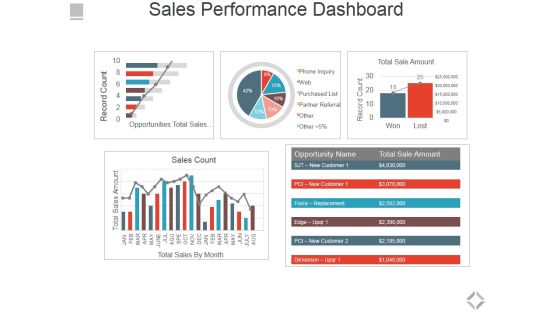
Sales Performance Dashboard Ppt PowerPoint Presentation File Graphics Pictures
This is a sales performance dashboard ppt powerpoint presentation file graphics pictures. This is a five stage process. The stages in this process are total sales by month, sales count, opportunities total sales by probability, total sale amount.

Business Intelligence Dashboard To Review Employee Performance Pictures PDF
The following slide showcases BI dashboard to drill down major aspects of personnel management for HR department. It includes information about absenteeism, training costs, overtime hours and overall labor effectiveness. Showcasing this set of slides titled Business Intelligence Dashboard To Review Employee Performance Pictures PDF. The topics addressed in these templates are Business Intelligence Dashboard, Review Employee Performance. All the content presented in this PPT design is completely editable. Download it and make adjustments in color, background, font etc. as per your unique business setting.
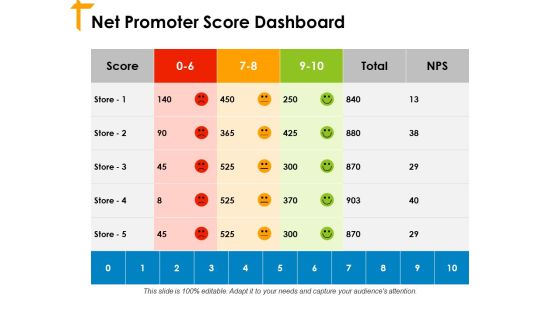
Net Promoter Score Dashboard Ppt PowerPoint Presentation Slides Influencers
This is a net promoter score dashboard ppt powerpoint presentation slides influencers. This is a six stage process. The stages in this process are business, planning, marketing, management, strategy.
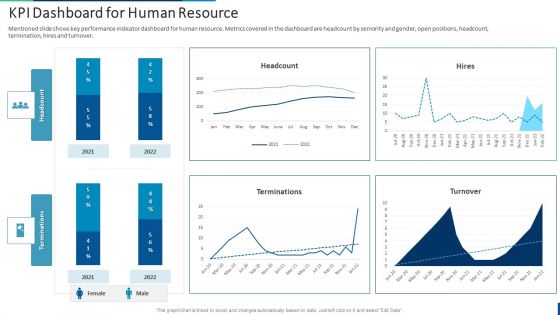
Internal Employee Succession KPI Dashboard For Human Resource Information PDF
Mentioned slide shows key performance indicator dashboard for human resource. Metrics covered in the dashboard are headcount by seniority and gender, open positions, headcount, termination, hires and turnover. If you are looking for a format to display your unique thoughts, then the professionally designed Internal Employee Succession KPI Dashboard For Human Resource Information PDF is the one for you. You can use it as a Google Slides template or a PowerPoint template. Incorporate impressive visuals, symbols, images, and other charts. Modify or reorganize the text boxes as you desire. Experiment with shade schemes and font pairings. Alter, share or cooperate with other people on your work. Download Internal Employee Succession KPI Dashboard For Human Resource Information PDF and find out how to give a successful presentation. Present a perfect display to your team and make your presentation unforgettable.
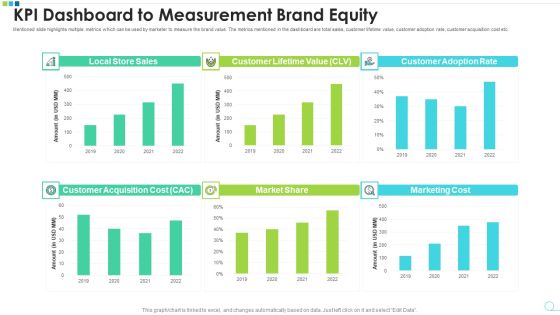
KPI Dashboard To Measurement Brand Equity Microsoft PDF
Mentioned slide highlights multiple metrics which can be used by marketer to measure the brand value. The metrics mentioned in the dashboard are total sales, customer lifetime value, customer adoption rate, customer acquisition cost etc. Pitch your topic with ease and precision using this kpi dashboard to measurement brand equity microsoft pdf. This layout presents information on kpi dashboard to measurement brand equity. It is also available for immediate download and adjustment. So, changes can be made in the color, design, graphics or any other component to create a unique layout.
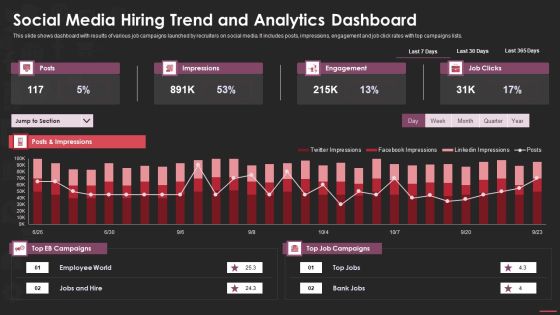
Social Media Hiring Trend And Analytics Dashboard Microsoft PDF
This slide shows dashboard with results of various job campaigns launched by recruiters on social media. It includes posts, impressions, engagement and job click rates with top campaigns lists. Pitch your topic with ease and precision using this social media hiring trend and analytics dashboard microsoft pdf. This layout presents information on social media hiring trend and analytics dashboard. It is also available for immediate download and adjustment. So, changes can be made in the color, design, graphics or any other component to create a unique layout.

Market Research Project Dashboard For Measuring Brand Awareness Rules PDF
Mentioned slide delineates research program dashboard which can be used by marketers for measuring brand awareness. This dashboard includes various elements such as celebrity analysis, top branding themes etc. Pitch your topic with ease and precision using this market research project dashboard for measuring brand awareness rules pdf. This layout presents information on brand awareness, celebrity analysis, advertisement. It is also available for immediate download and adjustment. So, changes can be made in the color, design, graphics or any other component to create a unique layout.

Dashboard Of Project Risk Evaluation With Risk Rating Pictures PDF
The slide highlights the dashboard of project risk assessment with risk rating illustrating total risks, open risk, improving, closed risk, mitigated risk, residual risk, risk rating, inherent risk, control risk and impact probability matrixPitch your topic with ease and precision using this dashboard of project risk evaluation with risk rating pictures pdf This layout presents information on dashboard of project risk evaluation with risk rating It is also available for immediate download and adjustment. So, changes can be made in the color, design, graphics or any other component to create a unique layout.
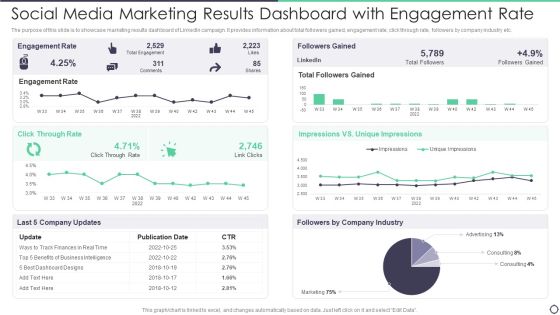
Social Media Marketing Results Dashboard With Engagement Rate Brochure PDF
The purpose of this slide is to showcase marketing results dashboard of LinkedIn campaign. It provides information about total followers gained, engagement rate, click through rate, followers by company industry etc. Pitch your topic with ease and precision using this Social Media Marketing Results Dashboard With Engagement Rate Brochure PDF. This layout presents information on Social Media Marketing Results Dashboard With Engagement Rate. It is also available for immediate download and adjustment. So, changes can be made in the color, design, graphics or any other component to create a unique layout.

Electronic Banking Dashboard With Bank Transfer And Users Background PDF
This slide showcases dashboard of online banking helps to know the status of funds or finances. It includes other bank transfer, users by OS, browser and country. Pitch your topic with ease and precision using this Electronic Banking Dashboard With Bank Transfer And Users Background PDF. This layout presents information on Electronic Banking Dashboard, Bank Transfer And Users. It is also available for immediate download and adjustment. So, changes can be made in the color, design, graphics or any other component to create a unique layout.

Consulting Project Status Report Dashboard With Workspaces Diagrams PDF
The following slide showcases dashboard to provide an insight of active projects, their status and areas that require attention and improvement. Status included are on track, at risk and late Pitch your topic with ease and precision using this Consulting Project Status Report Dashboard With Workspaces Diagrams PDF. This layout presents information on Consulting Project Status Report, Dashboard With Workspaces. It is also available for immediate download and adjustment. So, changes can be made in the color, design, graphics or any other component to create a unique layout.

Email Campaign Dashboard With Conversion Funnel Information PDF
This slide shows email campaign dashboard for marketing teams. It provides information about conversion funnel, sends, opens, clicks, segments, click rate, open rate, unsubscribe rate, click through rate CTR, etc. Pitch your topic with ease and precision using this Email Campaign Dashboard With Conversion Funnel Information PDF. This layout presents information on Email Campaign Dashboard, Conversion Funnel. It is also available for immediate download and adjustment. So, changes can be made in the color, design, graphics or any other component to create a unique layout.

Supply Chain Stock Performance Metrics Dashboard Mockup PDF
This slide shows supply chain inventory performance dashboard for analyzing supply trends over the years. It include metric such as inventory turnover, Percent of stock items and carrying cot MTD etc . Pitch your topic with ease and precision using this Supply Chain Stock Performance Metrics Dashboard Mockup PDF. This layout presents information on Supply Chain Stock, Performance Metrics Dashboard. It is also available for immediate download and adjustment. So, changes can be made in the color, design, graphics or any other component to create a unique layout.
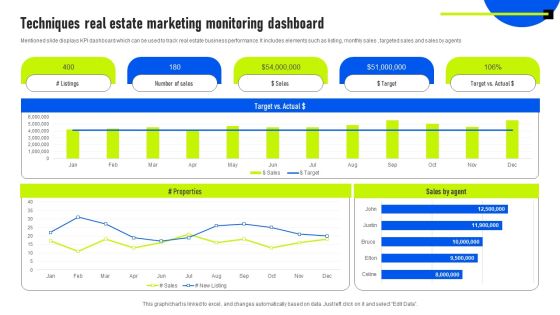
Techniques Real Estate Marketing Monitoring Dashboard Guidelines PDF
Mentioned slide displays KPI dashboard which can be used to track real estate business performance. It includes elements such as listing, monthly sales , targeted sales and sales by agents. Pitch your topic with ease and precision using this Techniques Real Estate Marketing Monitoring Dashboard Guidelines PDF. This layout presents information on Sales By Agent, Target, Marketing Monitoring Dashboard. It is also available for immediate download and adjustment. So, changes can be made in the color, design, graphics or any other component to create a unique layout.

Business Intelligence Dashboard For Food And Beverage Industry Diagrams PDF
This slide showcases BI dashboard to track overall performance of business operations. It further includes elements such as sales, total transactions, non labor margin, expenses by category, etc. Pitch your topic with ease and precision using this Business Intelligence Dashboard For Food And Beverage Industry Diagrams PDF. This layout presents information on Expenses, Sales, Business Intelligence Dashboard. It is also available for immediate download and adjustment. So, changes can be made in the color, design, graphics or any other component to create a unique layout.

Power Plant Energy Consumption And Monitoring Dashboard Diagrams PDF
The slide showcases dashboard it helps energy suppliers to cover fast-changing market demands, analyse and optimize production costs as well as to increase the overall profitability in the long-run. It covers energy consumption by sector, production costs, energy sources, contribution to renewable energy, sales, number of power cuts and average duration. Pitch your topic with ease and precision using this Power Plant Energy Consumption And Monitoring Dashboard Diagrams PDF. This layout presents information on Power Plant Energy Consumption, Monitoring Dashboard. It is also available for immediate download and adjustment. So, changes can be made in the color, design, graphics or any other component to create a unique layout.

Corporate Scam Risk Analysis Report KPI Dashboard Themes PDF
Following slides show the report dashboard on corporate fraud risk which will assist in creating fraud prevention strategies .It includes KPI such as risk matrix, transaction split , transaction alert, etc. Pitch your topic with ease and precision using this Corporate Scam Risk Analysis Report KPI Dashboard Themes PDF. This layout presents information on Global Transaction Flow, Risk Matrix, Transaction Split, Analysis Report Kpi Dashboard. It is also available for immediate download and adjustment. So, changes can be made in the color, design, graphics or any other component to create a unique layout.
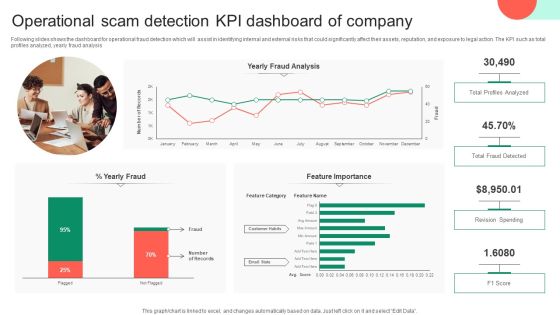
Operational Scam Detection KPI Dashboard Of Company Topics PDF
Following slides shows the dashboard for operational fraud detection which will assist in identifying internal and external risks that could significantly affect their assets, reputation, and exposure to legal action. The KPI such as total profiles analyzed, yearly fraud analysis. Pitch your topic with ease and precision using this Operational Scam Detection KPI Dashboard Of Company Topics PDF. This layout presents information on Profiles Analyzed, Operational Scam Detection, Kpi Dashboard Of Company. It is also available for immediate download and adjustment. So, changes can be made in the color, design, graphics or any other component to create a unique layout.

Scam Prevention Startup KPI Dashboard For Ecommerce Themes PDF
Following slides show the startup dashboard for fraud protection in e-commerce which will assist in identifies developing and fresh fraud attacks. The KPI such as active merchants, covered merchants, approved volume. Pitch your topic with ease and precision using this Scam Prevention Startup KPI Dashboard For Ecommerce Themes PDF. This layout presents information on Approved Volume, Chargebacks Rate, Kpi Dashboard For Ecommerce. It is also available for immediate download and adjustment. So, changes can be made in the color, design, graphics or any other component to create a unique layout.
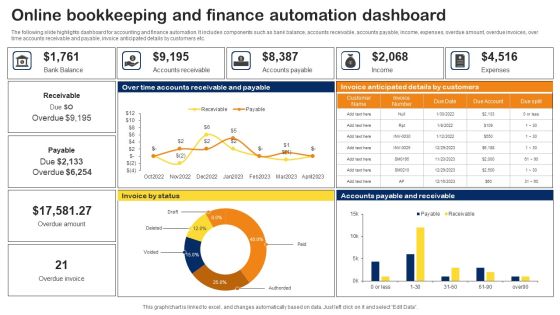
Online Bookkeeping And Finance Automation Dashboard Topics PDF
The following slide highlights dashboard for accounting and finance automation. It includes components such as bank balance, accounts receivable, accounts payable, income, expenses, overdue amount, overdue invoices, over time accounts receivable and payable, invoice anticipated details by customers etc. Pitch your topic with ease and precision using this Online Bookkeeping And Finance Automation Dashboard Topics PDF. This layout presents information on Online Bookkeeping, Finance Automation Dashboard. It is also available for immediate download and adjustment. So, changes can be made in the color, design, graphics or any other component to create a unique layout.

Project Risk Management Progress KPI Dashboard Template PDF
This slide depicts project risk management progress dashboard. It provides information about key performance indicators, risks, issues, planned and actual hours spent, etc. Pitch your topic with ease and precision using this Project Risk Management Progress KPI Dashboard Template PDF. This layout presents information on Current Progress, Risk And Issues. It is also available for immediate download and adjustment. So, changes can be made in the color, design, graphics or any other component to create a unique layout.
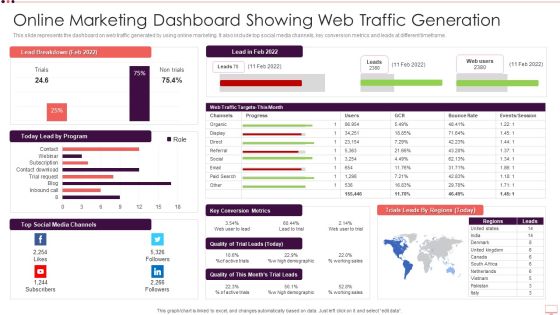
Online Marketing Dashboard Showing Web Traffic Generation Formats PDF
This slide represents the dashboard on web traffic generated by using online marketing. It also include top social media channels, key conversion metrics and leads at different timeframe. Showcasing this set of slides titled Online Marketing Dashboard Showing Web Traffic Generation Formats PDF. The topics addressed in these templates are Online Marketing Dashboard Showing Web Traffic Generation. All the content presented in this PPT design is completely editable. Download it and make adjustments in color, background, font etc. as per your unique business setting.
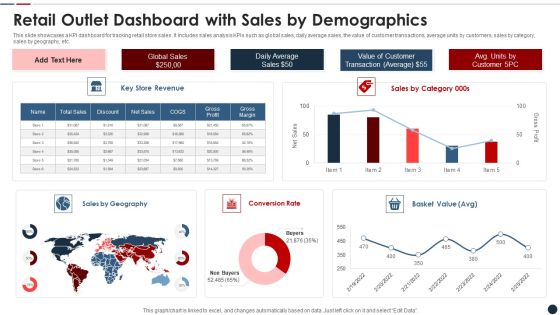
Retail Outlet Dashboard With Sales By Demographics Slides PDF
This slide showcases a KPI dashboard for tracking retail store sales. It includes sales analysis KPIs such as global sales, daily average sales, the value of customer transactions, average units by customers, sales by category, sales by geography, etc. Showcasing this set of slides titled retail outlet dashboard with sales by demographics slides pdf The topics addressed in these templates are Retail outlet dashboard with sales by demographics All the content presented in this PPT design is completely editable. Download it and make adjustments in color, background, font etc. as per your unique business setting.

Food And Beverage Industry Kpi Dashboard Professional PDF
This slide covers the food and beverage analysis dashboard. It include KPIs such as revenue by location, top five expenses by account, revenue by type, top five expenses by department, etc.Showcasing this set of slides titled Food And Beverage Industry Kpi Dashboard Professional PDF. The topics addressed in these templates are Food And Beverage Industry KPI Dashboard. All the content presented in this PPT design is completely editable. Download it and make adjustments in color, background, font etc. as per your unique business setting
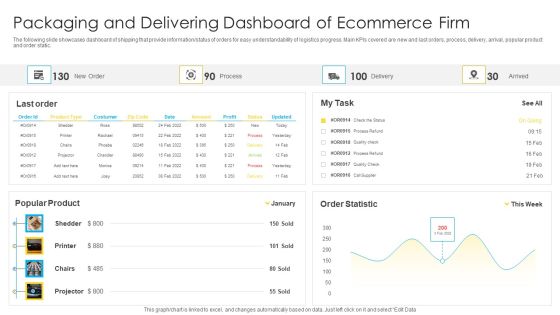
Packaging And Delivering Dashboard Of Ecommerce Firm Slides PDF
The following slide showcases dashboard of shipping that provide information or status of orders for easy understandability of logistics progress. Main KPIs covered are new and last orders, process, delivery, arrival, popular product and order static. Showcasing this set of slides titled Packaging And Delivering Dashboard Of Ecommerce Firm Slides PDF. The topics addressed in these templates are Packaging And Delivering, Dashboard Ecommerce Firm. All the content presented in this PPT design is completely editable. Download it and make adjustments in color, background, font etc. as per your unique business setting.
New Staff Onboarding Process KPI Tracking Dashboard Inspiration PDF
This slide showcase the KPI dashboard for tracking new hire onboarding completion progress. It includes KPIs such as onboarding completion status, employees per office, progress chart, hires starting in current and next week. Showcasing this set of slides titled New Staff Onboarding Process KPI Tracking Dashboard Inspiration PDF. The topics addressed in these templates are New Staff Onboarding Process, KPI Tracking Dashboard. All the content presented in this PPT design is completely editable. Download it and make adjustments in color, background, font etc. as per your unique business setting.

Six Months Lead Generation Marketing Dashboard Inspiration PDF
The slide carries lead generation dashboard to build deeper understanding of business and customer journey. Various KPIs included are lead values per month, number of leads per month and lead marketing channels. Showcasing this set of slides titled Six Months Lead Generation Marketing Dashboard Inspiration PDF. The topics addressed in these templates are Six Months Lead Generation, Marketing Dashboard. All the content presented in this PPT design is completely editable. Download it and make adjustments in color, background, font etc. as per your unique business setting.
Sales Performance Dashboard Ppt PowerPoint Presentation Professional Icons
This is a sales performance dashboard template ppt powerpoint presentation slides example file. This is a six stage process. The stages in this process are business, marketing, strategy, finance, planning.
 Home
Home