Executive Project Portfolio Dashboard
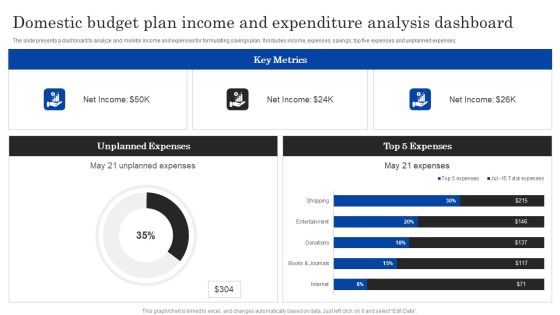
Domestic Budget Plan Income And Expenditure Analysis Dashboard Ppt PowerPoint Presentation Layouts Clipart Images PDF
The slide presents a dashboard to analyze and monitor income and expenses for formulating savings plan. It includes income, expenses, savings, top five expenses and unplanned expenses.Pitch your topic with ease and precision using this Domestic Budget Plan Income And Expenditure Analysis Dashboard Ppt PowerPoint Presentation Layouts Clipart Images PDF. This layout presents information on Unplanned Expenses, Expenses, Key Metrics. It is also available for immediate download and adjustment. So, changes can be made in the color, design, graphics or any other component to create a unique layout.
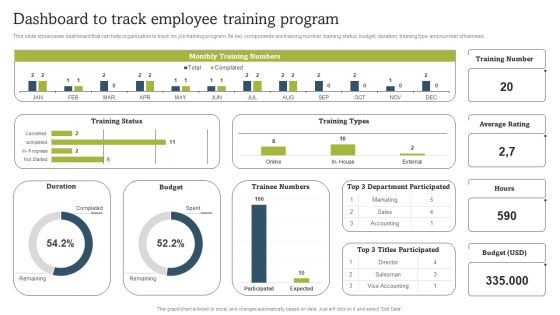
On Job Staff Coaching Program For Skills Refinement Dashboard To Track Employee Training Program Clipart PDF
This slide showcases dashboard that can help organization to track on job training program. Its key components are training number, training status, budget, duration, training type and number of trainees. Create an editable On Job Staff Coaching Program For Skills Refinement Dashboard To Track Employee Training Program Clipart PDF that communicates your idea and engages your audience. Whether you are presenting a business or an educational presentation, pre designed presentation templates help save time. On Job Staff Coaching Program For Skills Refinement Dashboard To Track Employee Training Program Clipart PDF is highly customizable and very easy to edit, covering many different styles from creative to business presentations. Slidegeeks has creative team members who have crafted amazing templates. So, go and get them without any delay.
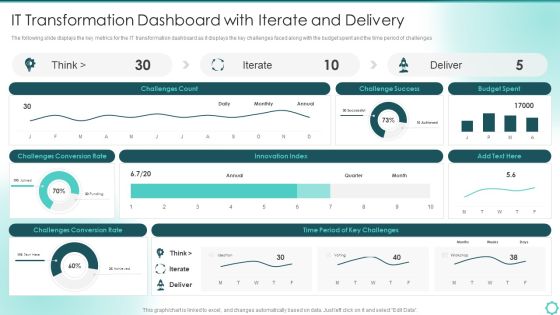
Digitalization Of Transportation Enterprise IT Transformation Dashboard With Iterate And Delivery Designs PDF
The following slide displays the key metrics for the IT transformation dashboard as it displays the key challenges faced along with the budget spent and the time period of challenges. Deliver and pitch your topic in the best possible manner with this Digitalization Of Transportation Enterprise IT Transformation Dashboard With Iterate And Delivery Designs PDF. Use them to share invaluable insights on Innovation Index, Budget Spent, Conversion Rate and impress your audience. This template can be altered and modified as per your expectations. So, grab it now.

Product Marketing Performance Assessment Dashboard With Cost Per Conversion Professional PDF
This slide showcases dashboard that can help organization to calculate the return of investment from advertising campaigns. Its key components are top performing advertisement, top performing campaigns, conversion rate, conversion value, click through rate, cost per click and cost per conversion. Showcasing this set of slides titled Product Marketing Performance Assessment Dashboard With Cost Per Conversion Professional PDF. The topics addressed in these templates are Top Performing Advertisement, Top Performing Campaigns, AdWords Conversions. All the content presented in this PPT design is completely editable. Download it and make adjustments in color, background, font etc. as per your unique business setting.

Change Management Training Calendar Dashboard With Actual And Budgeted Cost Demonstration PDF
This slide showcases KPI dashboard of training program to assess its efficiency and proper functioning. It includes details such as cost, total hours, occupancy rate, etc. Showcasing this set of slides titled Change Management Training Calendar Dashboard With Actual And Budgeted Cost Demonstration PDF. The topics addressed in these templates are Actual, Budget, Cost Per Participant, Cost Per Hour. All the content presented in this PPT design is completely editable. Download it and make adjustments in color, background, font etc. as per your unique business setting.

Kpi Dashboard Highlighting Results Of Human Resource Training Administration Background PDF
Mentioned slide outlines a dashboard through which the organization can track and evaluate the results of Human Resource Training Administration. It provides information about metrics such as training budget, total cost, cost per participant, total hours of training, etc. Showcasing this set of slides titled Kpi Dashboard Highlighting Results Of Human Resource Training Administration Background PDF. The topics addressed in these templates are Actual Cost Vs, Training Budget, Approved Training Budget, Online Training. All the content presented in this PPT design is completely editable. Download it and make adjustments in color, background, font etc. as per your unique business setting.

Operating Profit Margin Dashboard With Income Statement And Expenses Brochure PDF
This slide showcases dashboard that can help organization to estimate the profit generated by organization from its core operations and expenses incurred for different activities. Its key components are operating profit margin, net profit margin, income statement and EBIT. Showcasing this set of slides titled Operating Profit Margin Dashboard With Income Statement And Expenses Brochure PDF. The topics addressed in these templates are Operating Expenses, Income Statement, Gross Profit. All the content presented in this PPT design is completely editable. Download it and make adjustments in color, background, font etc. as per your unique business setting.
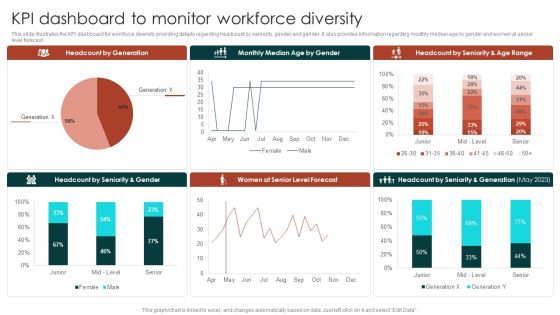
Diversity Management Plan To Improve Workplace Culture KPI Dashboard To Monitor Workforce Microsoft PDF
This slide illustrates the KPI dashboard for workforce diversity providing details regarding headcount by seniority, gender and gender. It also provides information regarding monthly median age by gender and women at senior level forecast.Find a pre-designed and impeccable Diversity Management Plan To Improve Workplace Culture KPI Dashboard To Monitor Workforce Microsoft PDF. The templates can ace your presentation without additional effort. You can download these easy-to-edit presentation templates to make your presentation stand out from others. So, what are you waiting for. Download the template from Slidegeeks today and give a unique touch to your presentation.

Dashboard To Track Extensive Diversity Training Status For Employees Developement Elements PDF
This slide showcases the dashboard to track current diversity training status in the organization. Key metrics included here are training cost actual and budgeted, cost per partcipant, number of participants every month, hours of training provided etc. Showcasing this set of slides titled Dashboard To Track Extensive Diversity Training Status For Employees Developement Elements PDF. The topics addressed in these templates are Training Cost, Budget, Occupancy Rate. All the content presented in this PPT design is completely editable. Download it and make adjustments in color, background, font etc. as per your unique business setting.
OEM Spare Parts Sales Tracking Dashboard Ppt PowerPoint Presentation Gallery Inspiration PDF
This slide showcases dashboard that can help organization to keep track of aftermarket components sales. Its key elements are sold quantity per spare part and deviation of sold units. Pitch your topic with ease and precision using this oem spare parts sales tracking dashboard ppt powerpoint presentation gallery inspiration pdf. This layout presents information on sold quantity, budgeted quantity, quantity ytd ly. It is also available for immediate download and adjustment. So, changes can be made in the color, design, graphics or any other component to create a unique layout.
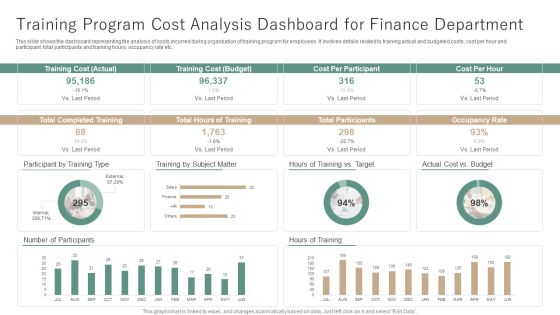
Training Program Cost Analysis Dashboard For Finance Department Ppt Example PDF
This slide shows the dashboard representing the analysis of costs incurred during organization of training program for employees. It involves details related to training actual and budgeted costs, cost per hour and participant, total participants and training hours, occupancy rate etc. Pitch your topic with ease and precision using this Training Program Cost Analysis Dashboard For Finance Department Ppt Example PDF. This layout presents information on Training Cost, Number Participants, Hours Of Training. It is also available for immediate download and adjustment. So, changes can be made in the color, design, graphics or any other component to create a unique layout.
SFA Dashboard To Track Performance Ppt PowerPoint Presentation Icon Example File PDF
This Slide visually represents sales force automation dashboard to track performance which can be utilized by marketing managers to streamline the process of automated selling. It includes information about sales pipeline, competitors, opportunities, key competitors, etc. Pitch your topic with ease and precision using this sfa dashboard to track performance ppt powerpoint presentation icon example file pdf. This layout presents information on sales pipeline, sales pipeline by sales rep, key competitors, forecast by month, key opportunities. It is also available for immediate download and adjustment. So, changes can be made in the color, design, graphics or any other component to create a unique layout.

KPI Dashboard To Evaluate Growth In Sales Funnel Reporting Topics PDF
This slide represents the KPI dashboard to measure sales pipeline reporting for increasing customer conversion rate. It includes activity by representative, forecast by month and monthly growth. Pitch your topic with ease and precision using this KPI Dashboard To Evaluate Growth In Sales Funnel Reporting Topics PDF. This layout presents information on Pipeline Requirement, Key Activities, Pipeline Closed Date. It is also available for immediate download and adjustment. So, changes can be made in the color, design, graphics or any other component to create a unique layout.
Monthly Budget Dashboard Showing HR Cost Ppt PowerPoint Presentation Icon Infographics PDF
Showcasing this set of slides titled monthly budget dashboard showing hr cost ppt powerpoint presentation icon infographics pdf. The topics addressed in these templates are budget, expenses, actual. All the content presented in this PPT design is completely editable. Download it and make adjustments in color, background, font etc. as per your unique business setting.
Influencers Marketing Campaign Performance Tracking Dashboard Ppt PowerPoint Presentation Diagram Lists PDF
This slide covers performance monitoring dashboard of influencer based referral marketing program. It includes elements such as impressions on Instagram, likes, comments, clicks, sales generated along with value calculators and campaign breakdown based on gender and age. Formulating a presentation can take up a lot of effort and time, so the content and message should always be the primary focus. The visuals of the PowerPoint can enhance the presenters message, so our Influencers Marketing Campaign Performance Tracking Dashboard Ppt PowerPoint Presentation Diagram Lists PDF was created to help save time. Instead of worrying about the design, the presenter can concentrate on the message while our designers work on creating the ideal templates for whatever situation is needed. Slidegeeks has experts for everything from amazing designs to valuable content, we have put everything into Influencers Marketing Campaign Performance Tracking Dashboard Ppt PowerPoint Presentation Diagram Lists PDF
Predictive Analytics Model Performance Tracking Dashboard Forward Looking Analysis IT Introduction PDF
This slide represents the predictive analytics model performance tracking dashboard, and it covers the details of total visitors, total buyers, total products added to the cart, filters by date and category, visitors to clients conversion rate, and so on.The Predictive Analytics Model Performance Tracking Dashboard Forward Looking Analysis IT Introduction PDF is a compilation of the most recent design trends as a series of slides. It is suitable for any subject or industry presentation, containing attractive visuals and photo spots for businesses to clearly express their messages. This template contains a variety of slides for the user to input data, such as structures to contrast two elements, bullet points, and slides for written information. Slidegeeks is prepared to create an impression.
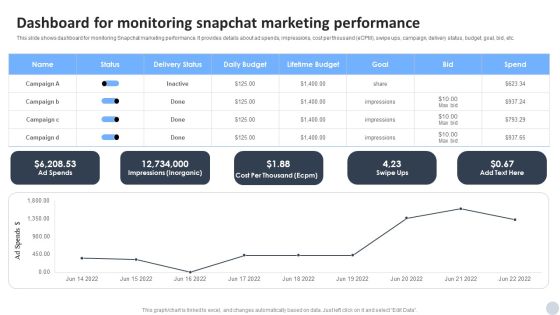
Social Media Marketing Strategies To Generate Lead Dashboard For Monitoring Snapchat Marketing Performance Infographics PDF
This slide shows dashboard for monitoring Snapchat marketing performance. It provides details about ad spends, impressions, cost per thousand eCPM, swipe ups, campaign, delivery status, budget, goal, bid, etc. Create an editable Social Media Marketing Strategies To Generate Lead Dashboard For Monitoring Snapchat Marketing Performance Infographics PDF that communicates your idea and engages your audience. Whether you are presenting a business or an educational presentation, pre designed presentation templates help save time. Social Media Marketing Strategies To Generate Lead Dashboard For Monitoring Snapchat Marketing Performance Infographics PDF is highly customizable and very easy to edit, covering many different styles from creative to business presentations. Slidegeeks has creative team members who have crafted amazing templates. So, go and get them without any delay.

IT Cost Reduction Strategies Determine IT Department Cost Management Dashboard Guidelines PDF
This slide provides information regarding IT department cost management dashboard including KPIs such as return on investment of IT department, spend vs. budget, IT cost breakdown and IT costs vs. revenues. Get a simple yet stunning designed IT Cost Reduction Strategies Determine IT Department Cost Management Dashboard Guidelines PDF. It is the best one to establish the tone in your meetings. It is an excellent way to make your presentations highly effective. So, download this PPT today from Slidegeeks and see the positive impacts. Our easy-to-edit IT Cost Reduction Strategies Determine IT Department Cost Management Dashboard Guidelines PDF can be your go-to option for all upcoming conferences and meetings. So, what are you waiting for Grab this template today.

Business Unit Valuation And Development Dashboard Ppt Professional Graphic Tips PDF
This slide shows key performance indicators dashboard which represents number of assets along with their stages of development. It also includes estimated development cost and production index comparison. Pitch your topic with ease and precision using this Business Unit Valuation And Development Dashboard Ppt Professional Graphic Tips PDF. This layout presents information on Estimated Development Cost, Production Index, Development Stage. It is also available for immediate download and adjustment. So, changes can be made in the color, design, graphics or any other component to create a unique layout.
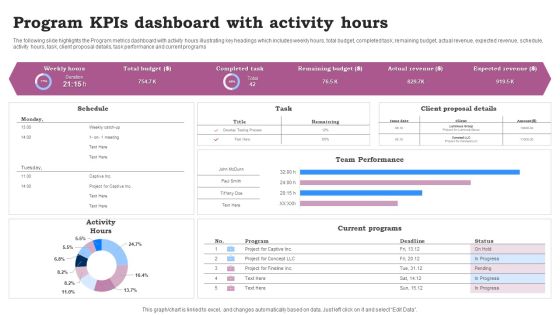
Program Kpis Dashboard With Activity Hours Ppt Infographics Clipart Images PDF
The following slide highlights the Program metrics dashboard with activity hours illustrating key headings which includes weekly hours, total budget, completed task, remaining budget, actual revenue, expected revenue, schedule, activity hours, task, client proposal details, task performance and current programs. Pitch your topic with ease and precision using this Program Kpis Dashboard With Activity Hours Ppt Infographics Clipart Images PDF. This layout presents information on Team Performance, Current Programs, Activity Hours. It is also available for immediate download and adjustment. So, changes can be made in the color, design, graphics or any other component to create a unique layout.

Revenue And Expense Budget Deficit Analysis With KPI Dashboard Rules PDF
Showcasing this set of slides titled Revenue And Expense Budget Deficit Analysis With KPI Dashboard Rules PDF. The topics addressed in these templates are Revenue And Expense, Budget Deficit Analysis. All the content presented in this PPT design is completely editable. Download it and make adjustments in color, background, font etc. as per your unique business setting.

Customer Lifetime Value Based Success KPIS Dashboard Ppt PowerPoint Presentation Layouts Gridlines PDF
This slide covers dashboard for estimation of customer lifetime value as success metrics. It includes KPIs such as customer lifetime value, customer lifetime period, customer risk, customer contact rate, customer retention costs, average lifetime value, customer churn rate, average revenue per account, etc. Pitch your topic with ease and precision using this Customer Lifetime Value Based Success KPIS Dashboard Ppt PowerPoint Presentation Layouts Gridlines PDF. This layout presents information on Average Revenue, Customer Lifetime, Customer Risk. It is also available for immediate download and adjustment. So, changes can be made in the color, design, graphics or any other component to create a unique layout.

Customer Retention Based Success KPIS Dashboard Ppt PowerPoint Presentation Slides Graphics Pictures PDF
This slide covers dashboard for estimation of customer retention based success metrics. It includes KPIs such as net retention rates including expansion, contractions, net MRR, cancelled accounts, etc. Showcasing this set of slides titled Customer Retention Based Success KPIS Dashboard Ppt PowerPoint Presentation Slides Graphics Pictures PDF. The topics addressed in these templates are Account Retention, Cancelled Accounts, Retention Components. All the content presented in this PPT design is completely editable. Download it and make adjustments in color, background, font etc. as per your unique business setting.

Operational Innovation In Banking Banking Operation Strategy Dashboard Highlighting Inspiration PDF
This slide highlights the banking operation strategy which includes accounts opened and closed, total deposit vs branch goal, accounts by type, expense to budget and referrals by product. Create an editable Operational Innovation In Banking Banking Operation Strategy Dashboard Highlighting Inspiration PDF that communicates your idea and engages your audience. Whether youre presenting a business or an educational presentation, pre-designed presentation templates help save time. Operational Innovation In Banking Banking Operation Strategy Dashboard Highlighting Inspiration PDF is highly customizable and very easy to edit, covering many different styles from creative to business presentations. Slidegeeks has creative team members who have crafted amazing templates. So, go and get them without any delay.

KPI Dashboard For Informational Technology Department To Analyze Key Financials Structure PDF
This slide shows KPI dashboard for informational technology department to analyze key financials of companies which assists in decision making for growth. It also includes information about IT department ROI, expenditure vs. Allocated budget, it cost breakdown and it expenditure vs. Revenue. Pitch your topic with ease and precision using this KPI Dashboard For Informational Technology Department To Analyze Key Financials Structure PDF. This layout presents information on Expenditure Vs Allocated, Budget IT Cost, Break Down IT, Expenditure Vs Revenue, IT Department ROI. It is also available for immediate download and adjustment. So, changes can be made in the color, design, graphics or any other component to create a unique layout.

KPI Dashboard To Track Effectiveness Of OJT Program Ppt Gallery Sample PDF
This slide shows key performance indicator dashboard which can be used to monitor OJT program. It includes KPIs such as training cost, total participants, cost per employee, cost per hour, training hours, etc. Showcasing this set of slides titled KPI Dashboard To Track Effectiveness Of OJT Program Ppt Gallery Sample PDF. The topics addressed in these templates are Actual Training Cost, Budgeted Training Cost, Cost per Employee. All the content presented in this PPT design is completely editable. Download it and make adjustments in color, background, font etc. as per your unique business setting.
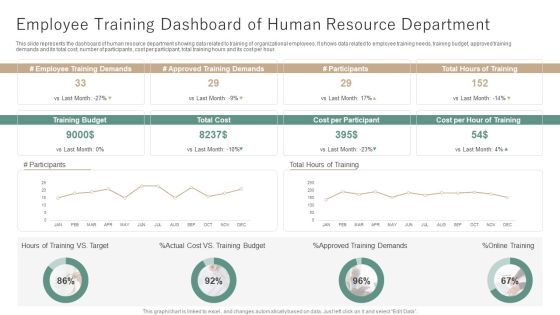
Employee Training Dashboard Of Human Resource Department Ppt Outline Themes PDF
This slide represents the dashboard of human resource department showing data related to training of organizational employees. It shows data related to employee training needs, training budget, approved training demands and its total cost, number of participants, cost per participant, total training hours and its cost per hour. Showcasing this set of slides titled Employee Training Dashboard Of Human Resource Department Ppt Outline Themes PDF. The topics addressed in these templates are Employee Training Demands, Approved Training Demands, Cost per Participant. All the content presented in this PPT design is completely editable. Download it and make adjustments in color, background, font etc. as per your unique business setting.

Dashboard Showcasing Website UI Mockup Approach For Apparel Company Themes PDF
This slide represents dashboard showcasing website user design mockup which helps business track productivity. It provides information regarding price assessment, market segmentation, product assortment and discount trends. Showcasing this set of slides titled Dashboard Showcasing Website UI Mockup Approach For Apparel Company Themes PDF. The topics addressed in these templates are Product Market Activity, Budget Assessment, Assortment. All the content presented in this PPT design is completely editable. Download it and make adjustments in color, background, font etc. as per your unique business setting.
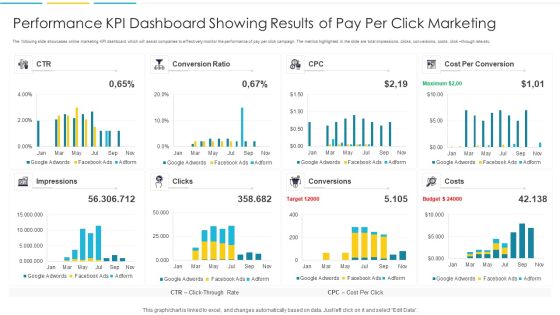
Performance KPI Dashboard Showing Results Of Pay Per Click Marketing Portrait PDF
The following slide showcases online marketing KPI dashboard which will assist companies to effectively monitor the performance of pay per click campaign. The metrics highlighted in the slide are total impressions, clicks, conversions, costs, click through rate etc. Pitch your topic with ease and precision using this Performance KPI Dashboard Showing Results Of Pay Per Click Marketing Portrait PDF. This layout presents information on Impressions, Target, Budget. It is also available for immediate download and adjustment. So, changes can be made in the color, design, graphics or any other component to create a unique layout.
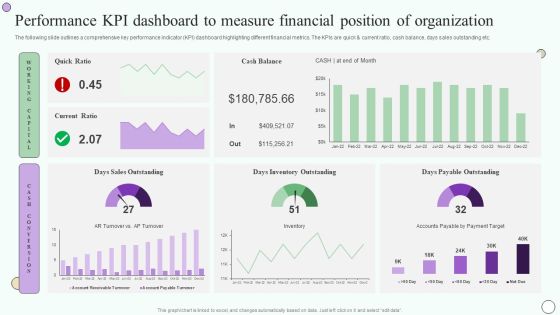
Estimating Business Overall Performance Kpi Dashboard To Measure Financial Position Inspiration PDF
The following slide outlines a comprehensive key performance indicator KPI dashboard highlighting different financial metrics. The KPIs are quick and current ratio, cash balance, days sales outstanding etc. Welcome to our selection of the Estimating Business Overall Performance Kpi Dashboard To Measure Financial Position Inspiration PDF. These are designed to help you showcase your creativity and bring your sphere to life. Planning and Innovation are essential for any business that is just starting out. This collection contains the designs that you need for your everyday presentations. All of our PowerPoints are 100 percent editable, so you can customize them to suit your needs. This multi-purpose template can be used in various situations. Grab these presentation templates today.
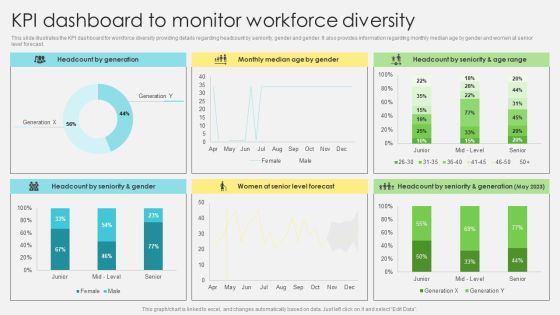
Inclusive Leadership Program KPI Dashboard To Monitor Workforce Diversity Designs PDF
This slide illustrates the KPI dashboard for workforce diversity providing details regarding headcount by seniority, gender and gender. It also provides information regarding monthly median age by gender and women at senior level forecast. Welcome to our selection of the Inclusive Leadership Program KPI Dashboard To Monitor Workforce Diversity Designs PDF. These are designed to help you showcase your creativity and bring your sphere to life. Planning and Innovation are essential for any business that is just starting out. This collection contains the designs that you need for your everyday presentations. All of our PowerPoints are 100 percent editable, so you can customize them to suit your needs. This multi purpose template can be used in various situations. Grab these presentation templates today.
Event Management And Budget Planner Dashboard Stakeholder Engagement Plan For Launch Event Icons PDF
This slide provides an overview of dashboard depicting budget planning for event. It includes budget graph, photographer, venue, decoration and catering expenses. Retrieve professionally designed Event Management And Budget Planner Dashboard Stakeholder Engagement Plan For Launch Event Icons PDF to effectively convey your message and captivate your listeners. Save time by selecting pre-made slideshows that are appropriate for various topics, from business to educational purposes. These themes come in many different styles, from creative to corporate, and all of them are easily adjustable and can be edited quickly. Access them as PowerPoint templates or as Google Slides themes. You do not have to go on a hunt for the perfect presentation because Slidegeeks got you covered from everywhere.
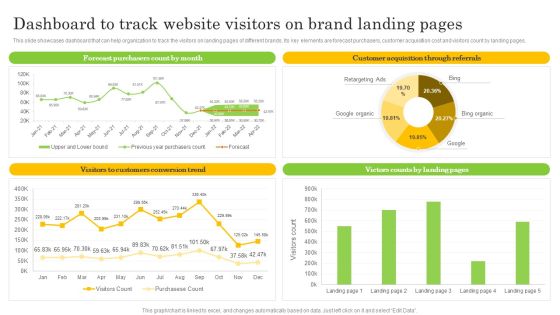
Dashboard To Track Website Visitors On Brand Landing Pages Sample PDF
This slide showcases dashboard that can help organization to track the visitors on landing pages of different brands. Its key elements are forecast purchasers, customer acquisition cost and visitors count by landing pages. This Dashboard To Track Website Visitors On Brand Landing Pages Sample PDF from Slidegeeks makes it easy to present information on your topic with precision. It provides customization options, so you can make changes to the colors, design, graphics, or any other component to create a unique layout. It is also available for immediate download, so you can begin using it right away. Slidegeeks has done good research to ensure that you have everything you need to make your presentation stand out. Make a name out there for a brilliant performance.
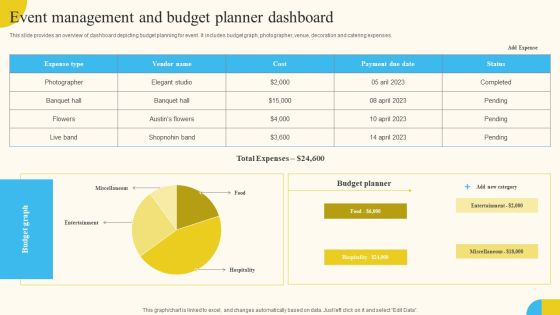
Event Management And Budget Planner Dashboard Activities For Successful Launch Event Sample PDF
This slide provides an overview of dashboard depicting budget planning for event. It includes budget graph, photographer, venue, decoration and catering expenses. Do you know about Slidesgeeks Event Management And Budget Planner Dashboard Activities For Successful Launch Event Sample PDF These are perfect for delivering any kind od presentation. Using it, create PowerPoint presentations that communicate your ideas and engage audiences. Save time and effort by using our pre-designed presentation templates that are perfect for a wide range of topic. Our vast selection of designs covers a range of styles, from creative to business, and are all highly customizable and easy to edit. Download as a PowerPoint template or use them as Google Slides themes.

Financial KPI Dashboard With Liquidity Ratio Analysis And Current Assets Breakdown Ideas PDF
This showcases KPI dashboard the can help organization to evaluate the financial performance and analyze the liquidity ratios. Its key components are vendor payment error rate, budget variance and cash conversion cycle. Showcasing this set of slides titled. The topics addressed in these templates are Quick Status, Workning Capital, Budget Variance. All the content presented in this PPT design is completely editable. Download it and make adjustments in color, background, font etc. as per your unique business setting.

Deployment Of Omnichannel Banking Solutions Dashboard To Track Customers Account Statements Designs PDF
This slide covers overview of customers account based on different bank products used by customers. It includes elements such as statements for cash and loan accounts, credit cards, expense and budget analysis, bill payments, etc. Get a simple yet stunning designed Deployment Of Omnichannel Banking Solutions Dashboard To Track Customers Account Statements Designs PDF. It is the best one to establish the tone in your meetings. It is an excellent way to make your presentations highly effective. So, download this PPT today from Slidegeeks and see the positive impacts. Our easy to edit Deployment Of Omnichannel Banking Solutions Dashboard To Track Customers Account Statements Designs PDF can be your go to option for all upcoming conferences and meetings. So, what are you waiting for Grab this template today.

Staff On Job Coaching Program For Skills Enhancement Dashboard To Track Employee Training Program Professional PDF
This slide showcases dashboard that can help organization to track on job training program. Its key components are training number, training status, budget, duration, training type and number of trainees. This Staff On Job Coaching Program For Skills Enhancement Dashboard To Track Employee Training Program Professional PDF from Slidegeeks makes it easy to present information on your topic with precision. It provides customization options, so you can make changes to the colors, design, graphics, or any other component to create a unique layout. It is also available for immediate download, so you can begin using it right away. Slidegeeks has done good research to ensure that you have everything you need to make your presentation stand out. Make a name out there for a brilliant performance.

CRM System Competitive Dashboard With Sales Pipeline Ppt PowerPoint Presentation Icon Outfit PDF
Showcasing this set of slides titled crm system competitive dashboard with sales pipeline ppt powerpoint presentation icon outfit pdf. The topics addressed in these templates are sales forecast by competitor, win loss report, open opportunity revenue by competitor, sales pipeline by sales rep, competitor. All the content presented in this PPT design is completely editable. Download it and make adjustments in color, background, font etc. as per your unique business setting.
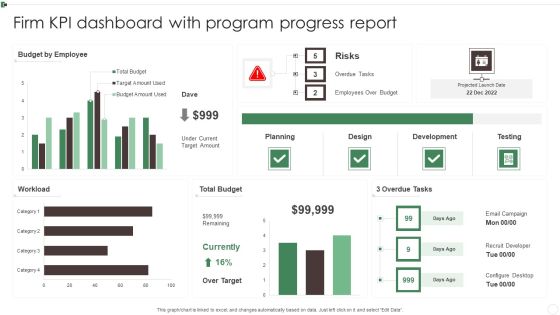
Firm KPI Dashboard With Program Progress Report Ppt Pictures Deck PDF
This graph or chart is linked to excel, and changes automatically based on data. Just left click on it and select Edit Data. Showcasing this set of slides titled Firm KPI Dashboard With Program Progress Report Ppt Pictures Deck PDF. The topics addressed in these templates are Budget By Employee, Total Budget, 3 Overdue Tasks, Workload. All the content presented in this PPT design is completely editable. Download it and make adjustments in color, background, font etc. as per your unique business setting.
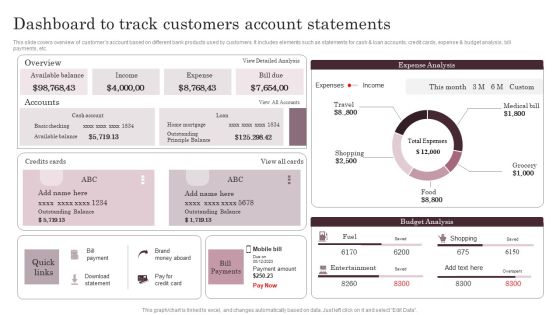
Omnichannel Services Solution In Financial Sector Dashboard To Track Customers Account Statements Guidelines PDF
This slide covers overview of customers account based on different bank products used by customers. It includes elements such as statements for cash and loan accounts, credit cards, expense and budget analysis, bill payments, etc. Create an editable Omnichannel Services Solution In Financial Sector Dashboard To Track Customers Account Statements Guidelines PDF that communicates your idea and engages your audience. Whether you are presenting a business or an educational presentation, pre designed presentation templates help save time. Omnichannel Services Solution In Financial Sector Dashboard To Track Customers Account Statements Guidelines PDF is highly customizable and very easy to edit, covering many different styles from creative to business presentations. Slidegeeks has creative team members who have crafted amazing templates. So, go and get them without any delay.

HR Budget Vs Actual KPI Dashboard Ppt PowerPoint Presentation File Structure PDF
The given below slide highlights the key metrics of HR budget to manage expense stream and take assist decision making. It includes KPAs such as month wise variations in budget, total amount allocated, actual expenditures etc. Pitch your topic with ease and precision using this HR Budget Vs Actual KPI Dashboard Ppt PowerPoint Presentation File Structure PDF. This layout presents information on Amount Allocated, Expenses by Heads, Budget Achieved. It is also available for immediate download and adjustment. So, changes can be made in the color, design, graphics or any other component to create a unique layout.

Economic Facts And Insights Analysis Dashboard Ppt PowerPoint Presentation Inspiration Slide Download PDF
Showcasing this set of slides titled economic facts and insights analysis dashboard ppt powerpoint presentation inspiration slide download pdf. The topics addressed in these templates are current working capital, cash conversion cycle in days last, current quick stats, vendor payment error rate last, 12 months currnet budget variance. All the content presented in this PPT design is completely editable. Download it and make adjustments in color, background, font etc. as per your unique business setting.
Integrating AI To Enhance Dashboard For Tracking Impact Of Procurement Process Slides PDF
This slide covers the dashboard for analysing procurement performance after automation. It include KPIs such as on-time delivery, percentage of returns, compliance index percentage, procurement ROI, cost-saving, budget spent on training, etc. Slidegeeks is here to make your presentations a breeze with Integrating AI To Enhance Dashboard For Tracking Impact Of Procurement Process Slides PDF With our easy-to-use and customizable templates, you can focus on delivering your ideas rather than worrying about formatting. With a variety of designs to choose from, youre sure to find one that suits your needs. And with animations and unique photos, illustrations, and fonts, you can make your presentation pop. So whether youre giving a sales pitch or presenting to the board, make sure to check out Slidegeeks first.

Dashboard For Tracking And Measuring Business Sales And Revenue Ppt PowerPoint Presentation Slides Introduction PDF
Showcasing this set of slides titled dashboard for tracking and measuring business sales and revenue ppt powerpoint presentation slides introduction pdf. The topics addressed in these templates are revenue by pipeline jun 2020, new deals by month this year 2020, forecast june 2020, revenue goal attainment by owner jun 2020, revenue goal attainment jun 2020, pipeline coverage jul 2020. All the content presented in this PPT design is completely editable. Download it and make adjustments in color, background, font etc. as per your unique business setting.
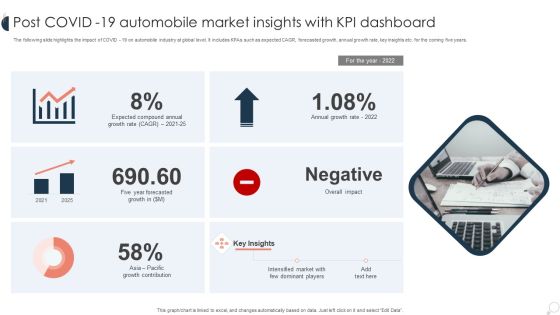
Post COVID 19 Automobile Market Insights With KPI Dashboard Ppt PowerPoint Presentation Slides Background Images PDF
The following slide highlights the impact of COVID 19 on automobile industry at global level. It includes KPAs such as expected CAGR, forecasted growth, annual growth rate, key insights etc. for the coming five years. Showcasing this set of slides titled Post COVID 19 Automobile Market Insights With KPI Dashboard Ppt PowerPoint Presentation Slides Background Images PDF. The topics addressed in these templates are Expected Compound, Annual Growth, Overall Impact. All the content presented in this PPT design is completely editable. Download it and make adjustments in color, background, font etc. as per your unique business setting.

Problem Administration Dashboard Budget Ppt PowerPoint Presentation Complete Deck With Slides
Boost your confidence and team morale with this well-structured problem administration dashboard budget ppt powerpoint presentation complete deck with slides. This prefabricated set gives a voice to your presentation because of its well-researched content and graphics. Our experts have added all the components very carefully, thus helping you deliver great presentations with a single click. Not only that, it contains a set of thirty six slides that are designed using the right visuals, graphics, etc. Various topics can be discussed, and effective brainstorming sessions can be conducted using the wide variety of slides added in this complete deck. Apart from this, our PPT design contains clear instructions to help you restructure your presentations and create multiple variations. The color, format, design anything can be modified as deemed fit by the user. Not only this, it is available for immediate download. So, grab it now.

BI Technique For Data Informed Decisions Sap Analytics Cloud Dashboard For Product Sales Analysis Sample PDF
This slide illustrates the SAP Analytics Cloud dashboard to monitor product sales performance. It provides information regarding the gross margin and net revenue earned, product performance state wise and year wise. Welcome to our selection of the Budget Plan For BI Technique For Data Informed Decisions Clipart PDF. These are designed to help you showcase your creativity and bring your sphere to life. Planning and Innovation are essential for any business that is just starting out. This collection contains the designs that you need for your everyday presentations. All of our PowerPoints are 100 percent editable, so you can customize them to suit your needs. This multi purpose template can be used in various situations. Grab these presentation templates today.

Information Technology Expenditure Summary Dashboard Ppt PowerPoint Presentation Diagram Graph Charts PDF
The following slide showcases the cyber security expense overview to better allocate budget. It includes elements such as IT cost, revenue, security incidents, services down, issue status summary, total business hours lost etc. This Information Technology Expenditure Summary Dashboard Ppt PowerPoint Presentation Diagram Graph Charts PDF from Slidegeeks makes it easy to present information on your topic with precision. It provides customization options, so you can make changes to the colors, design, graphics, or any other component to create a unique layout. It is also available for immediate download, so you can begin using it right away. Slidegeeks has done good research to ensure that you have everything you need to make your presentation stand out. Make a name out there for a brilliant performance.

Project Management Gantt Chart For Data Analysis Project Proposal One Pager Sample Example Document
Presenting you an exemplary Project Management Gantt Chart For Data Analysis Project Proposal One Pager Sample Example Document. Our one-pager comprises all the must-have essentials of an inclusive document. You can edit it with ease, as its layout is completely editable. With such freedom, you can tweak its design and other elements to your requirements. Download this Project Management Gantt Chart For Data Analysis Project Proposal One Pager Sample Example Document brilliant piece now.

Project Roadmap For Data Analysis Project Proposal One Pager Sample Example Document
Presenting you an exemplary Project Roadmap For Data Analysis Project Proposal One Pager Sample Example Document. Our one-pager comprises all the must-have essentials of an inclusive document. You can edit it with ease, as its layout is completely editable. With such freedom, you can tweak its design and other elements to your requirements. Download this Project Roadmap For Data Analysis Project Proposal One Pager Sample Example Document brilliant piece now.
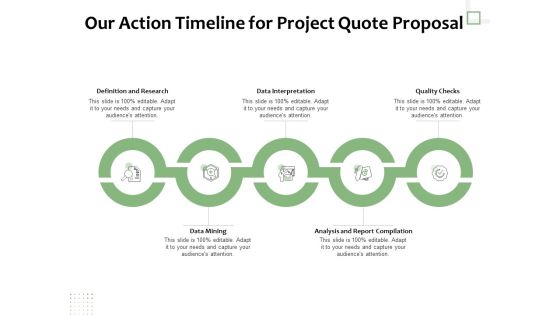
Project Estimate Our Action Timeline For Project Quote Proposal Ppt Inspiration Design Templates PDF
Presenting this set of slides with name project estimate our action timeline for project quote proposal ppt inspiration design templates pdf. This is a five stage process. The stages in this process are data interpretation, quality checks, data mining, analysis, report compilation. This is a completely editable PowerPoint presentation and is available for immediate download. Download now and impress your audience.

Construction Project Cost Benefit Analysis Report Real Estate Market Growth Projections Rules PDF
Following slide displays the growth projections of global real estate market. It shows that real estate market is estimated to rise to 5 percent mark in 2023. The Construction Project Cost Benefit Analysis Report Real Estate Market Growth Projections Rules PDF is a compilation of the most recent design trends as a series of slides. It is suitable for any subject or industry presentation, containing attractive visuals and photo spots for businesses to clearly express their messages. This template contains a variety of slides for the user to input data, such as structures to contrast two elements, bullet points, and slides for written information. Slidegeeks is prepared to create an impression.
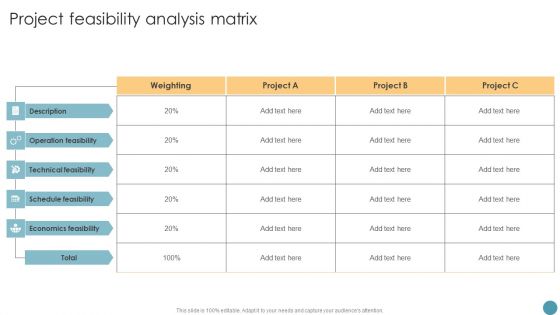
Project Feasibility Analysis Matrix Feasibility Analysis Report For Construction Project Designs PDF
The Project Feasibility Analysis Matrix Feasibility Analysis Report For Construction Project Designs PDF is a compilation of the most recent design trends as a series of slides. It is suitable for any subject or industry presentation, containing attractive visuals and photo spots for businesses to clearly express their messages. This template contains a variety of slides for the user to input data, such as structures to contrast two elements, bullet points, and slides for written information. Slidegeeks is prepared to create an impression.

New Project Plan Project Goals Deliverables And Target Ppt PowerPoint Presentation Infographics Graphics Download PDF
The following slide illustrates the summary of project to provide comprehensive view of key components. It includes elements such as project justification, objectives, deliverables, requirements, target cost along with variance etc. Showcasing this set of slides titled New Project Plan Project Goals Deliverables And Target Ppt PowerPoint Presentation Infographics Graphics Download PDF. The topics addressed in these templates are Monitoring Performance, Key Requirements, Permission Managers. All the content presented in this PPT design is completely editable. Download it and make adjustments in color, background, font etc. as per your unique business setting.

Submission Of Project Viability Report For Bank Loan Project Overview Objectives And Deliverables Template PDF
Following slide shows the objective and deliverables of construction project. It also includes the information about project name, its location, duration and cost. The visuals of a PowerPoint presentation can only be effective if it supplements and supports the story that is being told. Keeping this in mind our experts created Submission Of Project Viability Report For Bank Loan Project Overview Objectives And Deliverables Template PDF to reduce the time that goes into designing the presentation. This way, you can concentrate on the message while our designers take care of providing you with the right template for the situation.

Feasibility Analysis Report For Construction Project Real Estate Market Growth Projections Download PDF
Following slide displays the growth projections of global real estate market. It shows that real estate market is estimated to rise to 5 percent mark in 2023. Get a simple yet stunning designed Feasibility Analysis Report For Construction Project Real Estate Market Growth Projections Download PDF. It is the best one to establish the tone in your meetings. It is an excellent way to make your presentations highly effective. So, download this PPT today from Slidegeeks and see the positive impacts. Our easy to edit Feasibility Analysis Report For Construction Project Real Estate Market Growth Projections Download PDF can be your go to option for all upcoming conferences and meetings. So, what are you waiting for Grab this template today.

Construction Project Cost Benefit Analysis Report For Mortgage Approval Real Estate Market Growth Projections Formats PDF
Following slide displays the growth projections of global real estate market. It shows that real estate market is estimated to rise to 5 percent mark in 2023. Get a simple yet stunning designed Construction Project Cost Benefit Analysis Report For Mortgage Approval Real Estate Market Growth Projections Formats PDF. It is the best one to establish the tone in your meetings. It is an excellent way to make your presentations highly effective. So, download this PPT today from Slidegeeks and see the positive impacts. Our easy to edit Construction Project Cost Benefit Analysis Report For Mortgage Approval Real Estate Market Growth Projections Formats PDF can be your go to option for all upcoming conferences and meetings. So, what are you waiting for Grab this template today.

Submission Of Project Viability Report For Bank Loan Real Estate Market Growth Projections Guidelines PDF
Following slide displays the growth projections of global real estate market. It shows that real estate market is estimated to rise to 5 percent mark in 2023. Explore a selection of the finest Submission Of Project Viability Report For Bank Loan Real Estate Market Growth Projections Guidelines PDF here. With a plethora of professionally designed and pre-made slide templates, you can quickly and easily find the right one for your upcoming presentation. You can use our Submission Of Project Viability Report For Bank Loan Real Estate Market Growth Projections Guidelines PDF to effectively convey your message to a wider audience. Slidegeeks has done a lot of research before preparing these presentation templates. The content can be personalized and the slides are highly editable. Grab templates today from Slidegeeks.
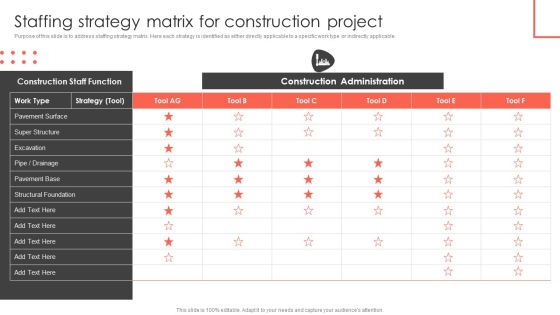
Staffing Strategy Matrix For Construction Project Construct Project Feasibility Analysis Report Themes PDF
Purpose of this slide is to address staffing strategy matrix. Here each strategy is identified as either directly applicable to a specific work type or indirectly applicable. The Staffing Strategy Matrix For Construction Project Construct Project Feasibility Analysis Report Themes PDF is a compilation of the most recent design trends as a series of slides. It is suitable for any subject or industry presentation, containing attractive visuals and photo spots for businesses to clearly express their messages. This template contains a variety of slides for the user to input data, such as structures to contrast two elements, bullet points, and slides for written information. Slidegeeks is prepared to create an impression.

Depicting Impact On Project Success Rate Strategies To Enhance Project Lifecycle Infographics PDF
This slide focuses on impact of project management plan on success rate which compares project success due to efficient scheduling, capable project team, etc.This Depicting Impact On Project Success Rate Strategies To Enhance Project Lifecycle Infographics PDF from Slidegeeks makes it easy to present information on your topic with precision. It provides customization options, so you can make changes to the colors, design, graphics, or any other component to create a unique layout. It is also available for immediate download, so you can begin using it right away. Slidegeeks has done good research to ensure that you have everything you need to make your presentation stand out. Make a name out there for a brilliant performance.

 Home
Home