AI PPT Maker
Templates
PPT Bundles
Design Services
Business PPTs
Business Plan
Management
Strategy
Introduction PPT
Roadmap
Self Introduction
Timelines
Process
Marketing
Agenda
Technology
Medical
Startup Business Plan
Cyber Security
Dashboards
SWOT
Proposals
Education
Pitch Deck
Digital Marketing
KPIs
Project Management
Product Management
Artificial Intelligence
Target Market
Communication
Supply Chain
Google Slides
Research Services
 One Pagers
All Categories
-
Home
- Customer Favorites
- Executive Project Portfolio Dashboard
Executive Project Portfolio Dashboard

Annual Revenue And Cost Budget Deficit KPI Dashboard Ideas PDF
The following slide depicts the yearly budget variance to compare projected and actual results. It includes elements such as net income, service revenues, profit margin, payroll cost, cost of goods sold etc. Showcasing this set of slides titled Annual Revenue And Cost Budget Deficit KPI Dashboard Ideas PDF. The topics addressed in these templates are Cost Budget, Deficit KPI Dashboard. All the content presented in this PPT design is completely editable. Download it and make adjustments in color, background, font etc. as per your unique business setting.
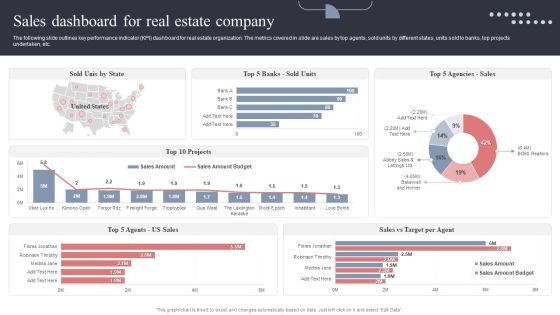
Sales Dashboard For Real Estate Company Topics PDF
The following slide outlines key performance indicator KPI dashboard for real estate organization. The metrics covered in slide are sales by top agents, sold units by different states, units sold to banks, top projects undertaken, etc. This Sales Dashboard For Real Estate Company Topics PDF is perfect for any presentation, be it in front of clients or colleagues. It is a versatile and stylish solution for organizing your meetings. The Sales Dashboard For Real Estate Company Topics PDF features a modern design for your presentation meetings. The adjustable and customizable slides provide unlimited possibilities for acing up your presentation. Slidegeeks has done all the homework before launching the product for you. So, do not wait, grab the presentation templates today

Comprehensive Business Digitization Deck Business Transformation Dashboard Sample PDF
This slide covers transformation dashboard covering various stages of a business along with the budget and risks involved at every stage. Deliver and pitch your topic in the best possible manner with this comprehensive business digitization deck business transformation dashboard sample pdf. Use them to share invaluable insights on discovery or visioning, plan, design, execute, monitor and impress your audience. This template can be altered and modified as per your expectations. So, grab it now.

Reshaping Business In Digital Business Transformation Dashboard Formats PDF
This slide covers transformation dashboard covering various stages of a business along with the budget and risks involved at every stage. Deliver an awe inspiring pitch with this creative Reshaping Business In Digital Business Transformation Dashboard Formats PDF bundle. Topics like Plan, Design, Execute, Monitor can be discussed with this completely editable template. It is available for immediate download depending on the needs and requirements of the user.

Business Plan Review Dashboard With Task Details Sample PDF
The following slide showcases dashboard of plan review to track KPIs and other relevant details regarding business, department and projects. Key indicators covered are contracts, proposals, documents review, bid date, plan review, completion percentage and priority. Pitch your topic with ease and precision using this Business Plan Review Dashboard With Task Details Sample PDF. This layout presents information on Business Plan Review, Dashboard With Task Details. It is also available for immediate download and adjustment. So, changes can be made in the color, design, graphics or any other component to create a unique layout.
Team Achievement Dashboard For Tracking Tasks Completion Graphics PDF
This slide illustrates team success dashboard for tracking tasks completion. This provides information about rate, section, incomplete, assignee, upcoming tasks, etc. Showcasing this set of slides titled team achievement dashboard for tracking tasks completion graphics pdf. The topics addressed in these templates are completion rate, spent time on project, task completion. All the content presented in this PPT design is completely editable. Download it and make adjustments in color, background, font etc. as per your unique business setting.

Compensation And Salary Dashboard With Estimated Income Ideas PDF
The following slide showcases dashboard highlighting employee compensation and performance analysis. The dashboard also includes credit, attainment and estimated earnings. Showcasing this set of slides titled Compensation And Salary Dashboard With Estimated Income Ideas PDF. The topics addressed in these templates are Performance Analysis, Compensation Analysis, Historical Performance Analysis. All the content presented in this PPT design is completely editable. Download it and make adjustments in color, background, font etc. as per your unique business setting.
Icon Of Yearly Financial Position Calculation Dashboard Formats PDF
Pitch your topic with ease and precision using this icon of yearly financial position calculation dashboard formats pdf. This layout presents information on icon of yearly financial position calculation dashboard. It is also available for immediate download and adjustment. So, changes can be made in the color, design, graphics or any other component to create a unique layout.

Balance Sheet Calculation With Financial Dashboard Background PDF
Pitch your topic with ease and precision using this balance sheet calculation with financial dashboard background pdf. This layout presents information on balance sheet calculation with financial dashboard. It is also available for immediate download and adjustment. So, changes can be made in the color, design, graphics or any other component to create a unique layout.
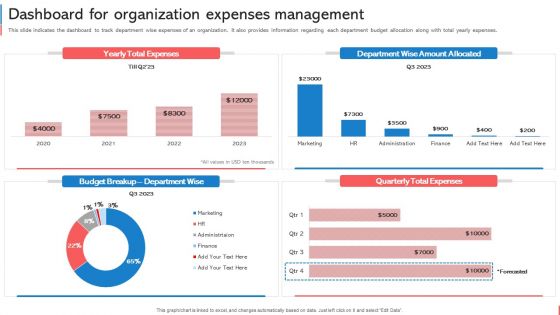
Company Budget Analysis Dashboard For Organization Expenses Management Graphics PDF
This slide indicates the dashboard to track department wise expenses of an organization. It also provides information regarding each department budget allocation along with total yearly expenses. Create an editable Company Budget Analysis Dashboard For Organization Expenses Management Graphics PDF that communicates your idea and engages your audience. Whether youre presenting a business or an educational presentation, pre-designed presentation templates help save time. Company Budget Analysis Dashboard For Organization Expenses Management Graphics PDF is highly customizable and very easy to edit, covering many different styles from creative to business presentations. Slidegeeks has creative team members who have crafted amazing templates. So, go and get them without any delay.

Dashboard To Track Energy Efficiency After Campaign Implementation Pictures PDF
This slide consists of a Dashboard which can be used to track energy saving which will be used by managers to track effectiveness of program implementation. The key performance indicators include electric vs gas allocation, equipment activity, changes in costs, budget load etc. Showcasing this set of slides titled Dashboard To Track Energy Efficiency After Campaign Implementation Pictures PDF. The topics addressed in these templates are Equipment Activity, Budget Load, Cost Projection. All the content presented in this PPT design is completely editable. Download it and make adjustments in color, background, font etc. as per your unique business setting.

Inventory Management Dashboard To Forecasting Stock Budget Elements PDF
The following slide depicts the inventory analysis dashboard to determine inventory accuracy. It includes elements such as order cycle time, stock trend, ratio analysis, product wise inventory analysis etc. Pitch your topic with ease and precision using this Inventory Management Dashboard To Forecasting Stock Budget Elements PDF. This layout presents information on Inventory Ratio Analysis, Product Wise Inventory Analysis, Stock Trend. It is also available for immediate download and adjustment. So, changes can be made in the color, design, graphics or any other component to create a unique layout.
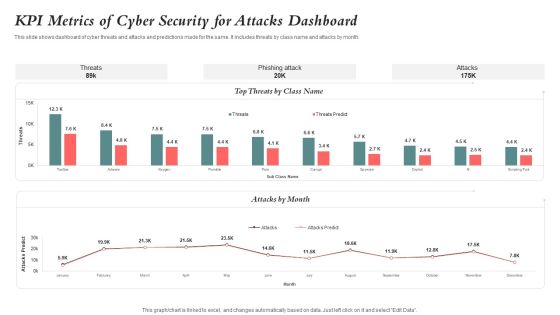
KPI Metrics Of Cyber Security For Attacks Dashboard Guidelines PDF
This slide shows dashboard of cyber threats and attacks and predictions made for the same. It includes threats by class name and attacks by month. Showcasing this set of slides titled KPI Metrics Of Cyber Security For Attacks Dashboard Guidelines PDF. The topics addressed in these templates are Kpi Metrics, Cyber Security, Attacks Dashboard. All the content presented in this PPT design is completely editable. Download it and make adjustments in color, background, font etc. as per your unique business setting.

Financial Budgeting And Assessment Dashboard With Revenue Variance Designs PDF
This slide shows the dashboard representing financial analysis and planning of an organization. It highlights the set revenue targets and actual revenue with the help of graphs. Showcasing this set of slides titled Financial Budgeting And Assessment Dashboard With Revenue Variance Designs PDF. The topics addressed in these templates are YTD Revenue, Revenue Delta, Revenue Variance. All the content presented in this PPT design is completely editable. Download it and make adjustments in color, background, font etc. as per your unique business setting.

Actual Vs Budgeted Earning Breakup Dashboard Inspiration PDF
This style showcases revenue breakdown dashboard that can help organization to compare the actual vs budgeted amount and calculate the variance in target achievements. Its key components are product revenue, services revenue and total revenues. Showcasing this set of slides titled Actual Vs Budgeted Earning Breakup Dashboard Inspiration PDF. The topics addressed in these templates are Actual Vs Budgeted, Earning Breakup Dashboard. All the content presented in this PPT design is completely editable. Download it and make adjustments in color, background, font etc. as per your unique business setting.

Business Operational Expenditure Monitoring Dashboard With Budget Analysis Icons PDF
This slide shows operating expenses OPEX monitoring dashboard with budget analysis assisting companies in evaluating funds useful until end of the year. It visually present the organizations operating expenses by time period and sector. Showcasing this set of slides titled Business Operational Expenditure Monitoring Dashboard With Budget Analysis Icons PDF. The topics addressed in these templates are Business Operational, Budget Analysis, Monitoring Dashboard. All the content presented in this PPT design is completely editable. Download it and make adjustments in color, background, font etc. as per your unique business setting.

Actual And Forecasted Income And Expenses Analysis Dashboard Portrait PDF
This slide shows the dashboard representing the comparison between the actual and forecasted monthly income and expenses of an organization. It also shows the report overview of monthly income and expenses of organization. Showcasing this set of slides titled Actual And Forecasted Income And Expenses Analysis Dashboard Portrait PDF. The topics addressed in these templates are Expenses, Income, Expenses. All the content presented in this PPT design is completely editable. Download it and make adjustments in color, background, font etc. as per your unique business setting.

Building Quality Inspection Dashboard With Customer Satisfaction Ratio Icons PDF
The following slide showcases dashboard of construction company exhibiting quality KPIs regarding safety, workmanship and customer satisfaction. Key indicators covered are site inspection success level, CSR, defect count, net promoter score, promotors, passives, defectors, total rework cost, safety meetings and average time taken to fix defects. Showcasing this set of slides titled Building Quality Inspection Dashboard With Customer Satisfaction Ratio Icons PDF. The topics addressed in these templates are Construction Project, Customer Satisfaction Ratio, Promoters. All the content presented in this PPT design is completely editable. Download it and make adjustments in color, background, font etc. as per your unique business setting.

Business Opportunity Dashboard With Customer Metrics Information PDF
This Slide illustrates market opportunity dashboard with customer metrics which contains favorable net promoter score NPS, standard customers, growth rate, cumulative average of customer location, net income vs projection, customer distribution, sales by representatives, etc. Pitch your topic with ease and precision using this Business Opportunity Dashboard With Customer Metrics Information PDF. This layout presents information on Customer Distribution, Growth Rate, Top Customers Locations. It is also available for immediate download and adjustment. So, changes can be made in the color, design, graphics or any other component to create a unique layout.

Digital Marketing Campaign Performance Monitoring Dashboard Pictures PDF
This slide represents the dashboard for measuring and monitoring the performance of digital marketing campaign. It includes information related to the advertisement cost, cost per conversion, no. of clicks, conversion rate, impressions, cost per click, click through rate and cost per thousand impressions of the project.Pitch your topic with ease and precision using this Digital Marketing Campaign Performance Monitoring Dashboard Pictures PDF. This layout presents information on Conversion Rate, Per Conversion, Cost Per Thousand. It is also available for immediate download and adjustment. So, changes can be made in the color, design, graphics or any other component to create a unique layout.

Cyber Protection And Precaution Tracking Dashboard Designs PDF
This slide shows the dashboard of cyber safety and security of an organization. It includes risk level, compliance status, tracking and security budget. Showcasing this set of slides titled Cyber Protection And Precaution Tracking Dashboard Designs PDF. The topics addressed in these templates are Risk, Compliance Status, Risk Level. All the content presented in this PPT design is completely editable. Download it and make adjustments in color, background, font etc. as per your unique business setting.

Financial Dashboard To Evaluate Internal Rate Of Return Diagrams PDF
This slide showcases dashboard that can help organization to calculate the internal rate rate of return on invested capital. Company can use it to communicate the return on investment to investors. Create an editable Financial Dashboard To Evaluate Internal Rate Of Return Diagrams PDF that communicates your idea and engages your audience. Whether youre presenting a business or an educational presentation, pre designed presentation templates help save time. Financial Dashboard To Evaluate Internal Rate Of Return Diagrams PDF is highly customizable and very easy to edit, covering many different styles from creative to business presentations. Slidegeeks has creative team members who have crafted amazing templates. So, go and get them without any delay.
Employee Training Status KPI Dashboard With Budget Summary PDF
This slide consists of a dashboard to track employee annual training status in order to update the plan for next year. It includes elements such as training number, total hours, budget, trainee numbers, training types, etc. Pitch your topic with ease and precision using this Employee Training Status KPI Dashboard With Budget Summary PDF. This layout presents information on Employee Training Status, KPI Dashboard With Budget. It is also available for immediate download and adjustment. So, changes can be made in the color, design, graphics or any other component to create a unique layout.

Corporate Sales Capability And Financial Forecast Dashboard Download PDF
This slide illustrates facts and figures related to expected revenue generation in upcoming months in a corporation. It includes expected sales revenue for FY23, yearly sales revenue etc. Showcasing this set of slides titled Corporate Sales Capability And Financial Forecast Dashboard Download PDF. The topics addressed in these templates are Corporate Sales, Capability And Financial, Forecast Dashboard. All the content presented in this PPT design is completely editable. Download it and make adjustments in color, background, font etc. as per your unique business setting

Key Company Financials Business Intelligence Dashboard Graphics PDF
This slide showcases business intelligence dashboard to analyze key financial metrics for the organization. It includes information such as current working capital, vendor payment error rate, quick stats, budget variance, etc. Showcasing this set of slides titled Key Company Financials Business Intelligence Dashboard Graphics PDF. The topics addressed in these templates are Key Company Financials, Business Intelligence Dashboard. All the content presented in this PPT design is completely editable. Download it and make adjustments in color, background, font etc. as per your unique business setting.

KPI Dashboard To Measure Sales Divisional Strategy Growth Formats PDF
This slide signifies the key performance indicator to measure sales department strategy growth. It covers information regarding to the units sold, top 10 project, target per agent. Showcasing this set of slides titled KPI Dashboard To Measure Sales Divisional Strategy Growth Formats PDF. The topics addressed in these templates are Sales, Target. All the content presented in this PPT design is completely editable. Download it and make adjustments in color, background, font etc. as per your unique business setting.
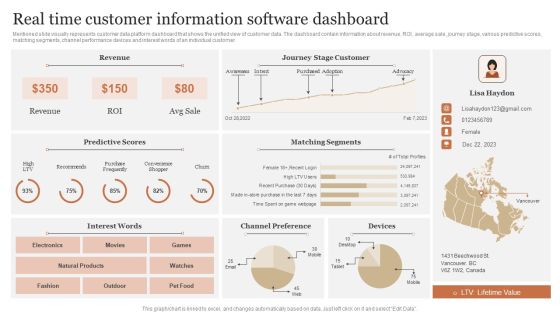
Real Time Customer Information Software Dashboard Portrait PDF
Mentioned slide visually represents customer data platform dashboard that shows the unified view of customer data. The dashboard contain information about revenue, ROI, average sale, journey stage, various predictive scores, matching segments, channel performance devices and interest words of an individual customer. Showcasing this set of slides titled Real Time Customer Information Software Dashboard Portrait PDF. The topics addressed in these templates are Predictive Scores, Matching Segments, Channel Preference. All the content presented in this PPT design is completely editable. Download it and make adjustments in color, background, font etc. as per your unique business setting.
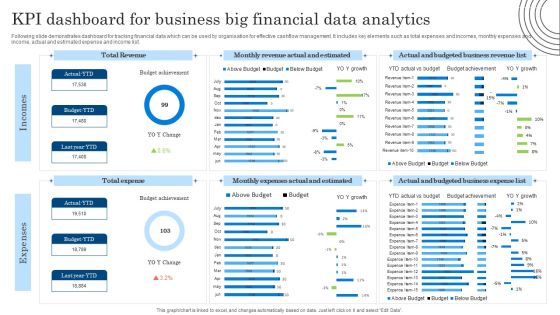
KPI Dashboard For Business Big Financial Data Analytics Diagrams PDF
Following slide demonstrates dashboard for tracking financial data which can be used by organisation for effective cashflow management. It includes key elements such as total expenses and incomes, monthly expenses and income, actual and estimated expense and income list. Showcasing this set of slides titled KPI Dashboard For Business Big Financial Data Analytics Diagrams PDF. The topics addressed in these templates are KPI Dashboard, Business Big Financial, Data Analytics. All the content presented in this PPT design is completely editable. Download it and make adjustments in color, background, font etc. as per your unique business setting.
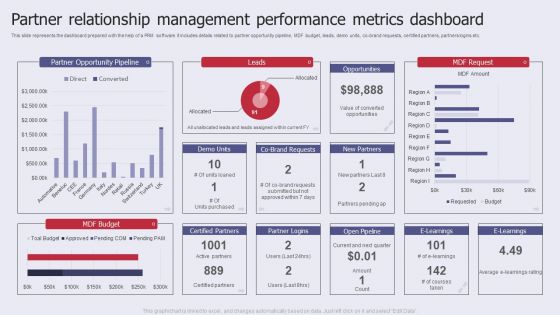
Partner Relationship Management Performance Metrics Dashboard Pictures PDF
This slide represents the dashboard prepared with the help of a PRM software. It includes details related to partner opportunity pipeline, MDF budget, leads, demo units, co brand requests, certified partners, partners logins etc. Showcasing this set of slides titled Partner Relationship Management Performance Metrics Dashboard Pictures PDF. The topics addressed in these templates are Partner Opportunity Pipeline, MDF Budget, Performance Metrics Dashboard. All the content presented in this PPT design is completely editable. Download it and make adjustments in color, background, font etc. as per your unique business setting.

B2B Lead Marketing Funnel Dashboard Ppt Model Slides PDF
This slide covers the marketing dashboard wherein the lead count is calculated based on media, events, emails, etc.Presenting B2B lead marketing funnel dashboard ppt model slides pdf. to provide visual cues and insights. Share and navigate important information on four stages that need your due attention. This template can be used to pitch topics like media, events, inbound. In addtion, this PPT design contains high resolution images, graphics, etc, that are easily editable and available for immediate download.
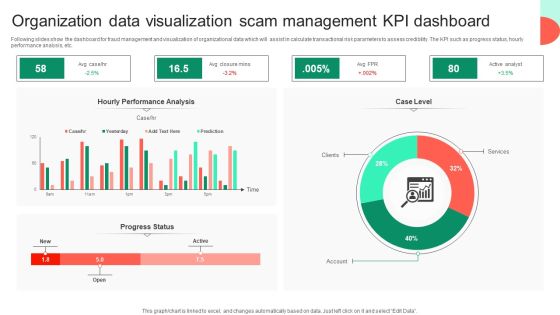
Organization Data Visualization Scam Management KPI Dashboard Rules PDF
Following slides show the dashboard for fraud management and visualization of organizational data which will assist in calculate transactional risk parameters to assess credibility. The KPI such as progress status, hourly performance analysis, etc. Showcasing this set of slides titled Organization Data Visualization Scam Management KPI Dashboard Rules PDF. The topics addressed in these templates are Hourly Performance Analysis, Services, Organization Data Visualization. All the content presented in this PPT design is completely editable. Download it and make adjustments in color, background, font etc. as per your unique business setting.

Dashboard For Tracking Green Financing Activities Themes PDF
This slide presents a finance dashboard to track the progress of sustainability activities based on finance allocations. The key performing indicators are overall progress, energy usage by month, budget allocation and application etc. Showcasing this set of slides titled Dashboard For Tracking Green Financing Activities Themes PDF. The topics addressed in these templates are Activities, Application, Dashboard. All the content presented in this PPT design is completely editable. Download it and make adjustments in color, background, font etc. as per your unique business setting.

Logistics Management Dashboard With Predicted Order Delays Slides PDF
This slide outlines dashboard of shipping statistics that can help organization to identify shipments in transit and track them to ensure timely delivery of orders. It also showcases KPIs which are delivery attempts, delivery rate and order pickup rate. Showcasing this set of slides titled Logistics Management Dashboard With Predicted Order Delays Slides PDF. The topics addressed in these templates are Warehouse Transit, Shipment Statistics, Failed Deliveries. All the content presented in this PPT design is completely editable. Download it and make adjustments in color, background, font etc. as per your unique business setting.

Transaction Data Overview Company Payout Dashboard Guidelines PDF
The slide highlights the payment dashboard to overview the transaction data for effectively managing finances. Various elements included are activities, statistics, card information, transaction history, and budget. Pitch your topic with ease and precision using this Transaction Data Overview Company Payout Dashboard Guidelines PDF. This layout presents information on Transaction History, Budget, Card Information, Statistics. It is also available for immediate download and adjustment. So, changes can be made in the color, design, graphics or any other component to create a unique layout.

B2B Lead Marketing Funnel Dashboard Ppt Styles Ideas PDF
This slide covers the marketing dashboard wherein the lead count is calculated based on media, events, emails, etc.Presenting B2B lead marketing funnel dashboard ppt styles ideas pdf. to provide visual cues and insights. Share and navigate important information on four stages that need your due attention. This template can be used to pitch topics like media, events, inbound. In addtion, this PPT design contains high resolution images, graphics, etc, that are easily editable and available for immediate download.
Online Business Simulation Dashboard For Practicing Marketing Strategies Icons PDF
This slide shows business simulation dashboard for strengthening marketing strategy practice. It provides information about marketing mix, budget, product allocation, time allocation, etc. Showcasing this set of slides titled Online Business Simulation Dashboard For Practicing Marketing Strategies Icons PDF. The topics addressed in these templates are Marketing Budget, Product Allocation, Marketing Team Size. All the content presented in this PPT design is completely editable. Download it and make adjustments in color, background, font etc. as per your unique business setting.

Dashboard For Technological Smart Homes Security System Management Designs PDF
This side showcase the dashboard of security system management for tracking and forecasting matrices for better functioning of devices. It include the statistic data such as temperature, power consumed, devices working, and list of devices connected. Showcasing this set of slides titled Dashboard For Technological Smart Homes Security System Management Designs PDF. The topics addressed in these templates are Smart Light, Smart Heating, Smart Cooling. All the content presented in this PPT design is completely editable. Download it and make adjustments in color, background, font etc. as per your unique business setting.
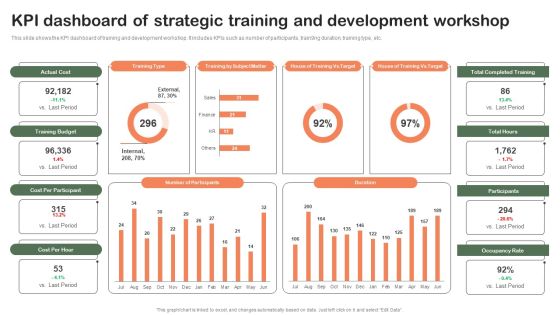
KPI Dashboard Of Strategic Training And Development Workshop Rules PDF
This slide shows the KPI dashboard of training and development workshop. It includes KPIs such as number of participants, train9ng duration, training type, etc. Showcasing this set of slides titled KPI Dashboard Of Strategic Training And Development Workshop Rules PDF. The topics addressed in these templates are Actual Cost, Training Type, Training Budget, Cost Per Participant. All the content presented in this PPT design is completely editable. Download it and make adjustments in color, background, font etc. as per your unique business setting.
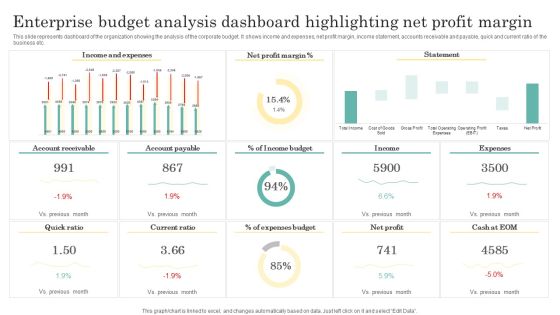
Enterprise Budget Analysis Dashboard Highlighting Net Profit Margin Clipart PDF
This slide represents dashboard of the organization showing the analysis of the corporate budget. It shows income and expenses, net profit margin, income statement, accounts receivable and payable, quick and current ratio of the business etc. Showcasing this set of slides titled Enterprise Budget Analysis Dashboard Highlighting Net Profit Margin Clipart PDF. The topics addressed in these templates are Income And Expenses, Net Profit Margin, Income Budget. All the content presented in this PPT design is completely editable. Download it and make adjustments in color, background, font etc. as per your unique business setting.

Dashboard Depicting Company Book Value With Calculations Microsoft PDF
Pitch your topic with ease and precision using this dashboard depicting company book value with calculations microsoft pdf. This layout presents information on cash, investments, personal, retirement, secured. It is also available for immediate download and adjustment. So, changes can be made in the color, design, graphics or any other component to create a unique layout.
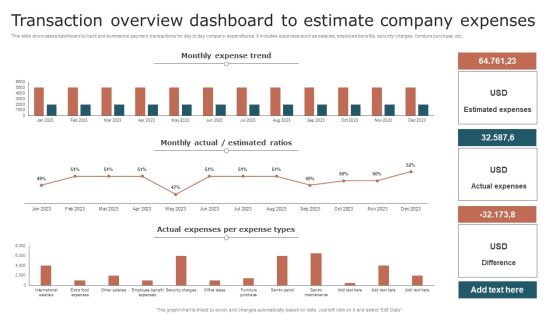
Transaction Overview Dashboard To Estimate Company Expenses Mockup PDF
This slide showcases dashboard to track and summarize payment transactions for day to day company expenditures. It includes expenses such as salaries, employee benefits, security charges, furniture purchase, etc. Showcasing this set of slides titled Transaction Overview Dashboard To Estimate Company Expenses Mockup PDF. The topics addressed in these templates are Monthly Expense Trend, Estimated Ratios, Actual Expenses. All the content presented in this PPT design is completely editable. Download it and make adjustments in color, background, font etc. as per your unique business setting.
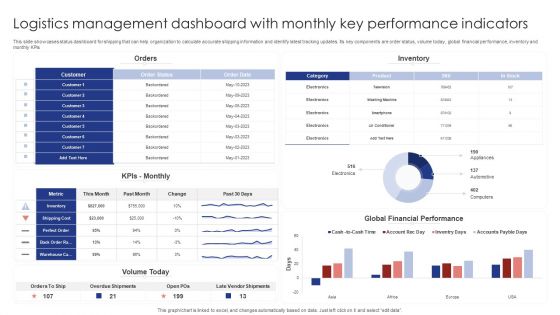
Logistics Management Dashboard With Monthly Key Performance Indicators Rules PDF
This slide showcases status dashboard for shipping that can help organization to calculate accurate shipping information and identify latest tracking updates. Its key components are order status, volume today, global financial performance, inventory and monthly KPIs. Pitch your topic with ease and precision using this Logistics Management Dashboard With Monthly Key Performance Indicators Rules PDF. This layout presents information on Orders, Inventory, Kpis Monthly. It is also available for immediate download and adjustment. So, changes can be made in the color, design, graphics or any other component to create a unique layout.

Earning Potential And Financial Forecasting Dashboard Summary PDF
This slide illustrates facts and figures related to sales figures. It includes data of monthly revenue generation FY23, yearly revenue, expected revenue generation FY23 etc. Pitch your topic with ease and precision using this Earning Potential And Financial Forecasting Dashboard Summary PDF. This layout presents information on Sales Revenue, Expected Revenue, Product. It is also available for immediate download and adjustment. So, changes can be made in the color, design, graphics or any other component to create a unique layout.

Agriculture Budgeting And Management Based On Dashboard Report Topics PDF
Following slide presents a dashboard that will assist farmers in planning and budgeting based on the key performance indicators. The key performance indicators are crop name, area, last production, current temperature, etc. Showcasing this set of slides titled Agriculture Budgeting And Management Based On Dashboard Report Topics PDF. The topics addressed in these templates are Production Details. All the content presented in this PPT design is completely editable. Download it and make adjustments in color, background, font etc. as per your unique business setting.

Promotional Budget Plan Analysis Dashboard For Startups Template PDF
This slide provides a dashboard for analysis of marketing budget plan that can be used by managers to optimize their advertisement strategies. It displays the comparison of total marketing budget of different companies, ROI, marketing campaign analysis and program budgets. Showcasing this set of slides titled Promotional Budget Plan Analysis Dashboard For Startups Template PDF. The topics addressed in these templates are Marketing Budget, Marketing Campaign, Competitive Analysis. All the content presented in this PPT design is completely editable. Download it and make adjustments in color, background, font etc. as per your unique business setting.
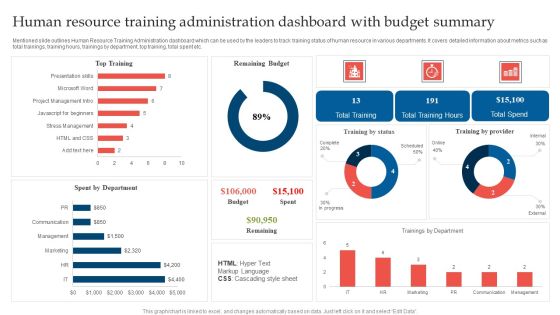
Human Resource Training Administration Dashboard With Budget Summary Microsoft PDF
Mentioned slide outlines Human Resource Training Administration dashboard which can be used by the leaders to track training status of human resource in various departments. It covers detailed information about metrics such as total trainings, training hours, trainings by department, top training, total spent etc. Showcasing this set of slides titled Human Resource Training Administration Dashboard With Budget Summary Microsoft PDF. The topics addressed in these templates are Remaining Budget, Top Training, Spent Department. All the content presented in this PPT design is completely editable. Download it and make adjustments in color, background, font etc. as per your unique business setting.

Dashboard To Track Overall IT Cost Ppt Background Designs PDF
This slide provides information regarding IT cost management dashboard to track IT costs breakdown, return on investment, budget monitoring, etc. Boost your pitch with our creative Dashboard To Track Overall IT Cost Ppt Background Designs PDF. Deliver an awe-inspiring pitch that will mesmerize everyone. Using these presentation templates you will surely catch everyones attention. You can browse the ppts collection on our website. We have researchers who are experts at creating the right content for the templates. So you do not have to invest time in any additional work. Just grab the template now and use them.
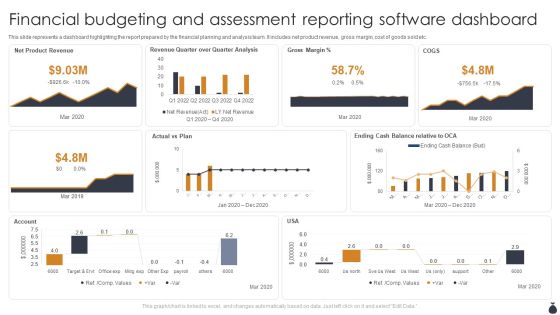
Financial Budgeting And Assessment Reporting Software Dashboard Template PDF
This slide represents a dashboard highlighting the report prepared by the financial planning and analysis team. It includes net product revenue, gross margin, cost of goods sold etc. Showcasing this set of slides titled Financial Budgeting And Assessment Reporting Software Dashboard Template PDF. The topics addressed in these templates are Net Product Revenue, Actual Vs Plan, Account. All the content presented in this PPT design is completely editable. Download it and make adjustments in color, background, font etc. as per your unique business setting.

Dashboard For Monitoring And Corporate Financial Statement Budgets Template PDF
This slide brings forth dashboard for monitoring and reporting the financial budgets of various branches of an enterprise emphasis on income and expenditure by each branch. The key performing indicators are actual vs budgeted revenue, revenue distribution by branches etc. Showcasing this set of slides titled Dashboard For Monitoring And Corporate Financial Statement Budgets Template PDF. The topics addressed in these templates are Revenue Distribution, Revenue Source, Revenue Expenses. All the content presented in this PPT design is completely editable. Download it and make adjustments in color, background, font etc. as per your unique business setting.

Budget Vs Actual Dashboard For Finance Department Brochure PDF
The slide illustrates the dashboard showing the income and expenses incurred by the finance department. The purpose of this slide is compare the budgeted figures with the actual cost, enabling effective analysis of financial activities. It include income budget, expense budget, and difference. Showcasing this set of slides titled Budget Vs Actual Dashboard For Finance Department Brochure PDF. The topics addressed in these templates are Income, Expenses, Expense Budget. All the content presented in this PPT design is completely editable. Download it and make adjustments in color, background, font etc. as per your unique business setting.
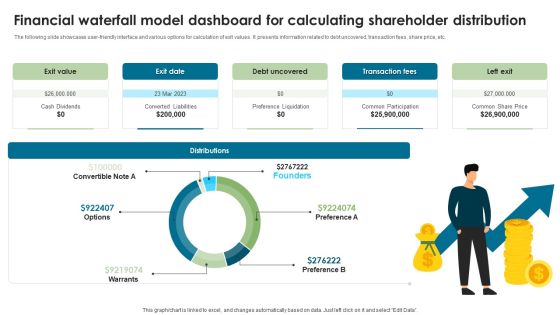
Financial Waterfall Model Dashboard For Calculating Shareholder Distribution Slides PDF
The following slide showcases user-friendly interface and various options for calculation of exit values. It presents information related to debt uncovered, transaction fees, share price, etc. Showcasing this set of slides titled Financial Waterfall Model Dashboard For Calculating Shareholder Distribution Slides PDF. The topics addressed in these templates are Exit Value, Exit Date, Debt Uncovered. All the content presented in this PPT design is completely editable. Download it and make adjustments in color, background, font etc. as per your unique business setting.

Sales Monitoring Dashboard With Monthly Qualified Leads Guidelines PDF
This slide showcases dashboard that can help organization to monitor the sales pipeline velocity and predict future sales more accurately plus increase the leads converted. Its key components are monthly qualified leads, win rate based on deal size, monthly sales cycle and number of leads at each stage of pipeline. Pitch your topic with ease and precision using this Sales Monitoring Dashboard With Monthly Qualified Leads Guidelines PDF. This layout presents information on Monthly Qualified, Monthly Sales Cycle, Deal Size. It is also available for immediate download and adjustment. So, changes can be made in the color, design, graphics or any other component to create a unique layout.

Energy Monitoring Dashboard With Emission Rate Mockup PDF
The slide showcases energy monitoring dashboard which showcases the monthly energy consumption and emission rate of a facility. It covers cost predicted, change in cost, usage estimate, energy intensity and carbon footprint or emission rate. Pitch your topic with ease and precision using this Energy Monitoring Dashboard With Emission Rate Mockup PDF. This layout presents information on Active Appliances, Cost Predicted, Energy Intensity. It is also available for immediate download and adjustment. So, changes can be made in the color, design, graphics or any other component to create a unique layout.

Dashboard For Big Healthcare Data Analytics Graphics PDF
This slide showcase the dashboard for big data analytics in healthcare. It includes elements such as bed occupancy rate, patient turnover rate, efficiency and costs, missed and cancelled appointment rate. Showcasing this set of slides titled Dashboard For Big Healthcare Data Analytics Graphics PDF. The topics addressed in these templates are Satisfaction Service Indicators, Occupancy, Forecasted Patient Turnover. All the content presented in this PPT design is completely editable. Download it and make adjustments in color, background, font etc. as per your unique business setting.
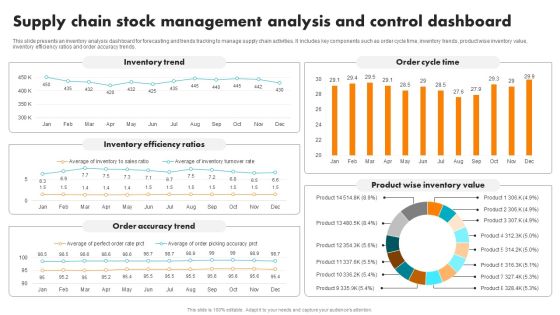
Supply Chain Stock Management Analysis And Control Dashboard Brochure PDF
This slide presents an inventory analysis dashboard for forecasting and trends tracking to manage supply chain activities. It includes key components such as order cycle time, inventory trends, product wise inventory value, inventory efficiency ratios and order accuracy trends. Pitch your topic with ease and precision using this Supply Chain Stock Management Analysis And Control Dashboard Brochure PDF. This layout presents information on Inventory Trend, Inventory Efficiency Ratios, Order Accuracy Trend, Order Cycle Time, Product Wise Inventory Value. It is also available for immediate download and adjustment. So, changes can be made in the color, design, graphics or any other component to create a unique layout.

Maintenance KPI Dashboard With Work Orders Ppt Gallery Model PDF
This slide focuses on maintenance dashboard which covers percentage of delayed start, finish, man hours actual versus estimate and work type such as preventive maintenance, calibration, corrective and emergency maintenance. Showcasing this set of slides titled Maintenance KPI Dashboard With Work Orders Ppt Gallery Model PDF. The topics addressed in these templates are Preventive Maintenance Callibration, Man Hours Actual, Delayed Finish Percent. All the content presented in this PPT design is completely editable. Download it and make adjustments in color, background, font etc. as per your unique business setting.
Logistics Management Time Tracking Dashboard With Warehousing Costs Template PDF
This slide showcases shipping dashboard that can help company to deliver the products in stipulated time and keep warehousing operating expenses within pre decided budget. Its also displays perfect order rate and total shipments by country. Pitch your topic with ease and precision using this Logistics Management Time Tracking Dashboard With Warehousing Costs Template PDF. This layout presents information on Warehouse Operating Costs, Perfect Order Rate, On Time Shipments. It is also available for immediate download and adjustment. So, changes can be made in the color, design, graphics or any other component to create a unique layout.
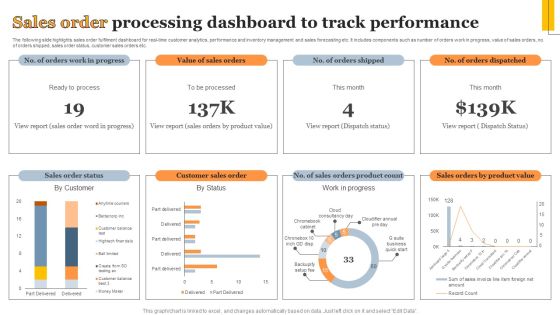
Sales Order Processing Dashboard To Track Performance Information PDF
The following slide highlights sales order fulfilment dashboard for real-time customer analytics, performance and inventory management and sales forecasting etc. It includes components such as number of orders work in progress, value of sales orders, no. of orders shipped, sales order status, customer sales orders etc. Showcasing this set of slides titled Sales Order Processing Dashboard To Track Performance Information PDF. The topics addressed in these templates are Sales Order Status, Customer Sales Order, Work Progress. All the content presented in this PPT design is completely editable. Download it and make adjustments in color, background, font etc. as per your unique business setting.

Business Process Management Dashboard Showing Pending Processes Graphics PDF
This slide shows the dashboard of business management by calculating the number of processes that are running as well as the ones that are completed. It also shows the unsettled or remaining process with average process duration. Showcasing this set of slides titled Business Process Management Dashboard Showing Pending Processes Graphics PDF. The topics addressed in these templates are Average Process, Time Span, Number Operations. All the content presented in this PPT design is completely editable. Download it and make adjustments in color, background, font etc. as per your unique business setting.

Logistics Management Revenue Analysis Dashboard With Orders Revenue Brochure PDF
This slide showcases shipping dashboard that can help company to calculate the revenue generated from delivered products and track the monthly order status. Its key components are highest revenue days, subscription revenue, order status, order revenue and transaction paid status. Showcasing this set of slides titled Logistics Management Revenue Analysis Dashboard With Orders Revenue Brochure PDF. The topics addressed in these templates are Order Revenue, Transaction Paid, Subscription Revenue. All the content presented in this PPT design is completely editable. Download it and make adjustments in color, background, font etc. as per your unique business setting.
