Executive Project Portfolio Dashboard

Market Report Of EDI Document Transport Pictures PDF
This slide provides glimpse about market analysis and future market forecast report of Electronic Data Interchange EDI system. It includes base year, historical data, forecast period, etc.Showcasing this set of slides titled Market Report Of EDI Document Transport Pictures PDF. The topics addressed in these templates are Segments Covered, Report Coverage, Retail Consumer. All the content presented in this PPT design is completely editable. Download it and make adjustments in color, background, font etc. as per your unique business setting.
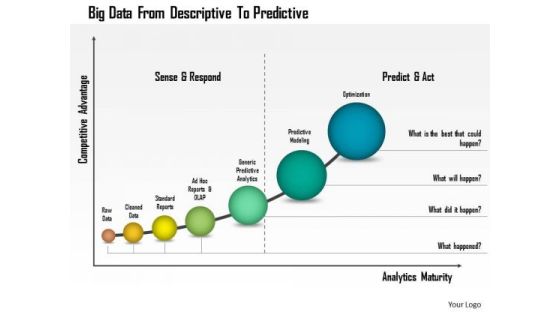
Business Diagram Big Data From Descriptive To Predictive Presentation Template
This business diagram has been designed with graphic of linear bar graph. This growing bar graph depicts the concept of big data analysis. Use this professional diagram for your financial and business analysis.

Challenges With Traditional Manufacturing System Formats PDF
This slide represents the challenges with traditional manufacturing systems and it includes the limitation on customization, supply chain disruptions, labour shortage, worker safety, and longer production time. These challenges cause a delay in projects. The Challenges With Traditional Manufacturing System Formats PDF is a compilation of the most recent design trends as a series of slides. It is suitable for any subject or industry presentation, containing attractive visuals and photo spots for businesses to clearly express their messages. This template contains a variety of slides for the user to input data, such as structures to contrast two elements, bullet points, and slides for written information. Slidegeeks is prepared to create an impression.

List Of Four Activities In The Procedure Web Design Business Plan PowerPoint Slides
We present our list of four activities in the procedure web design business plan PowerPoint Slides.Use our Marketing PowerPoint Templates because networking is an imperative in todays world. You need to access the views of others. Similarly you need to give access to them of your abilities. Download our Business PowerPoint Templates because Building castles in the sand is a danger and you are aware of. You have taken the precaution of building strong fundamentals. Present our Flow charts PowerPoint Templates because there is a vision, a need you can meet. Present our Process and Flows PowerPoint Templates because they pinpoint the core values of your organisation. Download and present our Arrows PowerPoint Templates because using our templates for your colleagues will impart knowledge to feed.Use these PowerPoint slides for presentations relating to Analysis, Analyze, Background, Business, Chart, Competition, Conceptual, Corporation, Create, Data, Decision, Design, Direction, Economic, Enterprise, Future, Graph, Idea, Illustration, Information, Innovate, Layout, Management, Marketing, Paper, Plan, Process, Product, Project, Science, Social. The prominent colors used in the PowerPoint template are Orange, Gray, Black. Presenters tell us our list of four activities in the procedure web design business plan PowerPoint Slides are Sparkling. Use our Conceptual PowerPoint templates and PPT Slides are Handsome. You can be sure our list of four activities in the procedure web design business plan PowerPoint Slides are Wonderful. Professionals tell us our Competition PowerPoint templates and PPT Slides are One-of-a-kind. Presenters tell us our list of four activities in the procedure web design business plan PowerPoint Slides will make the presenter look like a pro even if they are not computer savvy. PowerPoint presentation experts tell us our Competition PowerPoint templates and PPT Slides are the best it can get when it comes to presenting.

Predictive Data Model Lifecycle Of Predictive Analytics Model Diagrams PDF
This slide depicts the lifecycle of the predictive analytics model, and it includes highlighting and formulating a problem, data preparation, information exploration, transforming and choosing, making, validating, and deploying a model, and then evaluating and monitoring results. If you are looking for a format to display your unique thoughts, then the professionally designed Predictive Data Model Lifecycle Of Predictive Analytics Model Diagrams PDF is the one for you. You can use it as a Google Slides template or a PowerPoint template. Incorporate impressive visuals, symbols, images, and other charts. Modify or reorganize the text boxes as you desire. Experiment with shade schemes and font pairings. Alter, share or cooperate with other people on your work. Download Predictive Data Model Lifecycle Of Predictive Analytics Model Diagrams PDF and find out how to give a successful presentation. Present a perfect display to your team and make your presentation unforgettable.

Predictive Data Model Predictive Analytics Classification Model Introduction Formats PDF
This slide describes the overview of the classification model used in predictive analytics, including the questions it answers. It also contains algorithms used in this model, such as random forest, gradient boosted model, convolution neural network, bagging, and stacking. This Predictive Data Model Predictive Analytics Classification Model Introduction Formats PDF is perfect for any presentation, be it in front of clients or colleagues. It is a versatile and stylish solution for organizing your meetings. The Predictive Data Model Predictive Analytics Classification Model Introduction Formats PDF features a modern design for your presentation meetings. The adjustable and customizable slides provide unlimited possibilities for acing up your presentation. Slidegeeks has done all the homework before launching the product for you. So, do not wait, grab the presentation templates today

Financial Modelling Growth Reporting Workflow Formats PDF
This slide shows financial modelling report development workflow for forecasting the future ups and downs for business. It include steps such as considering historical data, analyzing historical performance and gathering future assumptions etc. Pitch your topic with ease and precision using this Financial Modelling Growth Reporting Workflow Formats PDF. This layout presents information on Forecast Financial Statements, Risk Assessment, Forecasting Assumptions. It is also available for immediate download and adjustment. So, changes can be made in the color, design, graphics or any other component to create a unique layout.
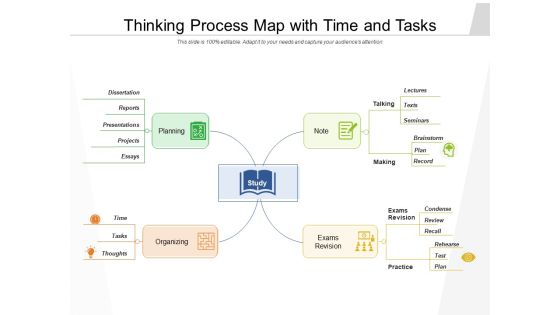
Thinking Process Map With Time And Tasks Ppt PowerPoint Presentation Slides Visuals PDF
Persuade your audience using this thinking process map with time and tasks ppt powerpoint presentation slides visuals pdf. This PPT design covers four stages, thus making it a great tool to use. It also caters to a variety of topics including planning, note, exams revision, organizing, dissertation, reports, presentations, projects, time. Download this PPT design now to present a convincing pitch that not only emphasizes the topic but also showcases your presentation skills.
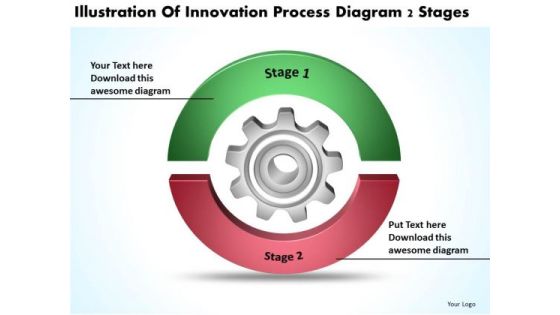
Innovation Process Diagram 2 Stages Graphic Design Business Plan PowerPoint Templates
We present our innovation process diagram 2 stages graphic design business plan PowerPoint templates.Download our Business PowerPoint Templates because You can Inspire your team with our PowerPoint Templates and Slides. Let the force of your ideas flow into their minds. Download our Gear Wheels PowerPoint Templates because Our PowerPoint Templates and Slides will Activate the energies of your audience. Get their creative juices flowing with your words. Download our Process and Flows PowerPoint Templates because Our PowerPoint Templates and Slides are endowed to endure. Ideas conveyed through them will pass the test of time. Download our Circle Charts PowerPoint Templates because You should Throw the gauntlet with our PowerPoint Templates and Slides. They are created to take up any challenge. Use our Shapes PowerPoint Templates because our PowerPoint Templates and Slides will give your ideas the shape.Use these PowerPoint slides for presentations relating to project, development, system, task, 3d, plan, data, process, design, leadership, isolated, requirement, collaboration, corporate, business, tag, concept, render, teamwork, graphic, schedule, goal, word, shape, gear, abstract, team, mind, management, creative, illustration, stage, connection, strategy, metaphor, company, organization, information, background, work, manager, structure. The prominent colors used in the PowerPoint template are Green, Red, Gray.
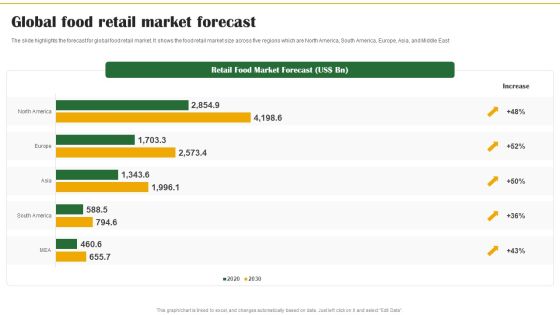
Food Organization Financial Trends Global Food Retail Market Forecast Formats PDF
The slide highlights the forecast for global food retail market. It shows the food retail market size across five regions which are North America, South America, Europe, Asia, and Middle East. Explore a selection of the finest Food Organization Financial Trends Global Food Retail Market Forecast Formats PDF here. With a plethora of professionally designed and pre-made slide templates, you can quickly and easily find the right one for your upcoming presentation. You can use our Food Organization Financial Trends Global Food Retail Market Forecast Formats PDF to effectively convey your message to a wider audience. Slidegeeks has done a lot of research before preparing these presentation templates. The content can be personalized and the slides are highly editable. Grab templates today from Slidegeeks.

How To Fix The Business Intelligence Problem Strategic Playbook For Data Analytics And Machine Learning Designs PDF
This template covers the solution for BI problems such as analytics transformation and business intelligence program. It also depicts that switching to next generation analytics platform that gives business users data driven insights. This is a How To Fix The Business Intelligence Problem Strategic Playbook For Data Analytics And Machine Learning Designs PDF template with various stages. Focus and dispense information on six stages using this creative set, that comes with editable features. It contains large content boxes to add your information on topics like Automated Data Analysis, Search Driven Analytics, Predictive Analytics. You can also showcase facts, figures, and other relevant content using this PPT layout. Grab it now.

3 Stages Corporate Organizational Chart Business Plan Template Free PowerPoint Slides
We present our 3 stages corporate organizational chart business plan template free PowerPoint Slides.Download and present our Marketing PowerPoint Templates because You have gained great respect for your brilliant ideas. Use our PowerPoint Templates and Slides to strengthen and enhance your reputation. Download and present our Finance PowerPoint Templates because Our PowerPoint Templates and Slides will let your words and thoughts hit bullseye everytime. Use our Boxes PowerPoint Templates because It will mark the footprints of your journey. Illustrate how they will lead you to your desired destination. Download and present our Org Charts PowerPoint Templates because Our PowerPoint Templates and Slides will generate and maintain the level of interest you desire. They will create the impression you want to imprint on your audience. Present our Business PowerPoint Templates because Our PowerPoint Templates and Slides are a sure bet. Gauranteed to win against all odds. Use these PowerPoint slides for presentations relating to arrow, box, business, chart, company, corporate, create, data, database, design, diagram, draw, flowchart, graph, idea, innovation, layout, marketing, note, organize, plan, program, project, sketch, structure, technical, worker. The prominent colors used in the PowerPoint template are Yellow, Gray, White.

7 Stages Concentric Flow Model Sample Business Plan Template PowerPoint Templates
We present our 7 stages concentric flow model sample business plan template PowerPoint templates.Download and present our Business PowerPoint Templates because It will get your audience in sync. Present our Venn Diagrams PowerPoint Templates because You have the co-ordinates for your destination of success. Let our PowerPoint Templates and Slides map out your journey. Download our Layers PowerPoint Templates because It can be used to Set your controls for the heart of the sun. Our PowerPoint Templates and Slides will be the propellant to get you there. Download and present our Circle Charts PowerPoint Templates because It will Raise the bar of your Thoughts. They are programmed to take you to the next level. Download our Shapes PowerPoint Templates because Our PowerPoint Templates and Slides will Embellish your thoughts. They will help you illustrate the brilliance of your ideas.Use these PowerPoint slides for presentations relating to diagram, process, business, graphic, design, ideas, model, data, chart, project, schema, corporate, implementation, tag, plan, engineering, concept, vector, success, symbol, stack, circle, guide, work flow, development, shape, team, management, cycle, steps, illustration, system, strategy, objects, phase, professional, organization, implement, background, image, detail, structure, product. The prominent colors used in the PowerPoint template are Green, Gray, White.
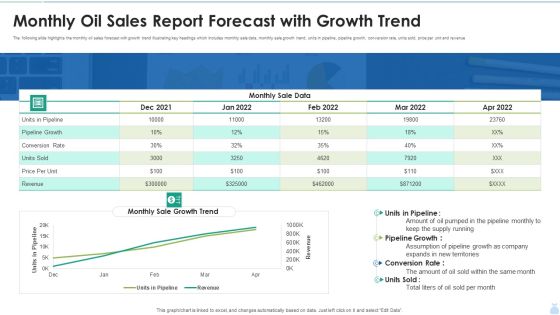
Monthly Oil Sales Report Forecast With Growth Trend Graphics PDF
The following slide highlights the monthly oil sales forecast with growth trend illustrating key headings which includes monthly sale data, monthly sale growth trend, units in pipeline, pipeline growth, conversion rate, units sold, price per unit and revenue. Showcasing this set of slides titled Monthly Oil Sales Report Forecast With Growth Trend Graphics PDF. The topics addressed in these templates are Pipeline Growth, Monthly Sale Data, Conversion Rate. All the content presented in this PPT design is completely editable. Download it and make adjustments in color, background, font etc. as per your unique business setting.

Predictive Analytics Methods Uses Of Predictive Analytics Underwriting Infographics PDF
This slide represents the application of predictive analytics in underwriting by insurance companies. Predictive analytics help them identify future claims by analyzing policyholders historical data patterns and existing risk collection. Do you have an important presentation coming up Are you looking for something that will make your presentation stand out from the rest Look no further than Predictive Analytics Methods Uses Of Predictive Analytics Underwriting Infographics PDF. With our professional designs, you can trust that your presentation will pop and make delivering it a smooth process. And with Slidegeeks, you can trust that your presentation will be unique and memorable. So why wait Grab Predictive Analytics Methods Uses Of Predictive Analytics Underwriting Infographics PDF today and make your presentation stand out from the rest.

Usa Ppt Background Linear Process 2 Phase Diagram Business Plan PowerPoint Graphic
USA PPT Background linear process 2 phase diagram business plan powerpoint Graphic-Visually support your ideas and define your message with our above template. This image identifies the concept of two options. Audience also understands the concepts of the presenter very easily and they get to know the clear picture of the topic\n-USA PPT Background linear process 2 phase diagram business plan powerpoint Graphic-Abstract, Achievement, Adding, Analyzing, Arrow, Art, Background, Blank, Blue, Business, Chart, Color, Colorful, Cycle, Data, Design, Diagram, Element, Flow, Graph, Graphic, Gray, Green, Icon, Linear, Management, Market, Numbers, Percent, Process, Project, Round, Stock, Success

Agenda Predictive Data Model Microsoft PDF
Do you have to make sure that everyone on your team knows about any specific topic I yes, then you should give Agenda Predictive Data Model Microsoft PDF a try. Our experts have put a lot of knowledge and effort into creating this impeccable Agenda Predictive Data Model Microsoft PDF. You can use this template for your upcoming presentations, as the slides are perfect to represent even the tiniest detail. You can download these templates from the Slidegeeks website and these are easy to edit. So grab these today

Calculate Facebook Key Performance Indicator Performance Sample PDF
Pitch your topic with ease and precision using this calculate facebook key performance indicator performance sample pdf. This layout presents information on calculate facebook key performance indicator performance. It is also available for immediate download and adjustment. So, changes can be made in the color, design, graphics or any other component to create a unique layout.

3 Stages Stacked Shapes Chart Simple Business Plan PowerPoint Slides
We present our 3 stages stacked shapes chart simple business plan PowerPoint Slides.Download and present our Business PowerPoint Templates because You can Double your output with our PowerPoint Templates and Slides. They make beating deadlines a piece of cake. Use our Venn Diagrams PowerPoint Templates because Our PowerPoint Templates and Slides are like the strings of a tennis racquet. Well strung to help you serve aces. Download and present our Layers PowerPoint Templates because You should Press the right buttons with our PowerPoint Templates and Slides. They will take your ideas down the perfect channel. Present our Circle Charts PowerPoint Templates because You can Channelise the thoughts of your team with our PowerPoint Templates and Slides. Urge them to focus on the goals you have set. Download our Shapes PowerPoint Templates because Our PowerPoint Templates and Slides will effectively help you save your valuable time. They are readymade to fit into any presentation structure. Use these PowerPoint slides for presentations relating to diagram, process, business, graphic, design, ideas, model, data, chart, project, schema, corporate, implementation, tag, plan, engineering, concept, vector, success, symbol, stack, circle, guide, work flow, development, shape, team, management, cycle, steps, illustration, system, strategy, objects, phase, professional, organization, implement, background, image, detail, structure, product. The prominent colors used in the PowerPoint template are Blue, Gray, White.

Toolkit For Data Science And Analytics Transition Business Case And Data Analytical Roadmap Professional PDF
This slide illustrates a detailed roadmap covering the key stages, priority tasks and action plan for the data analytics project. Do you know about Slidesgeeks Toolkit For Data Science And Analytics Transition Business Case And Data Analytical Roadmap Professional PDF These are perfect for delivering any kind od presentation. Using it, create PowerPoint presentations that communicate your ideas and engage audiences. Save time and effort by using our pre designed presentation templates that are perfect for a wide range of topic. Our vast selection of designs covers a range of styles, from creative to business, and are all highly customizable and easy to edit. Download as a PowerPoint template or use them as Google Slides themes.

Maintaining Upcoming Product Sales Forecasting Demonstration PDF
This slide provides information regarding management of new products sales that are to be launched in the market. The product sales data that needs to be tracked include unit price, unit cost, market size, operating income, etc. Coming up with a presentation necessitates that the majority of the effort goes into the content and the message you intend to convey. The visuals of a PowerPoint presentation can only be effective if it supplements and supports the story that is being told. Keeping this in mind our experts created Maintaining Upcoming Product Sales Forecasting Demonstration PDF to reduce the time that goes into designing the presentation. This way, you can concentrate on the message while our designers take care of providing you with the right template for the situation.

Methods Of Data Clustering In Predictive Analytics Forward Looking Analysis IT Professional PDF
This slide outlines the two primary information clustering methods used in the predictive analytics clustering model. The methods include K-means and K-nearest neighbor clustering, including the working of both approaches.Slidegeeks is here to make your presentations a breeze with Methods Of Data Clustering In Predictive Analytics Forward Looking Analysis IT Professional PDF With our easy-to-use and customizable templates, you can focus on delivering your ideas rather than worrying about formatting. With a variety of designs to choose from, you are sure to find one that suits your needs. And with animations and unique photos, illustrations, and fonts, you can make your presentation pop. So whether you are giving a sales pitch or presenting to the board, make sure to check out Slidegeeks first.
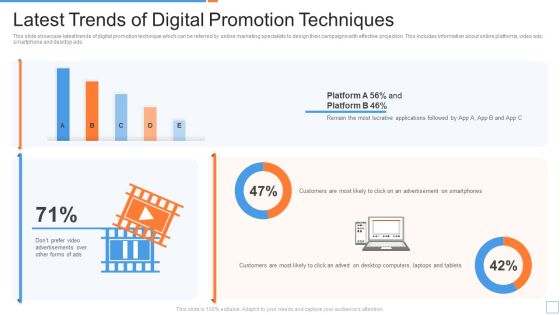
Latest Trends Of Digital Promotion Techniques Ppt PowerPoint Presentation Gallery Sample PDF
This slide showcase latest trends of digital promotion technique which can be referred by online marketing specialists to design their campaigns with effective projection. This includes information about online platforms, video ads, smartphone and desktop ads. Showcasing this set of slides titled Latest Trends Of Digital Promotion Techniques Ppt PowerPoint Presentation Gallery Sample PDF. The topics addressed in these templates are Customers, Advertisement, Smartphones. All the content presented in this PPT design is completely editable. Download it and make adjustments in color, background, font etc. as per your unique business setting.
Data Comparison In Core Diagram 6 Stages Ppt Business Plans For PowerPoint Templates
We present our data comparison in core diagram 6 stages ppt business plans for PowerPoint templates.Present our Business PowerPoint Templates because It can Bubble and burst with your ideas. Download and present our Leadership PowerPoint Templates because You have the co-ordinates for your destination of success. Let our PowerPoint Templates and Slides map out your journey. Download and present our Layers PowerPoint Templates because Our PowerPoint Templates and Slides will Activate the energies of your audience. Get their creative juices flowing with your words. Present our Circle Charts PowerPoint Templates because Our PowerPoint Templates and Slides team portray an attitude of elegance. Personify this quality by using them regularly. Download our Shapes PowerPoint Templates because Our PowerPoint Templates and Slides will weave a web of your great ideas. They are gauranteed to attract even the most critical of your colleagues.Use these PowerPoint slides for presentations relating to Diagram, process, business, graphic, design, ideas, model, data, chart, project, schema, corporate, implementation, tag, plan, engineering, concept, vector, success, symbol, stack, circle, guide, work flow, development, shape, team, management, cycle, steps, illustration, system, strategy, objects, phase, professional, organization, implement, background, image, detail, structure, product. The prominent colors used in the PowerPoint template are Blue , Gray, White.
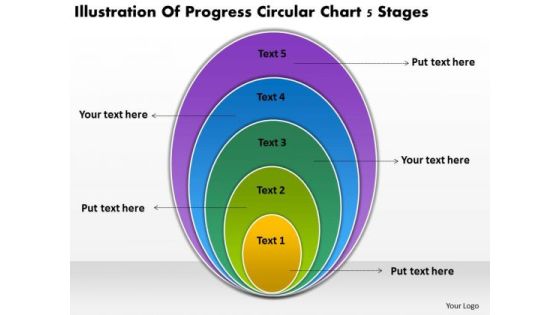
Progress Circular Chart 5 Stages Start Up Business Plan Template PowerPoint Templates
We present our progress circular chart 5 stages start up business plan template PowerPoint templates.Download and present our Business PowerPoint Templates because our PowerPoint Templates and Slides are the string of your bow. Fire of your ideas and conquer the podium. Present our Shapes PowerPoint Templates because You can Hit the nail on the head with our PowerPoint Templates and Slides. Embed your ideas in the minds of your audience. Download and present our Signs PowerPoint Templates because It can be used to Set your controls for the heart of the sun. Our PowerPoint Templates and Slides will be the propellant to get you there. Download our Success PowerPoint Templates because Our PowerPoint Templates and Slides will provide you a launch platform. Give a lift off to your ideas and send them into orbit. Present our Metaphors-Visual Concepts PowerPoint Templates because Our PowerPoint Templates and Slides will let your team Walk through your plans. See their energy levels rise as you show them the way.Use these PowerPoint slides for presentations relating to background, business, chart, circle, circular, color, concept, corporate, cycle, data, design, detail, development, diagram, engineering, graphic, guide, ideas, illustration, image, implement, implementation, management, model, objects, organization, phase, plan, process, product, professional, project, pyramid, schema, shape, stack, steps, strategy, structure, success, symbol, system, tag, team, vector, work flow. The prominent colors used in the PowerPoint template are Blue, Green, Yellow.

3 Stages Circular Stacked Chart How To Plan Business PowerPoint Templates
We present our 3 stages circular stacked chart how to plan business PowerPoint templates.Use our Business PowerPoint Templates because Our PowerPoint Templates and Slides are truly out of this world. Even the MIB duo has been keeping tabs on our team. Present our Shapes PowerPoint Templates because Watching this your Audience will Grab their eyeballs, they wont even blink. Present our Signs PowerPoint Templates because You will get more than you ever bargained for. Present our Success PowerPoint Templates because you can Add colour to your speech with our PowerPoint Templates and Slides. Your presentation will leave your audience speechless. Use our Metaphors-Visual Concepts PowerPoint Templates because It will Give impetus to the hopes of your colleagues. Our PowerPoint Templates and Slides will aid you in winning their trust.Use these PowerPoint slides for presentations relating to background, business, chart, circle, circular, color, concept, corporate, cycle, data, design, detail, development, diagram, engineering, graphic, guide, ideas, illustration, image, implement, implementation, management, model, objects, organization, phase, plan, process, product, professional, project, pyramid, schema, shape, stack, steps, strategy, structure, success, symbol, system, tag, team, vector, work flow. The prominent colors used in the PowerPoint template are Blue, Green, Yellow.

Cloud Intelligence Framework For Application Consumption Technological Components Of Intelligent Infrastructure Smart City Clipart PDF
The slide provides the key details about technological components of intelligent infrastructure in smart city projects. Major components covered in the slide are sensor-technology, high-speed communications, high-volume data storage, high-capacity data processing etc. Presenting cloud intelligence framework for application consumption technological components of intelligent infrastructure smart city clipart pdf to provide visual cues and insights. Share and navigate important information on four stages that need your due attention. This template can be used to pitch topics like data processing, communications, sensor technology, strategy formulation, processing stations. In addtion, this PPT design contains high resolution images, graphics, etc, that are easily editable and available for immediate download.

Best Practices For Forecasting Stock Inventory Management Topics PDF
The following slide depicts the key practices to effectively manage and forecast inventory. It includes elements such as data precision, plan for future needs, employ software, integrate with teams etc. Showcasing this set of slides titled Best Practices For Forecasting Stock Inventory Management Topics PDF. The topics addressed in these templates are Data Precision, Plan For Future, Employ Software. All the content presented in this PPT design is completely editable. Download it and make adjustments in color, background, font etc. as per your unique business setting.
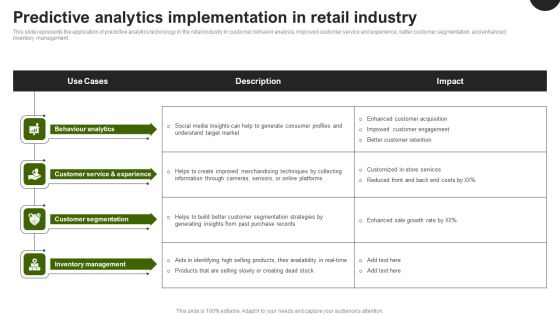
Predictive Analytics In The Age Of Big Data Predictive Analytics Implementation In Retail Industry Themes PDF
This slide represents the application of predictive analytics technology in the retail industry in customer behavior analysis, improved customer service and experience, better customer segmentation, and enhanced inventory management. Coming up with a presentation necessitates that the majority of the effort goes into the content and the message you intend to convey. The visuals of a PowerPoint presentation can only be effective if it supplements and supports the story that is being told. Keeping this in mind our experts created Predictive Analytics In The Age Of Big Data Predictive Analytics Implementation In Retail Industry Themes PDF to reduce the time that goes into designing the presentation. This way, you can concentrate on the message while our designers take care of providing you with the right template for the situation.

7 Stages Business Process Flow Diagram Ppt Plan Model PowerPoint Templates
We present our 7 stages business process flow diagram ppt plan model PowerPoint templates.Present our Business PowerPoint Templates because Our PowerPoint Templates and Slides will embellish your thoughts. See them provide the desired motivation to your team. Download and present our Venn Diagrams PowerPoint Templates because It will Give impetus to the hopes of your colleagues. Our PowerPoint Templates and Slides will aid you in winning their trust. Present our Layers PowerPoint Templates because Our PowerPoint Templates and Slides will let you Illuminate the road ahead to Pinpoint the important landmarks along the way. Download and present our Circle Charts PowerPoint Templates because You aspire to touch the sky with glory. Let our PowerPoint Templates and Slides provide the fuel for your ascent. Download our Shapes PowerPoint Templates because Our PowerPoint Templates and Slides offer you the widest possible range of options.Use these PowerPoint slides for presentations relating to diagram, process, business, graphic, design, ideas, model, data, chart, project, schema, corporate, implementation, tag, plan, engineering, concept, vector, success, symbol, stack, circle, guide, work flow, development, shape, team, management, cycle, steps, illustration, system, strategy, objects, phase, professional, organization, implement, background, image, detail, structure, product. The prominent colors used in the PowerPoint template are Blue, Black, Gray.

Calculate Facebook Key Performance Indicator The Engagement Rate Background PDF
Persuade your audience using this calculate facebook key performance indicator the engagement rate background pdf. This PPT design covers four stages, thus making it a great tool to use. It also caters to a variety of topics including calculate facebook key performance indicator the engagement rate. Download this PPT design now to present a convincing pitch that not only emphasizes the topic but also showcases your presentation skills.
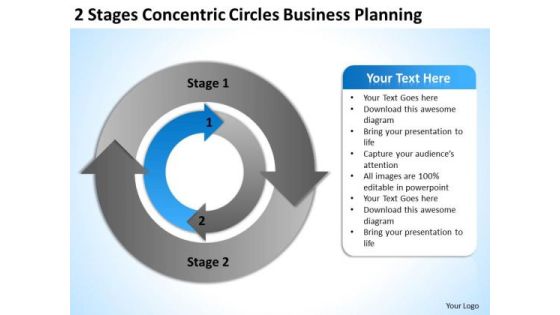
Business PowerPoint Templates Free Download Planning Model Slides
We present our business powerpoint templates free download planning model Slides.Present our Business PowerPoint Templates because They will Put your wonderful verbal artistry on display. Our PowerPoint Templates and Slides will provide you the necessary glam and glitter. Download our Signs PowerPoint Templates because Our PowerPoint Templates and Slides will let you Hit the right notes. Watch your audience start singing to your tune. Present our Process and Flows PowerPoint Templates because Our PowerPoint Templates and Slides are truly out of this world. Even the MIB duo has been keeping tabs on our team. Download and present our Arrows PowerPoint Templates because Our PowerPoint Templates and Slides are designed to help you succeed. They have all the ingredients you need. Download and present our Circle Charts PowerPoint Templates because You are well armed with penetrative ideas. Our PowerPoint Templates and Slides will provide the gunpowder you need.Use these PowerPoint slides for presentations relating to project, development, system, task, 3d, plan, data, process, design, leadership, isolated, requirement, collaboration, corporate, business, tag, concept, render, teamwork, graphic, schedule, goal, word, shape, gear, abstract, team, mind, management, creative, illustration, stage, connection, strategy, metaphor, company, organization, information, background, work, manager, structure. The prominent colors used in the PowerPoint template are Green, Gray, White.

Data Interpretation And Analysis Playbook Business Intelligence And Predictive Analytics Challenges Template PDF
This template covers the problems while implementing BI and predictive analytics in the organization. The challenges are undefined KPIs and metrics, and unable to hire right data science talent. Presenting data interpretation and analysis playbook business intelligence and predictive analytics challenges template pdf to provide visual cues and insights. Share and navigate important information on two stages that need your due attention. This template can be used to pitch topics like security vulnerabilities, operationalizing, perform analysis, deployed. In addtion, this PPT design contains high resolution images, graphics, etc, that are easily editable and available for immediate download.

Data Evaluation And Processing Toolkit Training Skills Plan For Data Analytics Program Download PDF
This slide illustrates the training plan by analyzing the key skills required data analytics project. Formulating a presentation can take up a lot of effort and time, so the content and message should always be the primary focus. The visuals of the PowerPoint can enhance the presenters message, so our Data Evaluation And Processing Toolkit Training Skills Plan For Data Analytics Program Download PDF was created to help save time. Instead of worrying about the design, the presenter can concentrate on the message while our designers work on creating the ideal templates for whatever situation is needed. Slidegeeks has experts for everything from amazing designs to valuable content, we have put everything into Data Evaluation And Processing Toolkit Training Skills Plan For Data Analytics Program Download PDF.

7 Stages Concentric Flow Model Business Financial Planning PowerPoint Slides
We present our 7 stages concentric flow model business financial planning PowerPoint Slides.Present our Business PowerPoint Templates because you should Whip up a frenzy with our PowerPoint Templates and Slides. They will fuel the excitement of your team. Use our Venn Diagrams PowerPoint Templates because our bewitching PowerPoint Templates and Slides will delight your audience with the magic of your words. Download and present our Layers PowerPoint Templates because Our PowerPoint Templates and Slides are Clear and concise. Use them and dispel any doubts your team may have. Present our Circle Charts PowerPoint Templates because You can Score a slam dunk with our PowerPoint Templates and Slides. Watch your audience hang onto your every word. Download and present our Shapes PowerPoint Templates because You can Stir your ideas in the cauldron of our PowerPoint Templates and Slides. Cast a magic spell on your audience.Use these PowerPoint slides for presentations relating to diagram, process, business, graphic, design, ideas, model, data, chart, project, schema, corporate, implementation, tag, plan, engineering, concept, vector, success, symbol, stack, circle, guide, work flow, development, shape, team, management, cycle, steps, illustration, system, strategy, objects, phase, professional, organization, implement, background, image, detail, structure, product. The prominent colors used in the PowerPoint template are Pink, Gray, White.
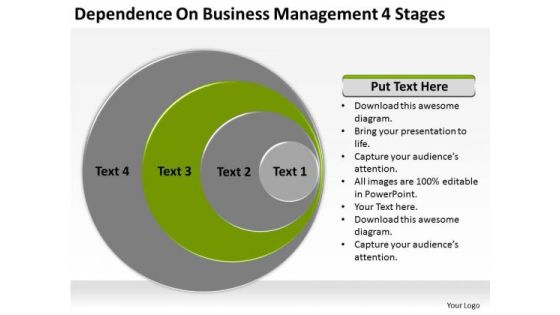
Dependence On Business Management 4 Stages Ppt Plan PowerPoint Slides
We present our dependence on business management 4 stages ppt plan PowerPoint Slides.Download and present our Business PowerPoint Templates because These PowerPoint Templates and Slides will give the updraft to your ideas. See them soar to great heights with ease. Download and present our Circle Charts PowerPoint Templates because Our PowerPoint Templates and Slides will let your team Walk through your plans. See their energy levels rise as you show them the way. Use our Layers PowerPoint Templates because Our PowerPoint Templates and Slides will let your ideas bloom. Create a bed of roses for your audience. Download our Circle Charts PowerPoint Templates because Our PowerPoint Templates and Slides will let you Clearly mark the path for others to follow. Present our Shapes PowerPoint Templates because our PowerPoint Templates and Slides are the string of your bow. Fire of your ideas and conquer the podium.Use these PowerPoint slides for presentations relating to Diagram, process, business, graphic, design, ideas, model, data, chart, project, schema, corporate, implementation, tag, plan, engineering, concept, vector, success, symbol, stack, circle, guide, work flow, development, shape, team, management, cycle, steps, illustration, system, strategy, objects, phase, professional, organization, implement, background, image, detail, structure, product. The prominent colors used in the PowerPoint template are Green, White, Gray.

Business Policy And Strategy To Many 5 Stages Flow Chart Concepts
We present our business policy and strategy to many 5 stages flow chart concepts.Download and present our Process and Flows PowerPoint Templates because They will bring a lot to the table. Their alluring flavours will make your audience salivate. Download our Circle Charts PowerPoint Templates because Our PowerPoint Templates and Slides are conceived by a dedicated team. Use them and give form to your wondrous ideas. Download our Flow Charts PowerPoint Templates because Our PowerPoint Templates and Slides will let you meet your Deadlines. Download and present our Shapes PowerPoint Templates because Our PowerPoint Templates and Slides will let you meet your Deadlines. Download our Business PowerPoint Templates because It will let you Set new benchmarks with our PowerPoint Templates and Slides. They will keep your prospects well above par.Use these PowerPoint slides for presentations relating to Arrow, box, business, chart, company, corporate, create, data, database, design, diagram, draw, flowchart, graph, idea, innovation, layout, marketing, note, organize, plan, program, project, sketch, structure, technical, worker, write. The prominent colors used in the PowerPoint template are Blue, Gray, White.

7 Stages Concentric Flow Model Business Plan PowerPoint Slides
We present our 7 stages concentric flow model business plan PowerPoint Slides.Download and present our Business PowerPoint Templates because you can Add colour to your speech with our PowerPoint Templates and Slides. Your presentation will leave your audience speechless. Download our Venn Diagrams PowerPoint Templates because It can be used to Set your controls for the heart of the sun. Our PowerPoint Templates and Slides will be the propellant to get you there. Present our Layers PowerPoint Templates because You will get more than you ever bargained for. Download our Circle Charts PowerPoint Templates because Our PowerPoint Templates and Slides will let you Clearly mark the path for others to follow. Use our Shapes PowerPoint Templates because You canTake a leap off the starting blocks with our PowerPoint Templates and Slides. They will put you ahead of the competition in quick time.Use these PowerPoint slides for presentations relating to diagram, process, business, graphic, design, ideas, model, data, chart, project, schema, corporate, implementation, tag, plan, engineering, concept, vector, success, symbol, stack, circle, guide, work flow, development, shape, team, management, cycle, steps, illustration, system, strategy, objects, phase, professional, organization, implement, background, image, detail, structure, product. The prominent colors used in the PowerPoint template are Green lime, Gray, White.

6 Stages Systematic Concentric Process Diagram Online Business Plan PowerPoint Slides
We present our 6 stages systematic concentric process diagram online business plan PowerPoint Slides.Download our Business PowerPoint Templates because Our PowerPoint Templates and Slides will let you Illuminate the road ahead to Pinpoint the important landmarks along the way. Present our Venn Diagrams PowerPoint Templates because Your audience will believe you are the cats whiskers. Download our Layers PowerPoint Templates because you can Add colour to your speech with our PowerPoint Templates and Slides. Your presentation will leave your audience speechless. Present our Circle Charts PowerPoint Templates because Our PowerPoint Templates and Slides offer you the needful to organise your thoughts. Use them to list out your views in a logical sequence. Present our Shapes PowerPoint Templates because Our PowerPoint Templates and Slides will let your team Walk through your plans. See their energy levels rise as you show them the way.Use these PowerPoint slides for presentations relating to diagram, process, business, graphic, design, ideas, model, data, chart, project, schema, corporate, implementation, tag, plan, engineering, concept, vector, success, symbol, stack, circle, guide, work flow, development, shape, team, management, cycle, steps, illustration, system, strategy, objects, phase, professional, organization, implement, background, image, detail, structure, product. The prominent colors used in the PowerPoint template are Blue, Black, Gray.

Comparative Analysis Of Manufacturing Data Analytics Software Solutions Elements PDF
This slide represents the comparison between different software solutions provided for manufacturing analytics. It includes fault prediction, preventive maintenance, demand forecasting, robotization, inventory management , product development etc. Showcasing this set of slides titled Comparative Analysis Of Manufacturing Data Analytics Software Solutions Elements PDF. The topics addressed in these templates are Preventive Maintenance, Inventory Management, Risk Management. All the content presented in this PPT design is completely editable. Download it and make adjustments in color, background, font etc. as per your unique business setting.

Five Kpis For Forecasting Stock Inventory And Management Pictures PDF
The following slide highlights some KPIs for better inventory management and accordingly plan production. It includes elements such as inventory turnover, average days to sell inventory, average inventory, inventory write-off, holding cost etc. Showcasing this set of slides titled Five Kpis For Forecasting Stock Inventory And Management Pictures PDF. The topics addressed in these templates are Holding Costs, Average Inventory, Inventory Turnover. All the content presented in this PPT design is completely editable. Download it and make adjustments in color, background, font etc. as per your unique business setting.
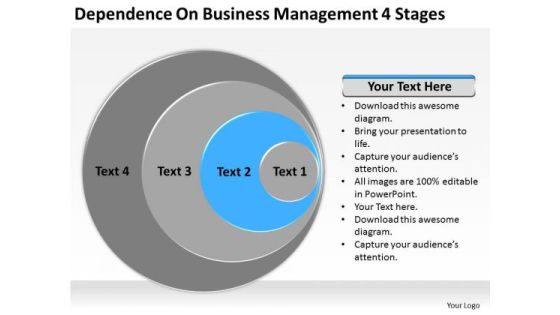
Dependence On Business Management 4 Stages Ppt Plan PowerPoint Templates
We present our dependence on business management 4 stages ppt plan PowerPoint templates.Download and present our Business PowerPoint Templates because Our PowerPoint Templates and Slides are created by a hardworking bunch of busybees. Always flitting around with solutions gauranteed to please. Present our Circle Charts PowerPoint Templates because Our PowerPoint Templates and Slides will give good value for money. They also have respect for the value of your time. Use our Layers PowerPoint Templates because Our PowerPoint Templates and Slides will let you Illuminate the road ahead to Pinpoint the important landmarks along the way. Download and present our Circle Charts PowerPoint Templates because Our PowerPoint Templates and Slides will fulfill your every need. Use them and effectively satisfy the desires of your audience. Download and present our Shapes PowerPoint Templates because Our PowerPoint Templates and Slides provide you with a vast range of viable options. Select the appropriate ones and just fill in your text. Use these PowerPoint slides for presentations relating to Diagram, process, business, graphic, design, ideas, model, data, chart, project, schema, corporate, implementation, tag, plan, engineering, concept, vector, success, symbol, stack, circle, guide, work flow, development, shape, team, management, cycle, steps, illustration, system, strategy, objects, phase, professional, organization, implement, background, image, detail, structure, product. The prominent colors used in the PowerPoint template are Blue, Gray, Black.

Marketing Mix Modelling Ppt PowerPoint Presentation Good
This is a marketing mix modelling ppt powerpoint presentation good. This is a eight stage process. The stages in this process are market research, implementation, data analysis, interpretation, communication, modelling, data collection, budget allocation.

Data Evaluation And Processing Toolkit Data Analytics Program Checklist Inspiration PDF
This slide shows progress status of data analytics process which includes important key tasks that must be performed while initiating a project. If you are looking for a format to display your unique thoughts, then the professionally designed Data Evaluation And Processing Toolkit Data Analytics Program Checklist Inspiration PDF is the one for you. You can use it as a Google Slides template or a PowerPoint template. Incorporate impressive visuals, symbols, images, and other charts. Modify or reorganize the text boxes as you desire. Experiment with shade schemes and font pairings. Alter, share or cooperate with other people on your work. Download Data Evaluation And Processing Toolkit Data Analytics Program Checklist Inspiration PDF and find out how to give a successful presentation. Present a perfect display to your team and make your presentation unforgettable.

7 Stages Business Process Flow Diagram Ppt Basic Plan PowerPoint Slides
We present our 7 stages business process flow diagram ppt basic plan PowerPoint Slides.Present our Business PowerPoint Templates because Our PowerPoint Templates and Slides will generate and maintain the level of interest you desire. They will create the impression you want to imprint on your audience. Download our Venn Diagrams PowerPoint Templates because Our PowerPoint Templates and Slides come in all colours, shades and hues. They help highlight every nuance of your views. Present our Layers PowerPoint Templates because It will let you Set new benchmarks with our PowerPoint Templates and Slides. They will keep your prospects well above par. Download our Circle Charts PowerPoint Templates because our PowerPoint Templates and Slides are the string of your bow. Fire of your ideas and conquer the podium. Present our Shapes PowerPoint Templates because Our PowerPoint Templates and Slides offer you the needful to organise your thoughts. Use them to list out your views in a logical sequence.Use these PowerPoint slides for presentations relating to diagram, process, business, graphic, design, ideas, model, data, chart, project, schema, corporate, implementation, tag, plan, engineering, concept, vector, success, symbol, stack, circle, guide, work flow, development, shape, team, management, cycle, steps, illustration, system, strategy, objects, phase, professional, organization, implement, background, image, detail, structure, product. The prominent colors used in the PowerPoint template are Blue, Black, Gray.

Calculate Facebook Key Performance Indicator Campaign Success Template PDF
Pitch your topic with ease and precision using this calculate facebook key performance indicator campaign success template pdf. This layout presents information on calculate facebook key performance indicator campaign success. It is also available for immediate download and adjustment. So, changes can be made in the color, design, graphics or any other component to create a unique layout.
Five Different Types Of Calculate Facebook Key Performance Indicator Results Icons PDF
Pitch your topic with ease and precision using this five different types of calculate facebook key performance indicator results icons pdf. This layout presents information on reach kpis, traffic kpis, engagement kpis, conversions kpis, brand awareness kpis. It is also available for immediate download and adjustment. So, changes can be made in the color, design, graphics or any other component to create a unique layout.

Ppt 7 Power Point Stage Social Backgrounds Linear Process PowerPoint Templates
PPT 7 power point stage social backgrounds linear process PowerPoint Templates-Create visually stimulating Microsoft office PPT Presentations with our above Diagram. It shows seven different layers placed in horizontal manner. It shows the successive concepts used in a procedure. This diagram will fit for Business Presentations. An excellent graphic to attract the attention of your audience to improve earnings.-PPT 7 power point stage social backgrounds linear process PowerPoint Templates-achievement, adding, analyzing, arrow, art, background, blank, business, chart, colorful, cycle, data, design, diagram, element, flow, graph, graphic, gray, icon, linear, magenta, management, market, numbers, orange, percent, process, project, round, stock, success, up, value

Production Procedures To Enhance Quality And Productivity Improvement With Operation Management Strategies Rules PDF
The slide presents some strategies that can be adopted by operation managers to improve production quality and productivity. it includes designing and data importance in process, inventory analysis, future projections, collaborating, being environment friendly and full documentation. Persuade your audience using this Production Procedures To Enhance Quality And Productivity Improvement With Operation Management Strategies Rules PDF. This PPT design covers five stages, thus making it a great tool to use. It also caters to a variety of topics including Designing And Importance, Data Process Building, Collaborating, Being Environment Friendly. Download this PPT design now to present a convincing pitch that not only emphasizes the topic but also showcases your presentation skills.

Layers And Levels Business Management 3 Stages Ppt Plans Sample PowerPoint Slides
We present our layers and levels business management 3 stages ppt plans sample PowerPoint Slides.Present our Leadership PowerPoint Templates because Our PowerPoint Templates and Slides help you meet the demand of the Market. Just browse and pick the slides that appeal to your intuitive senses. Present our Success PowerPoint Templates because Our PowerPoint Templates and Slides are created by a hardworking bunch of busybees. Always flitting around with solutions gauranteed to please. Download our Ladders PowerPoint Templates because Our PowerPoint Templates and Slides offer you the needful to organise your thoughts. Use them to list out your views in a logical sequence. Download and present our Layers PowerPoint Templates because Our PowerPoint Templates and Slides come in all colours, shades and hues. They help highlight every nuance of your views. Use our Business PowerPoint Templates because You can Stir your ideas in the cauldron of our PowerPoint Templates and Slides. Cast a magic spell on your audience.Use these PowerPoint slides for presentations relating to Diagram, data, pyramid, square, model, corporate, implementation, business, plan, engineering, concept, vector, success, symbol, stack, guide, graphic, process, work flow, development, shape, team, management, box, steps, illustration, chart, system, strategy, project, reflection, design, objects, phase, professional, organization, implement, detail, structure, product, ideas. The prominent colors used in the PowerPoint template are Blue, Gray, White.
Predictive Modeling Process Flow In Logistics Icons PDF
This slide showcases Predictive modeling which enables production and distribution optimization through better throughput, quality and safety. It provides details about historical data, predictive analytics model, forecast visualization, integrated custom analytics, etc. Get a simple yet stunning designed Predictive Modeling Process Flow In Logistics Icons PDF. It is the best one to establish the tone in your meetings. It is an excellent way to make your presentations highly effective. So, download this PPT today from Slidegeeks and see the positive impacts. Our easy-to-edit Predictive Modeling Process Flow In Logistics Icons PDF can be your go-to option for all upcoming conferences and meetings. So, what are you waiting for Grab this template today.

Data Analytics Software Features Business Analysis Modification Toolkit Formats PDF
This slide represents the key features of predictive data analytics including data mining, data visualization, and modelling etc.Presenting Data Analytics Software Features Business Analysis Modification Toolkit Formats PDF to provide visual cues and insights. Share and navigate important information on eight stages that need your due attention. This template can be used to pitch topics like Predictive Modeling, Data Unification, Data Visualization. In addtion, this PPT design contains high resolution images, graphics, etc, that are easily editable and available for immediate download.

Stock Market Research Report Methods Used For Valuation In Equity Research Guidelines PDF
The following slide displays the equity valuation methods such as balance sheet methods, earning multiple methods and discounted cash flow method. Presenting stock market research report methods used for valuation in equity research guidelines pdf to provide visual cues and insights. Share and navigate important information on seven stages that need your due attention. This template can be used to pitch topics like relative valuation approach, discounted cash flow, projections, discount rate, present value, sensitivity analysis, terminal value, adjustments. In addition, this PPT design contains high-resolution images, graphics, etc, that are easily editable and available for immediate download.
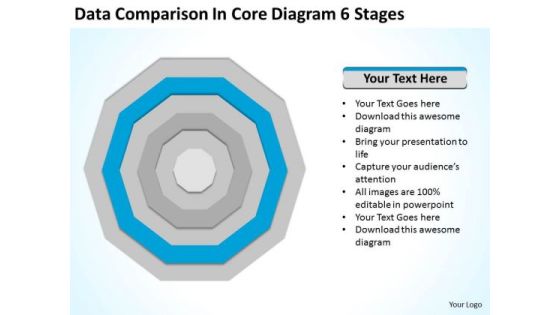
Data Comparison In Core Diagram 6 Stages How Do Make Business Plan PowerPoint Templates
We present our data comparison in core diagram 6 stages how do make business plan PowerPoint templates.Download our Business PowerPoint Templates because Our PowerPoint Templates and Slides will let you meet your Deadlines. Download our Leadership PowerPoint Templates because They will Put your wonderful verbal artistry on display. Our PowerPoint Templates and Slides will provide you the necessary glam and glitter. Present our Layers PowerPoint Templates because You are working at that stage with an air of royalty. Let our PowerPoint Templates and Slides be the jewels in your crown. Download and present our Circle Charts PowerPoint Templates because Our PowerPoint Templates and Slides are topically designed to provide an attractive backdrop to any subject. Use our Shapes PowerPoint Templates because Timeline crunches are a fact of life. Meet all deadlines using our PowerPoint Templates and Slides.Use these PowerPoint slides for presentations relating to Diagram, process, business, graphic, design, ideas, model, data, chart, project, schema, corporate, implementation, tag, plan, engineering, concept, vector, success, symbol, stack, circle, guide, work flow, development, shape, team, management, cycle, steps, illustration, system, strategy, objects, phase, professional, organization, implement, background, image, detail, structure, product. The prominent colors used in the PowerPoint template are Blue , Gray, White.
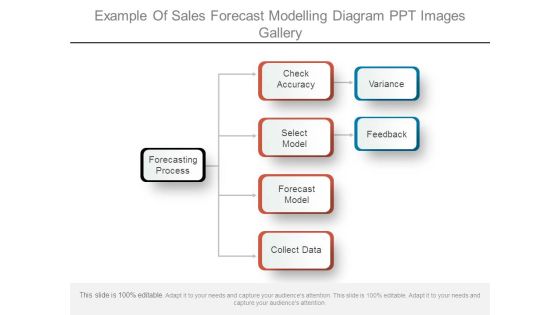
Example Of Sales Forecast Modelling Diagram Ppt Images Gallery
This is a example of sales forecast modelling diagram ppt images gallery. This is a three stage process. The stages in this process are forecasting process, check accuracy, select model, forecast model, collect data, variance, feedback.
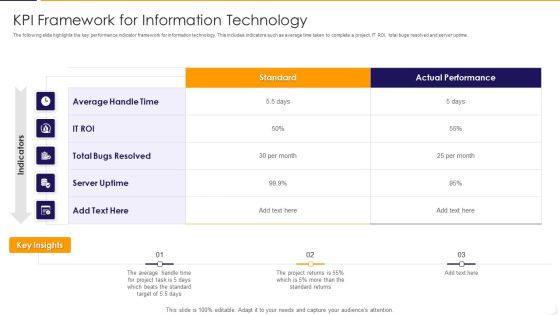
KPI Framework For Information Technology Ppt PowerPoint Presentation Gallery Clipart Images PDF
The following slide highlights the key performance indicator framework for information technology. This includes indicators such as average time taken to complete a project, IT ROI, total bugs resolved and server uptime. Showcasing this set of slides titled kpi framework for information technology ppt powerpoint presentation gallery clipart images pdf The topics addressed in these templates are average, target, performance All the content presented in this PPT design is completely editable. Download it and make adjustments in color, background, font etc. as per your unique business setting.

5 Stages Multicolored Flow Chart With Gears Laundromat Business Plan PowerPoint Slides
We present our 5 stages multicolored flow chart with gears laundromat business plan PowerPoint Slides.Present our Business PowerPoint Templates because Our PowerPoint Templates and Slides help you meet the demand of the Market. Just browse and pick the slides that appeal to your intuitive senses. Download and present our Gear Wheels PowerPoint Templates because Our PowerPoint Templates and Slides will weave a web of your great ideas. They are gauranteed to attract even the most critical of your colleagues. Present our Process and Flows PowerPoint Templates because Our PowerPoint Templates and Slides are created by a hardworking bunch of busybees. Always flitting around with solutions gauranteed to please. Download our Arrows PowerPoint Templates because Our PowerPoint Templates and Slides will weave a web of your great ideas. They are gauranteed to attract even the most critical of your colleagues. Download and present our Circle Charts PowerPoint Templates because Our PowerPoint Templates and Slides will embellish your thoughts. See them provide the desired motivation to your team.Use these PowerPoint slides for presentations relating to project, development, system, task, 3d, plan, data, process, design, leadership, isolated, requirement, collaboration, corporate, business, tag, concept, render, teamwork, graphic, schedule, goal, word, shape, gear, abstract, team, mind, management, creative, illustration, stage, connection, strategy, metaphor, company, organization, information, background, work, manager, structure. The prominent colors used in the PowerPoint template are Red, Gray, White.

7 Stages Concentric Flow Model Business Development Plan Template PowerPoint Slides
We present our 7 stages concentric flow model business development plan template PowerPoint Slides.Download our Business PowerPoint Templates because Our PowerPoint Templates and Slides are effectively colour coded to prioritise your plans They automatically highlight the sequence of events you desire. Download and present our Venn Diagrams PowerPoint Templates because Our PowerPoint Templates and Slides are focused like a searchlight beam. They highlight your ideas for your target audience. Use our Layers PowerPoint Templates because Our PowerPoint Templates and Slides are designed to help you succeed. They have all the ingredients you need. Use our Circle Charts PowerPoint Templates because Our PowerPoint Templates and Slides have the Brilliant backdrops. Guaranteed to illuminate the minds of your audience. Present our Shapes PowerPoint Templates because It can Conjure up grand ideas with our magical PowerPoint Templates and Slides. Leave everyone awestruck by the end of your presentation.Use these PowerPoint slides for presentations relating to diagram, process, business, graphic, design, ideas, model, data, chart, project, schema, corporate, implementation, tag, plan, engineering, concept, vector, success, symbol, stack, circle, guide, work flow, development, shape, team, management, cycle, steps, illustration, system, strategy, objects, phase, professional, organization, implement, background, image, detail, structure, product. The prominent colors used in the PowerPoint template are Blue, Gray, White.

Ppt Ozone Layer PowerPoint Presentation 2 Marketing Horizontal Process Templates
PPT ozone layer PowerPoint presentation 2 marketing horizontal process Templates-Use this PowerPoint Diagram to represent the layers of Linear Process model graphically. It shows the second stage in an animated manner through an Arrow. You can change color, size and orientation of any icon to your liking.-PPT ozone layer PowerPoint presentation 2 marketing horizontal process Templates-abstract, achievement, adding, analyzing, arrow, art, background, blank, blue, business, chart, color, colorful, cycle, data, design, diagram, element, flow, graph, graphic, gray, green, icon, linear, management, market, numbers, percent, process, project, round, stock, success, up, value

7 Stages Concentric Flow Model Ppt Best Business Plans PowerPoint Slides
We present our 7 stages concentric flow model ppt best business plans PowerPoint Slides.Use our Business PowerPoint Templates because Our PowerPoint Templates and Slides will Activate the energies of your audience. Get their creative juices flowing with your words. Present our Venn Diagrams PowerPoint Templates because Our PowerPoint Templates and Slides will let you Illuminate the road ahead to Pinpoint the important landmarks along the way. Use our Layers PowerPoint Templates because Our PowerPoint Templates and Slides will provide you a launch platform. Give a lift off to your ideas and send them into orbit. Use our Circle Charts PowerPoint Templates because Our PowerPoint Templates and Slides will Activate the energies of your audience. Get their creative juices flowing with your words. Present our Shapes PowerPoint Templates because Our PowerPoint Templates and Slides will definately Enhance the stature of your presentation. Adorn the beauty of your thoughts with their colourful backgrounds.Use these PowerPoint slides for presentations relating to diagram, process, business, graphic, design, ideas, model, data, chart, project, schema, corporate, implementation, tag, plan, engineering, concept, vector, success, symbol, stack, circle, guide, work flow, development, shape, team, management, cycle, steps, illustration, system, strategy, objects, phase, professional, organization, implement, background, image, detail, structure, product. The prominent colors used in the PowerPoint template are Purple, Gray, White.

 Home
Home