Executive Kpi
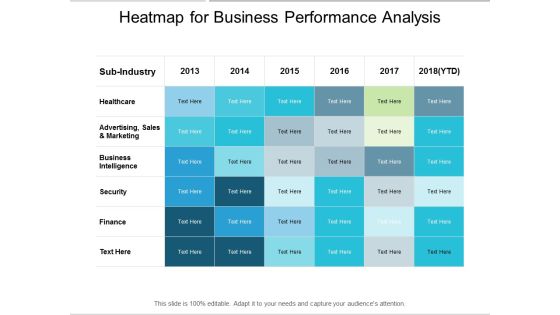
Heatmap For Business Performance Analysis Ppt PowerPoint Presentation Slides Outline
Presenting this set of slides with name heatmap for business performance analysis ppt powerpoint presentation slides outline. The topics discussed in these slides are heat map, data analytics, business quarterly. This is a completely editable PowerPoint presentation and is available for immediate download. Download now and impress your audience.
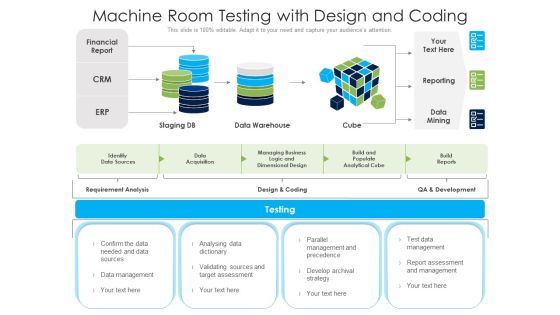
Machine Room Testing With Design And Coding Ppt PowerPoint Presentation File Slideshow PDF
Showcasing this set of slides titled machine room testing with design and coding ppt powerpoint presentation file slideshow pdf. The topics addressed in these templates are financial report, data acquisition, managing business logic. All the content presented in this PPT design is completely editable. Download it and make adjustments in color, background, font etc. as per your unique business setting.

3 Key Performance Indicators For Sales Team Performance Ppt PowerPoint Presentation File Slides PDF
Presenting 3 key performance indicators for sales team performance ppt powerpoint presentation file slides pdf to dispense important information. This template comprises three stages. It also presents valuable insights into the topics including deal, lifetime, customer. This is a completely customizable PowerPoint theme that can be put to use immediately. So, download it and address the topic impactfully.

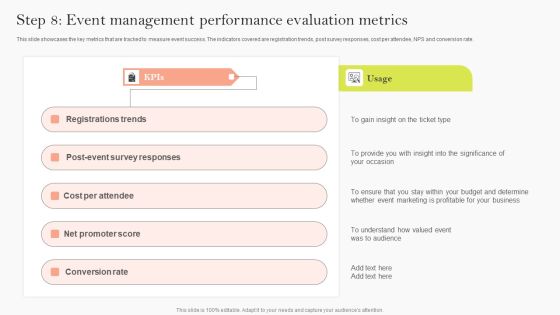
Step 8 Event Management Performance Evaluation Metrics Inspiration PDF
This slide showcases the key metrics that are tracked to measure event success. The indicators covered are registration trends, post survey responses, cost per attendee, NPS and conversion rate. There are so many reasons you need a Step 8 Event Management Performance Evaluation Metrics Inspiration PDF. The first reason is you can not spend time making everything from scratch, Thus, Slidegeeks has made presentation templates for you too. You can easily download these templates from our website easily.

Tactical Approach For Vendor Reskilling Key Metrices To Measure The Supplier Performance Designs PDF
This slide indicates the key metrices to measure the supplier performance. The major KPIs listed are quality, delivery, cost, after sales support, availability and reliability along with their optimum values. Slidegeeks is here to make your presentations a breeze with Tactical Approach For Vendor Reskilling Key Metrices To Measure The Supplier Performance Designs PDF With our easy to use and customizable templates, you can focus on delivering your ideas rather than worrying about formatting. With a variety of designs to choose from, you are sure to find one that suits your needs. And with animations and unique photos, illustrations, and fonts, you can make your presentation pop. So whether you are giving a sales pitch or presenting to the board, make sure to check out Slidegeeks first.
Key Performance Indicators To Track Sales Performance Ppt PowerPoint Presentation Icon Diagrams PDF
Showcasing this set of slides titled key performance indicators to track sales performance ppt powerpoint presentation icon diagrams pdf. The topics addressed in these templates are key performance indicators to track sales performance. All the content presented in this PPT design is completely editable. Download it and make adjustments in color, background, font etc. as per your unique business setting.

Calculate Facebook Key Performance Indicator And Track Your Performance Information PDF
Showcasing this set of slides titled calculate facebook key performance indicator and track your performance information pdf. The topics addressed in these templates are calculate facebook key performance indicator and track your performance. All the content presented in this PPT design is completely editable. Download it and make adjustments in color, background, font etc. as per your unique business setting.

Calculate Facebook Key Performance Indicator The Specific Campaign Details Introduction PDF
Showcasing this set of slides titled calculate facebook key performance indicator the specific campaign details introduction pdf. The topics addressed in these templates are calculate facebook key performance indicator the specific campaign details. All the content presented in this PPT design is completely editable. Download it and make adjustments in color, background, font etc. as per your unique business setting.
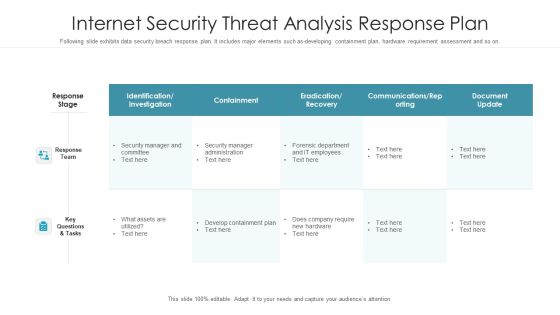
Internet Security Threat Analysis Response Plan Graphics PDF
Following slide exhibits data security breach response plan. It includes major elements such as-developing containment plan, hardware requirement assessment and so on. Pitch your topic with ease and precision using this internet security threat analysis response plan graphics pdf. This layout presents information on response team, response stage, key questions and tasks. It is also available for immediate download and adjustment. So, changes can be made in the color, design, graphics or any other component to create a unique layout.

FMEA To Determine Potential Dashboard Design Failure Mode And Effect Analysis DFMEA Ppt Show Styles PDF
This graph or chart is linked to excel, and changes automatically based on data. Just left click on it and select Edit Data. Deliver an awe inspiring pitch with this creative FMEA To Determine Potential Dashboard Design Failure Mode And Effect Analysis DFMEA Ppt Show Styles PDF bundle. Topics like Target Completion, Recommended Action, RPN Breakdown can be discussed with this completely editable template. It is available for immediate download depending on the needs and requirements of the user.
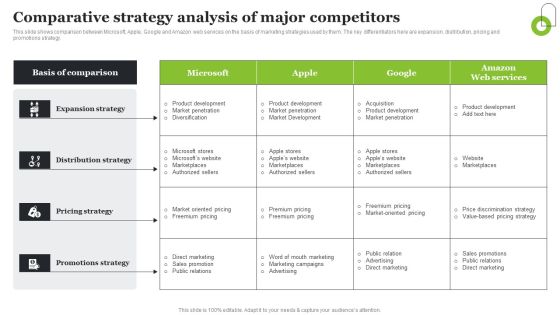
Microsoft Strategic Plan To Become Market Leader Comparative Strategy Analysis Of Major Competitors Structure PDF
This slide shows comparison between Microsoft, Apple, Google and Amazon web services on the basis of marketing strategies used by them. The key differentiators here are expansion, distribution, pricing and promotions strategy. The Microsoft Strategic Plan To Become Market Leader Comparative Strategy Analysis Of Major Competitors Structure PDF is a compilation of the most recent design trends as a series of slides. It is suitable for any subject or industry presentation, containing attractive visuals and photo spots for businesses to clearly express their messages. This template contains a variety of slides for the user to input data, such as structures to contrast two elements, bullet points, and slides for written information. Slidegeeks is prepared to create an impression.
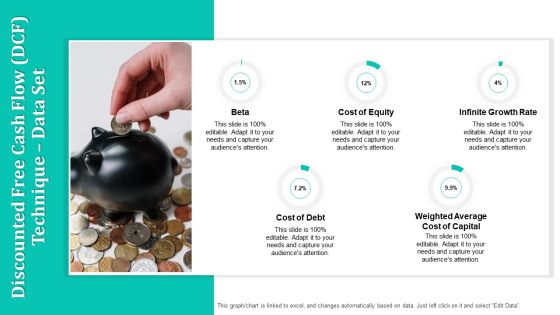
Merger And Acquisition Strategy For Inorganic Growth Discounted Free Cash Flow DCF Technique Data Set Structure PDF
This is a merger and acquisition strategy for inorganic growth discounted free cash flow DCF technique data set structure pdf template with various stages. Focus and dispense information on one stage using this creative set, that comes with editable features. It contains large content boxes to add your information on topics like cost of equity, infinite growth rate, weighted average cost of capital, cost of debt. You can also showcase facts, figures, and other relevant content using this PPT layout. Grab it now.
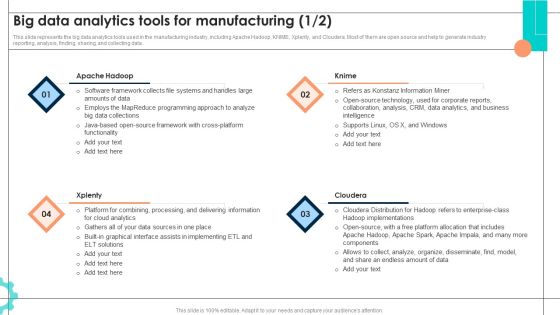
Intelligent Manufacturing Big Data Analytics Tools For Manufacturing Slides PDF
This slide represents the big data analytics tools used in the manufacturing industry, including Apache Hadoop, KNIME, Xplenty, and Cloudera. Most of them are open source and help to generate industry reporting, analysis, finding, sharing, and collecting data. Do you have to make sure that everyone on your team knows about any specific topic I yes, then you should give Intelligent Manufacturing Big Data Analytics Tools For Manufacturing Slides PDF a try. Our experts have put a lot of knowledge and effort into creating this impeccable Intelligent Manufacturing Big Data Analytics Tools For Manufacturing Slides PDF. You can use this template for your upcoming presentations, as the slides are perfect to represent even the tiniest detail. You can download these templates from the Slidegeeks website and these are easy to edit. So grab these today.

Performance Indicators For Effective Traditional Marketing Ppt Show Influencers PDF
This slide showcases key metrics of traditional media for marketers. Major indicators covered are cost per lead, customer retention, marketing ROI. Sales revenue, customer lifetime value and website traffic. Coming up with a presentation necessitates that the majority of the effort goes into the content and the message you intend to convey. The visuals of a PowerPoint presentation can only be effective if it supplements and supports the story that is being told. Keeping this in mind our experts created Performance Indicators For Effective Traditional Marketing Ppt Show Influencers PDF to reduce the time that goes into designing the presentation. This way, you can concentrate on the message while our designers take care of providing you with the right template for the situation.
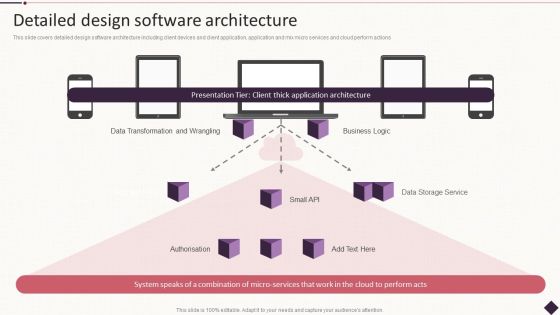
IT Project Development Planning Detailed Design Software Architecture Themes PDF
This slide covers detailed design software architecture including client devices and client application, application and mix micro services and cloud perform actions.Deliver an awe inspiring pitch with this creative IT Project Development Planning Detailed Design Software Architecture Themes PDF bundle. Topics like Data Transformation, Business Logic, Authorisation can be discussed with this completely editable template. It is available for immediate download depending on the needs and requirements of the user.

Healthcare Financial Analysis Scorecard With Country Revenue Ppt Layouts PDF
This graph or chart is linked to excel, and changes automatically based on data. Just left click on it and select Edit Data. Deliver an awe inspiring pitch with this creative Healthcare Financial Analysis Scorecard With Country Revenue Ppt Layouts PDF bundle. Topics like Revenue Generated Departments, Country Revenue Current can be discussed with this completely editable template. It is available for immediate download depending on the needs and requirements of the user.
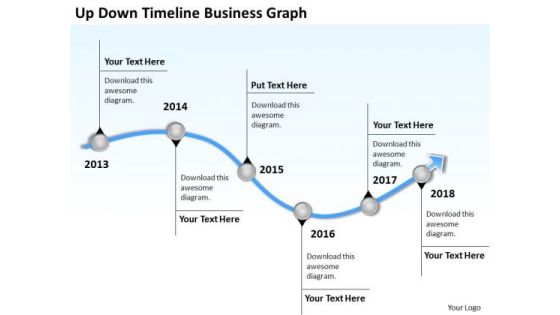
Business Analysis Diagrams PowerPoint Presentations Graph Templates
We present our business analysis diagrams powerpoint presentations graph templates.Download and present our Curves and Lines PowerPoint Templates because Your audience will believe you are the cats whiskers. Present our Business PowerPoint Templates because Our PowerPoint Templates and Slides will effectively help you save your valuable time. They are readymade to fit into any presentation structure. Present our Business PowerPoint Templates because Our PowerPoint Templates and Slides will give good value for money. They also have respect for the value of your time. Use our Arrows PowerPoint Templates because It will get your audience in sync. Present our Process and Flows PowerPoint Templates because It can Conjure up grand ideas with our magical PowerPoint Templates and Slides. Leave everyone awestruck by the end of your presentation.Use these PowerPoint slides for presentations relating to 3d, account, accounting, annual, balance, business, chart, commerce, crisis, data,earnings, economics, economy, exchange, figures, finance, financial, graph,graphic, growth, illustration, index, information, investment, list, line,management,market, marketing, money, monitoring, numbers, office, paperwork, plan, price,printout, report, research, sale, statistical, statistics, stock, success, tax, trade,work. The prominent colors used in the PowerPoint template are Blue light, Gray, White.

Project Management Reporting Procedure Framework Information PDF
This slide mentions the framework for reporting process used in project management. It includes identifying content, data collection, content development, communication and reviewing of report. Pitch your topic with ease and precision using this Project Management Reporting Procedure Framework Information PDF. This layout presents information on Data Collection, Content Development, Communication. It is also available for immediate download and adjustment. So, changes can be made in the color, design, graphics or any other component to create a unique layout.
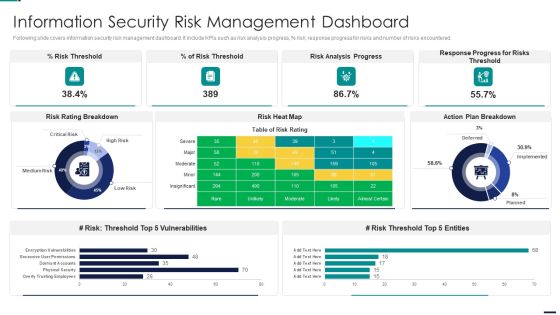
Risk Management Model For Data Security Information Security Risk Management Dashboard Pictures PDF
Following slide covers information security risk management dashboard. It include KPIs such as risk analysis progress, percent risk, response progress for risks and number of risks encountered. Deliver an awe inspiring pitch with this creative Risk Management Model For Data Security Information Security Risk Management Dashboard Pictures PDF bundle. Topics like Risk Threshold, Risk Analysis Progress, Response Progress For Risks Threshold, Action Plan Breakdown can be discussed with this completely editable template. It is available for immediate download depending on the needs and requirements of the user.

Data Management Framework With Staging Area And End Users Ppt PowerPoint Presentation File Grid PDF
Pitch your topic with ease and precision using this data management framework with staging area and end users ppt powerpoint presentation file grid pdf. This layout presents information on analysis, data sources, sales. It is also available for immediate download and adjustment. So, changes can be made in the color, design, graphics or any other component to create a unique layout.

Transforming Manufacturing With Automation Big Data Analytics Tools Information PDF
This slide represents the big data analytics tools used in the manufacturing industry, including Apache Hadoop, KNIME, Xplenty, and Cloudera. Most of them are open source and help to generate industry reporting, analysis, finding, sharing, and collecting data. Present like a pro with Transforming Manufacturing With Automation Big Data Analytics Tools Information PDF Create beautiful presentations together with your team, using our easy to use presentation slides. Share your ideas in real time and make changes on the fly by downloading our templates. So whether you are in the office, on the go, or in a remote location, you can stay in sync with your team and present your ideas with confidence. With Slidegeeks presentation got a whole lot easier. Grab these presentations today.

Business Diagram Colored 3d Flow Chart For Data Processing Presentation Template
Colored 3d flow chart has been used to design this power point template. This PPT contains the concept of data processing. Use this PPT for your data communication and analysis related presentations.
Business Diagram Creative Sign With Highway Sign Text Big Data Next Exit Ppt Slide
This diagram has been designed with graphic of magnifier and text boxes. These boxes are used to display creative sign and highway sign for big data analysis. This diagram can be used for data related topics in any presentation.

Business Diagram Map Shuffle Reduce Phases Shown In Big Data Analytic Processing Ppt Slide
This technology slide has been designed with graphic of map and data text. This diagram helps to depict concept of data analysis and processing. Use this diagram slide for computer technology related presentations.

Business Analytics Application Key Performance Indicators For Human Resource Topics PDF
This slide represents the key performance indicators that are to be tracked to monitor the effect of implementation of business intelligence in HR operations. It includes KPIs such as personnel costs, employee retention rate, employee satisfaction rate etc. The Business Analytics Application Key Performance Indicators For Human Resource Topics PDF is a compilation of the most recent design trends as a series of slides. It is suitable for any subject or industry presentation, containing attractive visuals and photo spots for businesses to clearly express their messages. This template contains a variety of slides for the user to input data, such as structures to contrast two elements, bullet points, and slides for written information. Slidegeeks is prepared to create an impression.

Charts Vector For Statistical Analysis Ppt PowerPoint Presentation Layouts Professional
Presenting this set of slides with name charts vector for statistical analysis ppt powerpoint presentation layouts professional. The topics discussed in these slides are data icon, status icon, status symbol icon. This is a completely editable PowerPoint presentation and is available for immediate download. Download now and impress your audience.
Step 8 Event Management Performance Evaluation Metrics Ppt Gallery Designs Download PDF
This slide showcases the key metrics that are tracked to measure event success. The indicators covered are registration trends, post survey responses, cost per attendee, NPS and conversion rate. There are so many reasons you need a Step 8 Event Management Performance Evaluation Metrics Ppt Gallery Designs Download PDF. The first reason is you can not spend time making everything from scratch, Thus, Slidegeeks has made presentation templates for you too. You can easily download these templates from our website easily.

Data Protection Regulations Risk Assessment And Solution Model Ppt PowerPoint Presentation Infographic Template Skills PDF
Showcasing this set of slides titled data protection regulations risk assessment and solution model ppt powerpoint presentation infographic template skills pdf. The topics addressed in these templates are process, technolog, project management, weaknesses network, systems, train workshops, analysis, inventory. All the content presented in this PPT design is completely editable. Download it and make adjustments in color, background, font etc. as per your unique business setting.
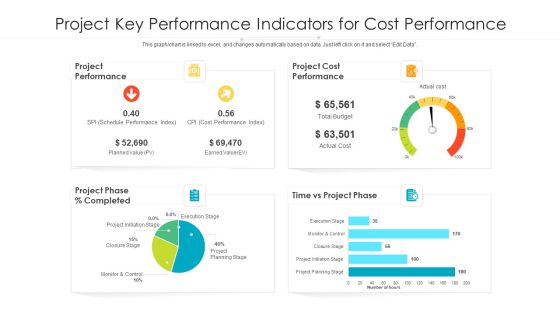
Project Key Performance Indicators For Cost Performance Ppt PowerPoint Presentation File Visuals PDF
Pitch your topic with ease and precision using this project key performance indicators for cost performance ppt powerpoint presentation file rules pdf. This layout presents information on project performance, project cost performance, schedule performance, closure stage. It is also available for immediate download and adjustment. So, changes can be made in the color, design, graphics or any other component to create a unique layout.

Predictive Analytics In The Age Of Big Data Predictive Analytics In Align Sales And Marketing Better Topics PDF
This slide describes how predictive analytics can help align sales and marketing better. Predictive analytics can help get insights from sales and marketing teams that can help to improve several factors, including handing off leads, communication of promotions, and so on. This modern and well arranged Predictive Analytics In The Age Of Big Data Predictive Analytics In Align Sales And Marketing Better Topics PDF provides lots of creative possibilities. It is very simple to customize and edit with the Powerpoint Software. Just drag and drop your pictures into the shapes. All facets of this template can be edited with Powerpoint no extra software is necessary. Add your own material, put your images in the places assigned for them, adjust the colors, and then you can show your slides to the world, with an animated slide included.
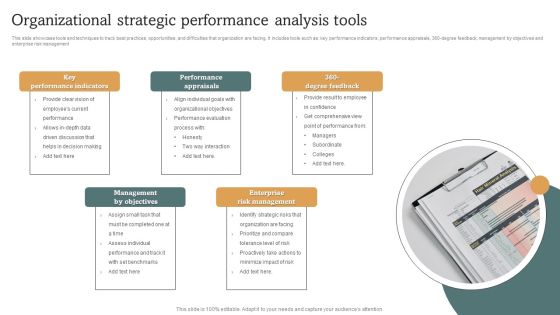
Organizational Strategic Performance Analysis Tools Structure PDF
This slide showcase tools and techniques to track best practices, opportunities, and difficulties that organization are facing. It includes tools such as key performance indicators, performance appraisals, 360 degree feedback, management by objectives and enterprise risk management. Persuade your audience using this Organizational Strategic Performance Analysis Tools Structure PDF. This PPT design covers five stages, thus making it a great tool to use. It also caters to a variety of topics including Management By Objectives, Performance Appraisals, Key Performance Indicators. Download this PPT design now to present a convincing pitch that not only emphasizes the topic but also showcases your presentation skills.

Integrating Iiot To Improve Operational Efficiency Platform For Edge And Cloud Computing Infographics PDF
This slide covers block diagram of the industrial internet of things iiot platform for edge and cloud computing services. It includes elements such as data acquisition, data transfer and processing and analysis and service apps. Showcasing this set of slides titled Integrating Iiot To Improve Operational Efficiency Platform For Edge And Cloud Computing Infographics PDF. The topics addressed in these templates are Data Processing And Cleaning, Processed Data, Machine Learning. All the content presented in this PPT design is completely editable. Download it and make adjustments in color, background, font etc. as per your unique business setting.
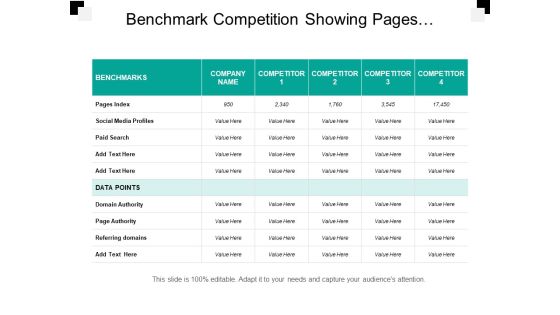
Social Media Benchmarking Page Index Data Points Ppt PowerPoint Presentation Infographics Show
This is a social media benchmarking page index data points ppt powerpoint presentation infographics show. This is a six stage process. The stages in this process are competitive analysis, benchmark competition, competition landscape.

Tracking Performance Of Internet Marketing Using Key Performance Indicators Sample PDF
The following slide highlights key performance indicators for tracking digital advertising performance to improve website traffic and revenue. It includes KPIs such as click through rate, conversion rate, return on ad spend, clicks etc. Showcasing this set of slides titled Tracking Performance Of Internet Marketing Using Key Performance Indicators Sample PDF. The topics addressed in these templates are Key Performance Indicators, Video Completion Rate, Conversion Rate. All the content presented in this PPT design is completely editable. Download it and make adjustments in color, background, font etc. as per your unique business setting.

Corporate Intelligence Business Analysis Key Drivers Ppt Pictures Background Designs PDF
Presenting corporate intelligence business analysis key drivers ppt pictures background designs pdf to provide visual cues and insights. Share and navigate important information on one stages that need your due attention. This template can be used to pitch topics like businesses understand the importance of trusted datasets and data preparation. In addition, this PPT design contains high-resolution images, graphics, etc, that are easily editable and available for immediate download.
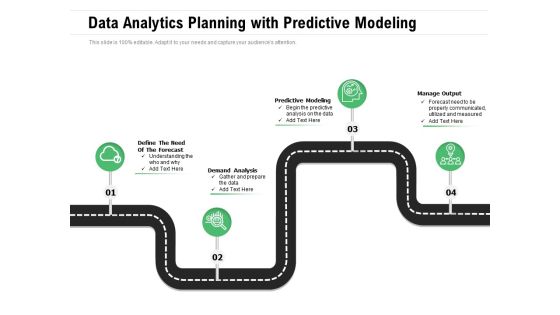
Data Analytics Planning With Predictive Modeling Ppt PowerPoint Presentation File Example Topics PDF
Presenting data analytics planning with predictive modeling ppt powerpoint presentation file example topics pdf to dispense important information. This template comprises four stages. It also presents valuable insights into the topics including analysis, communicated, predictive. This is a completely customizable PowerPoint theme that can be put to use immediately. So, download it and address the topic impactfully.
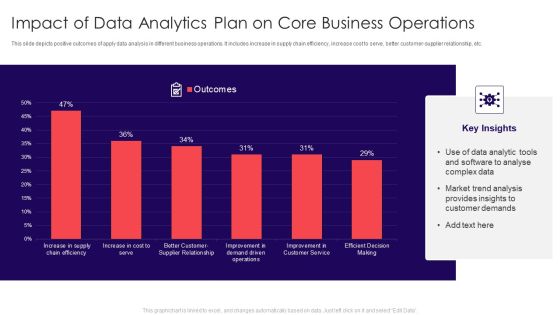
Impact Of Data Analytics Plan On Core Business Operations Summary PDF
This slide depicts positive outcomes of apply data analysis in different business operations. It includes increase in supply chain efficiency, increase cost to serve, better customer-supplier relationship, etc. Showcasing this set of slides titled Impact Of Data Analytics Plan On Core Business Operations Summary PDF. The topics addressed in these templates are Customer Demands, Market Trend Analysis, Complex Data. All the content presented in this PPT design is completely editable. Download it and make adjustments in color, background, font etc. as per your unique business setting.
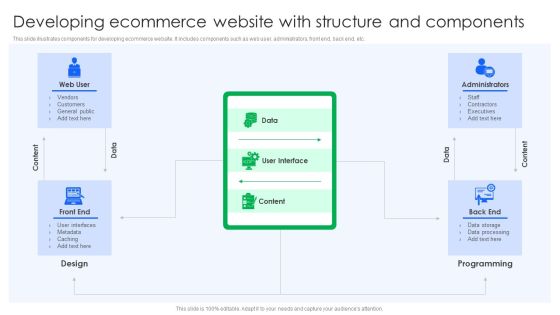
Developing Ecommerce Website With Structure And Components Designs PDF
This slide illustrates components for developing ecommerce website. It includes components such as web user, administrators, front end, back end, etc. Pitch your topic with ease and precision using this Developing Ecommerce Website With Structure And Components Designs PDF. This layout presents information on Data User Interface, Content. It is also available for immediate download and adjustment. So, changes can be made in the color, design, graphics or any other component to create a unique layout.

Seven Types Of Digital Marketing Components Designs PDF
This slide illustrates seven digital pillars of marketing for product or business promotion. It includes digital objectives, audiences, devices, platforms, media, data and technology etc. Showcasing this set of slides titled Seven Types Of Digital Marketing Components Designs PDF. The topics addressed in these templates are Digital Audiences, Digital Devices, Digital Platforms. All the content presented in this PPT design is completely editable. Download it and make adjustments in color, background, font etc. as per your unique business setting.

Audit Flowchart Of Project Administrative Procedure Demonstration PDF
Showcasing this set of slides titled audit flowchart of project administrative procedure demonstration pdf. The topics addressed in these templates are documenting, project, data warehouse. All the content presented in this PPT design is completely editable. Download it and make adjustments in color, background, font etc. as per your unique business setting.
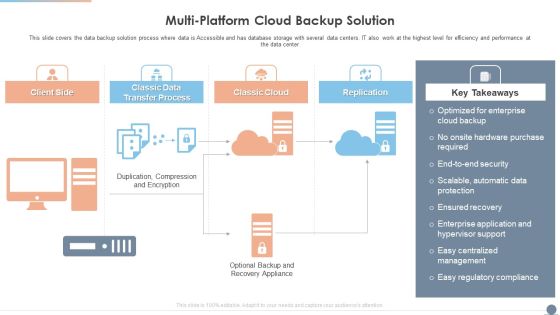
Multi Cloud Complexity Management Multi Platform Cloud Backup Solution Formats PDF
This slide covers the data backup solution process where data is Accessible and has database storage with several data centers. IT also work at the highest level for efficiency and performance at the data center. Deliver an awe inspiring pitch with this creative Multi Cloud Complexity Management Multi Platform Cloud Backup Solution Formats PDF bundle. Topics like Management, Enterprise Application, Optimized For Enterprise can be discussed with this completely editable template. It is available for immediate download depending on the needs and requirements of the user.

Oracle Cloud Competitive Analysis Based On Features Introduction PDF
This slide represents competitive analysis of oracle cloud with competitors available in market-based on certain services provided. It includes services such as analytics and BI, blockchain NFT, data management, business application, hardened compute, etc. If your project calls for a presentation, then Slidegeeks is your go-to partner because we have professionally designed, easy-to-edit templates that are perfect for any presentation. After downloading, you can easily edit Oracle Cloud Competitive Analysis Based On Features Introduction PDF and make the changes accordingly. You can rearrange slides or fill them with different images. Check out all the handy templates

Business Management Key Performance Indicators Checklist Vector Icon Ppt PowerPoint Presentation Pictures Graphics PDF
Presenting business management key performance indicators checklist vector icon ppt powerpoint presentation pictures graphics pdf to dispense important information. This template comprises threestages. It also presents valuable insights into the topics including business management key performance indicators checklist vector icon. This is a completely customizable PowerPoint theme that can be put to use immediately. So, download it and address the topic impactfully.
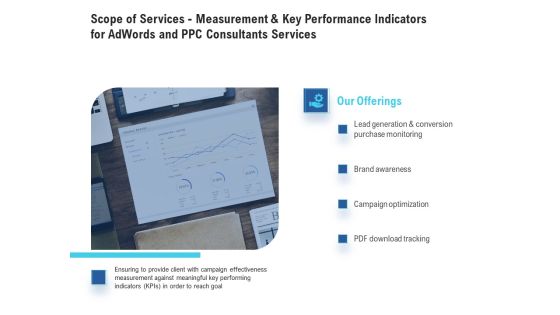
Scope Of Services - Measurement And Key Performance Indicators For Adwords And PPC Consultants Services Brochure PDF
Presenting this set of slides with name scope of services - measurement and key performance indicators for adwords and ppc consultants services brochure pdf. This is a four stage process. The stages in this process are lead generation and conversion purchase monitoring, brand awareness, campaign optimization, pdf download tracking. This is a completely editable PowerPoint presentation and is available for immediate download. Download now and impress your audience.
Pyramid Showing Key Performance Indicators For Team Performance Assessment Ppt PowerPoint Presentation Gallery Icons PDF
Persuade your audience using this pyramid showing key performance indicators for team performance assessment ppt powerpoint presentation gallery icons pdf. This PPT design covers four stages, thus making it a great tool to use. It also caters to a variety of topics including project schedule, timesheet submittals, task dependencies, workload efficiency. Download this PPT design now to present a convincing pitch that not only emphasizes the topic but also showcases your presentation skills.

Employee Headcount Analysis Turnover Comparison Of Two Companies Ppt PowerPoint Presentation Infographics Smartart PDF
This slide shows the comparison of two organizations on the basis of headcount turnover. It includes turnover data of last six years. Showcasing this set of slides titled Employee Headcount Analysis Turnover Comparison Of Two Companies Ppt PowerPoint Presentation Infographics Smartart PDF. The topics addressed in these templates are Highest Turnover, Flexible Working, Lowest. All the content presented in this PPT design is completely editable. Download it and make adjustments in color, background, font etc. as per your unique business setting.

Steps To Create Five Years Sales Projection Ideas PDF
This slide defines the steps to create five years sales forecast. It includes information related to the factors considered while creating a sales forecast for an organization. Persuade your audience using this Steps To Create Five Years Sales Projection Ideas PDF. This PPT design covers five stages, thus making it a great tool to use. It also caters to a variety of topics including Setting Metrics, Tracking Business Data, Calculating Sales Forecast. Download this PPT design now to present a convincing pitch that not only emphasizes the topic but also showcases your presentation skills.

Tactical Personnel Planning Model Of Manufacturing Industry Infographics PDF
This slide shows the step wise process in which the production workforce can improve the productivity of their work and help the business to grow at good pace. The steps includes strategy , data collection, data analysis ,implementation and evaluation. Showcasing this set of slides titled Tactical Personnel Planning Model Of Manufacturing Industry Infographics PDF. The topics addressed in these templates are Data Collection, Data Analysis, Implementation. All the content presented in this PPT design is completely editable. Download it and make adjustments in color, background, font etc. as per your unique business setting.

Catering Business Investment Funding Deck Organizational Structure Mockup PDF
Following slide showcases organizational structure of food and beverage services company. It includes roles such as general manager, quality manager, provisions manager, chef, hall manager etc. The Catering Business Investment Funding Deck Organizational Structure Mockup PDF is a compilation of the most recent design trends as a series of slides. It is suitable for any subject or industry presentation, containing attractive visuals and photo spots for businesses to clearly express their messages. This template contains a variety of slides for the user to input data, such as structures to contrast two elements, bullet points, and slides for written information. Slidegeeks is prepared to create an impression.

Data Center Transfer Process With Planning And Eecution Ppt PowerPoint Presentation Gallery Example PDF
Persuade your audience using this data center transfer process with planning and eecution ppt powerpoint presentation gallery example pdf. This PPT design covers five stages, thus making it a great tool to use. It also caters to a variety of topics including discovery, analysis, planning. Download this PPT design now to present a convincing pitch that not only emphasizes the topic but also showcases your presentation skills.
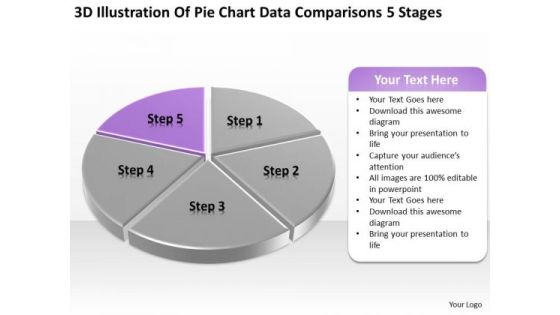
Pie Chart Data Comparisons 5 Stages Ppt Designing Business Plan PowerPoint Templates
We present our pie chart data comparisons 5 stages ppt designing business plan PowerPoint templates.Use our Marketing PowerPoint Templates because Our PowerPoint Templates and Slides are innately eco-friendly. Their high recall value negate the need for paper handouts. Download our Finance PowerPoint Templates because Our PowerPoint Templates and Slides are truly out of this world. Even the MIB duo has been keeping tabs on our team. Use our Business PowerPoint Templates because You should Bet on your luck with our PowerPoint Templates and Slides. Be assured that you will hit the jackpot. Present our Sales PowerPoint Templates because Our PowerPoint Templates and Slides are created with admirable insight. Use them and give your group a sense of your logical mind. Present our Success PowerPoint Templates because Our PowerPoint Templates and Slides are focused like a searchlight beam. They highlight your ideas for your target audience.Use these PowerPoint slides for presentations relating to Analysis, Analyzing, Brands, Business, Chart, Colorful, Commerce, Compare, Comparison, Data, Economical, Finance, Financial, Grow, Growth, Market, Market Share, Marketing, Measure, Pen, Pie, Pie Chart, Presentation, Profit, Revenue, Sales, Sales Chat, Sales Increase, Share, Statistical, Success, Successful. The prominent colors used in the PowerPoint template are Purple, Gray, White.
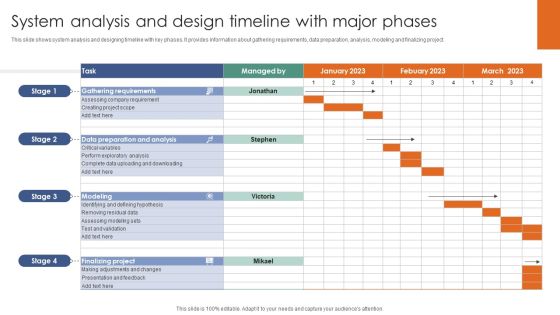
System Analysis And Design Timeline With Major Phases Ppt Pictures Slide Portrait PDF
This slide shows system analysis and designing timeline with key phases. It provides information about gathering requirements, data preparation, analysis, modeling and finalizing project. Showcasing this set of slides titled System Analysis And Design Timeline With Major Phases Ppt Pictures Slide Portrait PDF. The topics addressed in these templates are Modeling, Finalizing Project, Gathering Requirements. All the content presented in this PPT design is completely editable. Download it and make adjustments in color, background, font etc. as per your unique business setting.

Quality Management Flow Chart Diagram Powerpoint Images
This is a quality management flow chart diagram powerpoint images. This is a four stage process. The stages in this process are project document, project quality management, plan quality management, control quality, perform quality assurance, develop project mgmt. plan, perform integrated, change control, project documents, enterprise, organization, quality mgmt plan, process impr plan, quality metrics, quality control measurements, project mgmt plan update, project document, change requests, project documents updates, organizational process asset update.
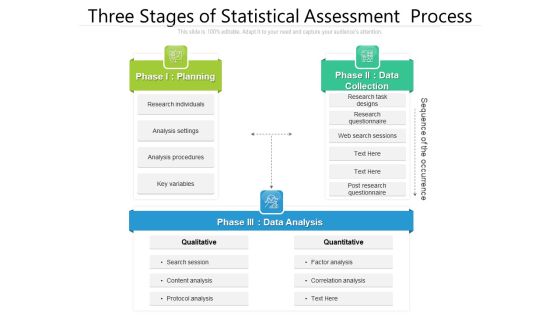
Three Stages Of Statistical Assessment Process Ppt Outline Shapes PDF
Pitch your topic with ease and precision using this three stages of statistical assessment process ppt outline shapes pdf. This layout presents information on planning, data collection, data analysis. It is also available for immediate download and adjustment. So, changes can be made in the color, design, graphics or any other component to create a unique layout.

Key Performance Indicator To Track The Performance Of Oil And Gas Company Ppt Ideas Graphics Design PDF
The slide provides the key performance indicators KPIs that might help to track the performance of oil and gas companies. Major KPIs include revenue, crude oil and natural gas production, number of rigs, workforce etc. Deliver an awe inspiring pitch with this creative key performance indicator to track the performance of oil and gas company ppt ideas graphics design pdf bundle. Topics like key performance indicator to track the performance of oil and gas company can be discussed with this completely editable template. It is available for immediate download depending on the needs and requirements of the user.

Inbound Sales Order Automation Management Flow Background PDF
This slide showcases the procedure for inbound sales order automation. It includes steps such as receiving sales order, preparation of document, data extraction, validation and verification of document.Pitch your topic with ease and precision using this Inbound Sales Order Automation Management Flow Background PDF. This layout presents information on Receiving Inbound, Software Refers, Data Extraction. It is also available for immediate download and adjustment. So, changes can be made in the color, design, graphics or any other component to create a unique layout.
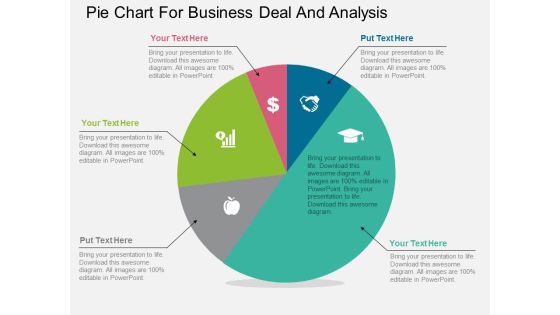
Pie Chart For Business Deal And Analysis Powerpoint Template
Our above PPT slide contains diagram of pentagon infographic. It helps to display steps of corporate marketing. Use this diagram to impart more clarity to data and to create more sound impact on viewers.
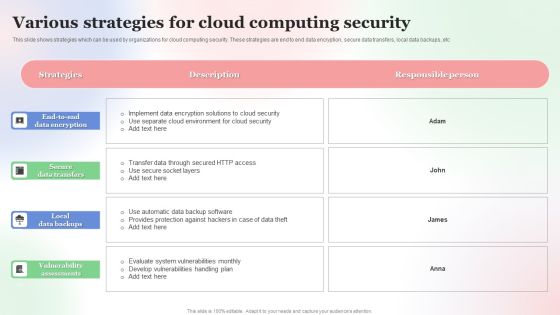
Various Strategies For Cloud Computing Security Brochure PDF
This slide shows strategies which can be used by organizations for cloud computing security. These strategies are end to end data encryption, secure data transfers, local data backups, etc. Showcasing this set of slides titled Various Strategies For Cloud Computing Security Brochure PDF. The topics addressed in these templates are Various Strategies, For Cloud, Computing Security. All the content presented in this PPT design is completely editable. Download it and make adjustments in color, background, font etc. as per your unique business setting.

App Dependency Mapping Flow Diagram Formats PDF
The following slide showcases process for mapping and recording external dependencies of software application. It includes details such as cloud services, data ingestion, queues, primary storage, etc. Showcasing this set of slides titled App Dependency Mapping Flow Diagram Formats PDF. The topics addressed in these templates are Cloud Services, Primary Data Storage, Data Ingestion. All the content presented in this PPT design is completely editable. Download it and make adjustments in color, background, font etc. as per your unique business setting.
Five Different Types Of Calculate Facebook Key Performance Indicator Results Icons PDF
Pitch your topic with ease and precision using this five different types of calculate facebook key performance indicator results icons pdf. This layout presents information on reach kpis, traffic kpis, engagement kpis, conversions kpis, brand awareness kpis. It is also available for immediate download and adjustment. So, changes can be made in the color, design, graphics or any other component to create a unique layout.

 Home
Home