Executive Kpi

Information Studies Phases Of Data Science Model Planning Slides PDF
This slide represents the model planning phase in data science and shows its tools, such as SQL Analysis Service, R, and SAS or ACCESS. Presenting Information Studies Phases Of Data Science Model Planning Slides PDF to provide visual cues and insights. Share and navigate important information on three stages that need your due attention. This template can be used to pitch topics like Model Planning, Exploratory Data Analysis, Determine. In addtion, this PPT design contains high resolution images, graphics, etc, that are easily editable and available for immediate download.

Data Assessment Rapid Evidence And Quick Scoping Review Ppt PowerPoint Presentation Gallery Skills
Presenting this set of slides with name data assessment rapid evidence and quick scoping review ppt powerpoint presentation gallery skills. This is a four stage process. The stages in this process are Data analysis, Data Review, Data Evaluation. This is a completely editable PowerPoint presentation and is available for immediate download. Download now and impress your audience.

Identifying And Increasing Brand Awareness Team Structure Of Brand Marketing Board Summary PDF
This slide shows the team structure of brand marketing board which shows objectives, team assets and metrics such as direct search traffic, visitors, subscribers, leads, product awareness, marketing productivity, etc. Make sure to capture your audiences attention in your business displays with our gratis customizable Identifying And Increasing Brand Awareness Team Structure Of Brand Marketing Board Summary PDF. These are great for business strategies, office conferences, capital raising or task suggestions. If you desire to acquire more customers for your tech business and ensure they stay satisfied, create your own sales presentation with these plain slides.

5 Data Management Challenges Faced By Marketing And Sales Team Summary PDF
This slide highlights challenges faced by marketing and sales personnel in customer data integration. Key challenges included here are data extraction, maintaining data quality, data integration, data security and choosing team for data management. Persuade your audience using this 5 Data Management Challenges Faced By Marketing And Sales Team Summary PDF. This PPT design covers five stages, thus making it a great tool to use. It also caters to a variety of topics including Data Integration, Data Security, Right Team. Download this PPT design now to present a convincing pitch that not only emphasizes the topic but also showcases your presentation skills.

Components Of Real Time Data Processing With System Management Ppt Infographic Template Diagrams PDF
This slide shows the components of real time data management which focuses on data sources, collection, management, integration, quality, storage, infrastructure, administration, reporting, analysis, etc. Presenting Components Of Real Time Data Processing With System Management Ppt Infographic Template Diagrams PDF to dispense important information. This template comprises one stages. It also presents valuable insights into the topics including Data Storage, Data Sources, Data Integration. This is a completely customizable PowerPoint theme that can be put to use immediately. So, download it and address the topic impactfully.

Real Estate Development Analysis Powerpoint Slides Show
This is a real estate development analysis powerpoint slides show. This is a five stage process. The stages in this process are development analysis, financial and economic analysis, environmental data impact analysis, customer base management analysis, real estate development analysis.

Data Lake Architecture Main Features Of Data Lake For Customer Pictures PDF
This slide represents the main features of data lakes, such as the ability to store structured and unstructured data, infinite scale to store and secure information, link of data to analytics and ML, etc. Deliver an awe inspiring pitch with this creative Data Lake Architecture Main Features Of Data Lake For Customer Pictures PDF bundle. Topics like Organized And Unstructured, Data Analysis, Data Migration, Analytics And Machine Learning Techniques can be discussed with this completely editable template. It is available for immediate download depending on the needs and requirements of the user.

Data Interpretation And Analysis Playbook Search Driven Analytics Challenges Low Bi Adoption Rate And Poor Demonstration PDF
This template covers the problems while implementing search-driven analytics in the organization. The challenges are failure rate for BI projects and poor user experience stifles adoption. Presenting data interpretation and analysis playbook search driven analytics challenges low bi adoption rate and poor demonstration pdf to provide visual cues and insights. Share and navigate important information on two stages that need your due attention. This template can be used to pitch topics like business, data visualization, fundamental challenges. In addtion, this PPT design contains high resolution images, graphics, etc, that are easily editable and available for immediate download.

Key Performance Indicators For Advertising And Promotion Plan Background PDF
This slide shows KPIs for measuring effectiveness of advertising and promotion plan for increasing overall revenue. It include KPIs such as conversion rate, cost per lead and social media management, etc. Persuade your audience using this Key Performance Indicators For Advertising And Promotion Plan Background PDF. This PPT design covers five stages, thus making it a great tool to use. It also caters to a variety of topics including Conversion Rate, Cost Per Lead, Social Media Management. Download this PPT design now to present a convincing pitch that not only emphasizes the topic but also showcases your presentation skills.

Data Mining Implementation Timeline For Data Mining Implementation In The Organization Icons PDF
This slide represents the timeline for the data science projects and a list of tasks performed each month, from training to work on projects.This is a data mining implementation timeline for data mining implementation in the organization icons pdf template with various stages. Focus and dispense information on six stages using this creative set, that comes with editable features. It contains large content boxes to add your information on topics like conditioning and transformation, exploratory analysis, final analysis You can also showcase facts, figures, and other relevant content using this PPT layout. Grab it now.

Business Intelligence And Big Data Analytics Data Analytics Business Case And Roadmap Template PDF
This slide shows the business processes and key deliverables for developing the data analytics BI project. It starts with assessing and document the current state to identify priorities, analyse the process and ends at developing roadmap to achieve the outcomes. This is a business intelligence and big data analytics data analytics business case and roadmap template pdf template with various stages. Focus and dispense information on five stages using this creative set, that comes with editable features. It contains large content boxes to add your information on topics like current state analysis, identify business priorities, analysis user base, process analysis, roadmap brainstorming. You can also showcase facts, figures, and other relevant content using this PPT layout. Grab it now.
Overview Of Data Science Methods Ppt PowerPoint Presentation Gallery Icon
This is a overview of data science methods ppt powerpoint presentation gallery icon. This is a four stage process. The stages in this process are data analysis, data review, data evaluation.
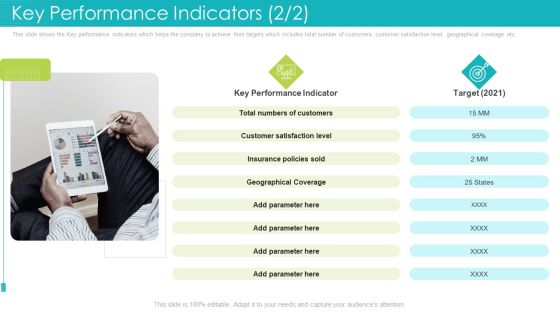
Key Performance Indicators Satisfaction Level Ppt File Deck PDF
This slide shows the Key performance indicators which helps the company to achieve their targets which includes total number of customers, customer satisfaction level, geographical coverage etc. Deliver an awe inspiring pitch with this creative key performance indicators satisfaction level ppt file deck pdf bundle. Topics like key performance indicator, customer satisfaction level, geographical coverage, target can be discussed with this completely editable template. It is available for immediate download depending on the needs and requirements of the user.

Marketing Key Performance Indicators For Business Plan Review Template PDF
The following slide showcases targets of essential KPIs used in marketing to be tracked in campaign. Key indicators covered are number of conversions, leads and customer acquisition. Presenting Marketing Key Performance Indicators For Business Plan Review Template PDF to dispense important information. This template comprises three stages. It also presents valuable insights into the topics including Number Of Conversion, Number Of Leads, Customer Acquisition. This is a completely customizable PowerPoint theme that can be put to use immediately. So, download it and address the topic impactfully.

Market Research Findings Template 1 Ppt PowerPoint Presentation Backgrounds
This is a market research findings template 1 ppt powerpoint presentation backgrounds. This is a five stage process. The stages in this process are occassionals, talkers, pragmatists, personals, tribals, prodigies, the always on consumer segments.

Toolkit For Data Science And Analytics Transition Value Stream Data Analytics Process Background PDF
This slide shows the step by step approach of data analytics project focusing on data gathering, consolidation and data analysis to build business insights for effective decision making. Find highly impressive Toolkit For Data Science And Analytics Transition Value Stream Data Analytics Process Background PDF on Slidegeeks to deliver a meaningful presentation. You can save an ample amount of time using these presentation templates. No need to worry to prepare everything from scratch because Slidegeeks experts have already done a huge research and work for you. You need to download Toolkit For Data Science And Analytics Transition Value Stream Data Analytics Process Background PDF for your upcoming presentation. All the presentation templates are 100 percent editable and you can change the color and personalize the content accordingly. Download now.

Customer Analysis Diagram Example Ppt Background
This is a customer analysis diagram example ppt background. This is a eight stage process. The stages in this process are repair and append records, number, maintain data, email deliverability scoring, analysis of data completeness, customer base products, decision process, value drivers, customer analysis.

Various Ways For Port Data Management Ppt Slides Summary PDF
The slide covers the methods to assess and manage the port data for determining resource requirements. Various ways included are search analytics, dashboard, data archiving, data storage and data analysis. Persuade your audience using this Various Ways For Port Data Management Ppt Slides Summary PDF. This PPT design covers five stages, thus making it a great tool to use. It also caters to a variety of topics including Data Analysis, Data Storage, Data Archiving, Dashboard, Search Analytics. Download this PPT design now to present a convincing pitch that not only emphasizes the topic but also showcases your presentation skills.

Substructure Segment Analysis 4 Dimensions Of Infrastructure Security Ppt Portfolio
This is a substructure segment analysis 4 dimensions of infrastructure security ppt portfolio template with various stages. Focus and dispense information on four stages using this creative set, that comes with editable features. It contains large content boxes to add your information on topics like people, data, applications, infrastructure. You can also showcase facts, figures, and other relevant content using this PPT layout. Grab it now.

Data Analytics Healthcare Method To Improve Clinical Performance Brochure PDF
This slide showcase the different methods of healthcare data analytics for better clinical performance. It includes methods such as descriptive, predictive, prescriptive and comparative analysis. Persuade your audience using this Data Analytics Healthcare Method To Improve Clinical Performance Brochure PDF. This PPT design covers Four stages, thus making it a great tool to use. It also caters to a variety of topics including Descriptive Analysis, Predictive Analysis, Prescriptive Analysis. Download this PPT design now to present a convincing pitch that not only emphasizes the topic but also showcases your presentation skills.
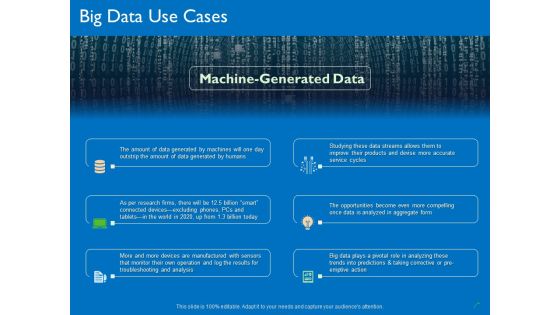
Transforming Big Data Analytics To Knowledge Big Data Use Cases Ppt Ideas Infographics PDF
This is a transforming big data analytics to knowledge big data use cases ppt ideas infographics pdf template with various stages. Focus and dispense information on six stages using this creative set, that comes with editable features. It contains large content boxes to add your information on topics like opportunities, analysis, monitor, manufactured, service. You can also showcase facts, figures, and other relevant content using this PPT layout. Grab it now.

Procedure To Cure Disease Using Big Data Analytics Designs PDF
This slide showcase process to cure disease using big data analysis and use it for future preference to treat patients. It includes elements such as diagnose and collect, analyze and store, map and match, access and compute etc. Presenting Procedure To Cure Disease Using Big Data Analytics Designs PDF to dispense important information. This template comprises five stages. It also presents valuable insights into the topics including Patient, Compute, Collect. This is a completely customizable PowerPoint theme that can be put to use immediately. So, download it and address the topic impactfully.

Project Quality Management Key Performance Assurance Indicator Dashboard Guidelines PDF
Pitch your topic with ease and precision using this Project Quality Management Key Performance Assurance Indicator Dashboard Guidelines PDF. This layout presents information on Management Key, Performance Assurance, Indicator Dashboard. It is also available for immediate download and adjustment. So, changes can be made in the color, design, graphics or any other component to create a unique layout.
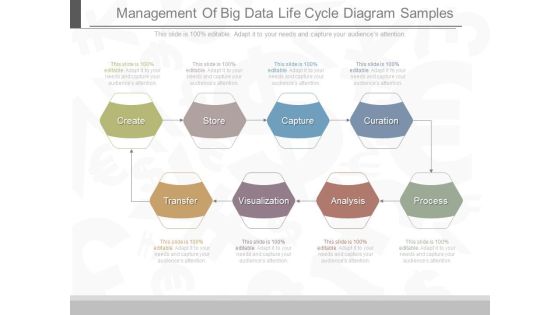
Management Of Big Data Life Cycle Diagram Samples
This is a management of big data life cycle diagram samples. This is a eight stage process. The stages in this process are create, store, capture, curation, transfer, visualization, analysis, process.

Corporate Intelligence Business Analysis Technology And Product Architectures Access Inspiration PDF
Presenting corporate intelligence business analysis technology and product architectures access inspiration pdf to provide visual cues and insights. Share and navigate important information on four stages that need your due attention. This template can be used to pitch topics like data sources, enterprise data warehouse, analytics, user access. In addition, this PPT design contains high-resolution images, graphics, etc, that are easily editable and available for immediate download.
Data Engineering Vector Icons Ppt PowerPoint Presentation Model Graphic Images
This is a data engineering vector icons ppt powerpoint presentation model graphic images. This is a three stage process. The stages in this process are data, analysis, data science, information science.

Data Mining Vector Icon Ppt PowerPoint Presentation Images
This is a data mining vector icon ppt powerpoint presentation images. This is a one stage process. The stages in this process are data, analysis, data science, information science.

Data Governance For Enterprise Workflow Management Ppt PowerPoint Presentation Professional Graphics
Presenting this set of slides with name data governance for enterprise workflow management ppt powerpoint presentation professional graphics. This is a four stage process. The stages in this process are Data analysis, Data Review, Data Evaluation. This is a completely editable PowerPoint presentation and is available for immediate download. Download now and impress your audience.

Website Traffic Analysis Diagram Presentation Layouts
This is a website traffic analysis diagram presentation layouts. This is a four stage process. The stages in this process are keywords used, design analysis, define goals, collect data, web analysis process.

A B Testing Strategy To Effectively Run Facebook Ads Ppt PowerPoint Presentation Diagram PDF
The following slide outlines A or B testing technique through which advertisers can evaluate effectiveness of different ad variations and make data-driven decisions. It provides information about key metrics such as total clicks, reach, and conversion rate. If you are looking for a format to display your unique thoughts, then the professionally designed A B Testing Strategy To Effectively Run Facebook Ads Ppt PowerPoint Presentation Diagram PDF is the one for you. You can use it as a Google Slides template or a PowerPoint template. Incorporate impressive visuals, symbols, images, and other charts. Modify or reorganize the text boxes as you desire. Experiment with shade schemes and font pairings. Alter, share or cooperate with other people on your work. Download A B Testing Strategy To Effectively Run Facebook Ads Ppt PowerPoint Presentation Diagram PDF and find out how to give a successful presentation. Present a perfect display to your team and make your presentation unforgettable.

Big Data And Social Media Analytics Ppt PowerPoint Presentation Background Designs
This is a big data and social media analytics ppt powerpoint presentation background designs. This is a nine stage process. The stages in this process are million, megabytes, hours, petabytes, billion, exabytes.

Data Warehousing IT Data Warehouse Architecture With Staging Area Ppt Styles Objects PDF
This slide describes a data warehouse architecture with a staging area and how staging helps clean and process the information before entering it into the data warehouse. Presenting data warehousing it data warehouse architecture with staging area ppt styles objects pdf to provide visual cues and insights. Share and navigate important information on three stages that need your due attention. This template can be used to pitch topics like operational system, analysis, reporting, mining, flat files. In addtion, this PPT design contains high resolution images, graphics, etc, that are easily editable and available for immediate download.
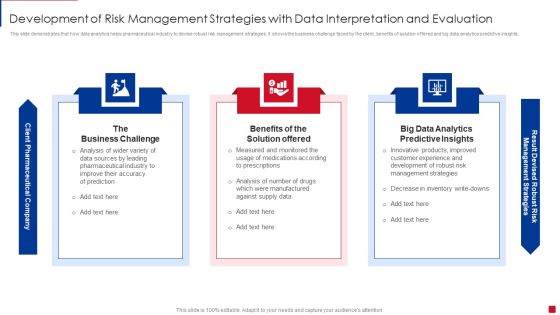
Development Of Risk Management Strategies With Data Interpretation And Evaluation Summary PDF
This slide demonstrates that how data analytics helps pharmaceutical industry to devise robust risk management strategies. It shows the business challenge faced by the client, benefits of solution offered and big data analytics predictive insights. Persuade your audience using this Development Of Risk Management Strategies With Data Interpretation And Evaluation Summary PDF. This PPT design covers three stages, thus making it a great tool to use. It also caters to a variety of topics including Business Challenge, Benefits Solution Offered, Big Data Analytics. Download this PPT design now to present a convincing pitch that not only emphasizes the topic but also showcases your presentation skills.
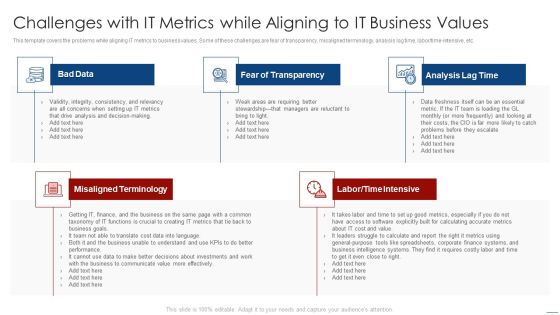
How To Evaluate And Develop The Organizational Value Of IT Service Challenges With IT Metrics While Information PDF
This template covers the problems while aligning IT metrics to business values. Some of these challenges are fear of transparency, misaligned terminology, analysis lag time, labor or time-intensive, etc. Presenting how to evaluate and develop the organizational value of it service challenges with it metrics while information pdf to provide visual cues and insights. Share and navigate important information on five stages that need your due attention. This template can be used to pitch topics like bad data, misaligned terminology, fear of transparency, analysis lag time, labor or time intensive. In addtion, this PPT design contains high resolution images, graphics, etc, that are easily editable and available for immediate download.
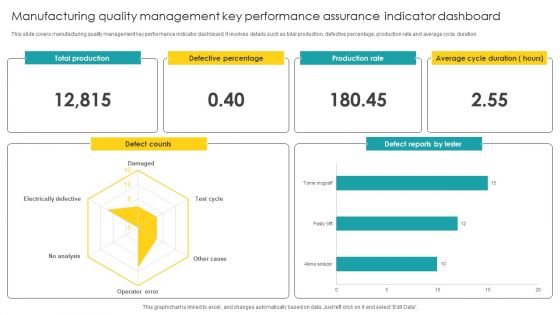
Manufacturing Quality Management Key Performance Assurance Indicator Dashboard Microsoft PDF
Pitch your topic with ease and precision using this Manufacturing Quality Management Key Performance Assurance Indicator Dashboard Microsoft PDF. This layout presents information on Quality Management, Key Performance Assurance. It is also available for immediate download and adjustment. So, changes can be made in the color, design, graphics or any other component to create a unique layout.

Customer Segmentation And Behavioral Analysis Target Customer Analysis Ideas PDF
The following slide presents a dashboard for analyzing customer segmentation based on demographics factors. It includes key components such as appointment status value, count of payment method, total payments and age count. The Customer Segmentation And Behavioral Analysis Target Customer Analysis Ideas PDF is a compilation of the most recent design trends as a series of slides. It is suitable for any subject or industry presentation, containing attractive visuals and photo spots for businesses to clearly express their messages. This template contains a variety of slides for the user to input data, such as structures to contrast two elements, bullet points, and slides for written information. Slidegeeks is prepared to create an impression.
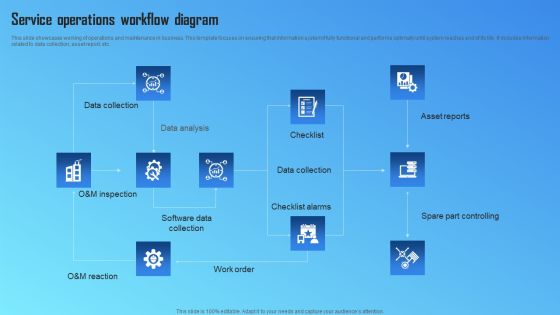
Service Operations Workflow Diagram Designs PDF
This slide showcases working of operations and maintenance in business. This template focuses on ensuring that information system if fully functional and performs optimally until system reaches end of its life. It includes information related to data collection, asset report, etc. Showcasing this set of slides titled Service Operations Workflow Diagram Designs PDF. The topics addressed in these templates are Data Collection, Data Analysis, Software Data Collection. All the content presented in this PPT design is completely editable. Download it and make adjustments in color, background, font etc. as per your unique business setting.

Bulb With Business Analysis Icons Powerpoint Templates
This PowerPoint slide contains graphics of bulb diagram with icons. It helps to exhibit concepts of sales planning. Use this diagram to impart more clarity to data and to create more sound impact on viewers.

Project Management Key Performance Indicators Balanced Scorecard Introduction PDF
This slide shows key performance indicators scorecard for the project management of the organization. It includes financial status, consumer satisfaction, business growth and internal objectives. Pitch your topic with ease and precision using this Project Management Key Performance Indicators Balanced Scorecard Introduction PDF. This layout presents information on Financial Status, Business Growth, Consumer Satisfaction. It is also available for immediate download and adjustment. So, changes can be made in the color, design, graphics or any other component to create a unique layout.
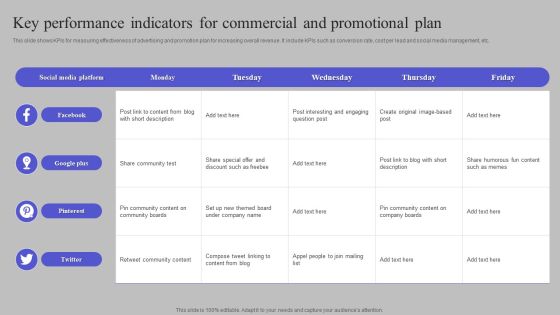
Key Performance Indicators For Commercial And Promotional Plan Information PDF
This slide shows KPIs for measuring effectiveness of advertising and promotion plan for increasing overall revenue. It include KPIs such as conversion rate, cost per lead and social media management, etc. Showcasing this set of slides titled Key Performance Indicators For Commercial And Promotional Plan Information PDF. The topics addressed in these templates are Facebook, Google Plus, Pinterest. All the content presented in this PPT design is completely editable. Download it and make adjustments in color, background, font etc. as per your unique business setting.
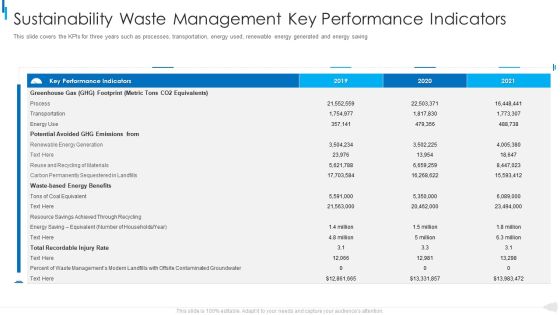
MSW Management Sustainability Waste Management Key Performance Indicators Download PDF
This slide covers the KPIs for three years such as processes, transportation, energy used, renewable energy generated and energy saving. Deliver and pitch your topic in the best possible manner with this MSW Management Sustainability Waste Management Key Performance Indicators Download Pdf. Use them to share invaluable insights on greenhouse, potential avoided, recordable and impress your audience. This template can be altered and modified as per your expectations. So, grab it now.

Data Collection Histograms Ppt PowerPoint Presentation Outline Show
This is a data collection histograms ppt powerpoint presentation outline show. This is a seven stage process. The stages in this process are business, marketing, strategy, finance, analysis.

Boosting Product Sales Through Branding Team Structure Of Brand Marketing Themes PDF
This slide shows the team structure of brand marketing board which shows objectives, team assets and metrics such as direct search traffic, visitors, subscribers, leads, product awareness, marketing productivity, etc. Want to ace your presentation in front of a live audience Our Boosting Product Sales Through Branding Team Structure Of Brand Marketing Themes PDF can help you do that by engaging all the users towards you.. Slidegeeks experts have put their efforts and expertise into creating these impeccable powerpoint presentations so that you can communicate your ideas clearly. Moreover, all the templates are customizable, and easy-to-edit and downloadable. Use these for both personal and commercial use.
Types Of Enterprise Decision Management With Accounting System And Data Analysis System Ppt PowerPoint Presentation Outline Icon PDF
Presenting this set of slides with name types of enterprise decision management with accounting system and data analysis system ppt powerpoint presentation outline icon pdf. This is a five stage process. The stages in this process are status inquiry system, information analysis system, model based system data analysis system. This is a completely editable PowerPoint presentation and is available for immediate download. Download now and impress your audience.

Business Framework Matrix Analysis PowerPoint Presentation
Display the matrix analysis with our new business framework power point template. This PPT has been designed with matrix graphic. Add this matrix in your analysis presentation for business or marketing data.

Data Management Process Automation To Reduce Organizational Operating Cost Pictures PDF
Following slide provide insight about automation of data management process for reducing reporting errors. It includes components such as data quality, automated data integration, automated reporting and master data management.Showcasing this set of slides titled Data Management Process Automation To Reduce Organizational Operating Cost Pictures PDF. The topics addressed in these templates are Data Quality, Data Integration, Automated Reporting, Master Data Management. All the content presented in this PPT design is completely editable. Download it and make adjustments in color, background, font etc. as per your unique business setting.

Warehouse Efficiency Management With Key Performance Indicators Clipart PDF
This slide represents a table showing the measurement of performance of warehouse system of an organization on the basis of key performance indicators. It includes measures such as on-time shipment to customer, order picking accuracy, warehouse capacity utilization etc for tracking warehouse performance. Pitch your topic with ease and precision using this Warehouse Efficiency Management With Key Performance Indicators Clipart PDF. This layout presents information on Measure, Order Picking Accuracy, Employee Turnover. It is also available for immediate download and adjustment. So, changes can be made in the color, design, graphics or any other component to create a unique layout.
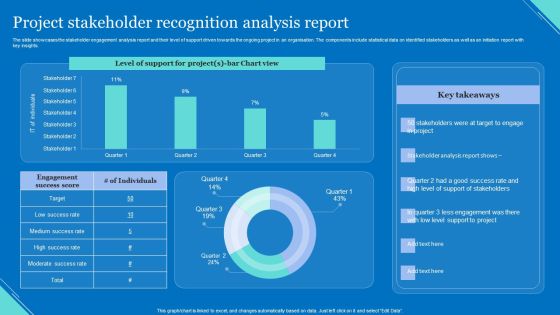
Project Stakeholder Recognition Analysis Report Elements PDF
The slide showcases the stakeholder engagement analysis report and their level of support driven towards the ongoing project in an organisation. The components include statistical data on identified stakeholders as well as an initiation report with key insights. Showcasing this set of slides titled Project Stakeholder Recognition Analysis Report Elements PDF. The topics addressed in these templates are Level Support, Chart View, Support Stakeholders. All the content presented in this PPT design is completely editable. Download it and make adjustments in color, background, font etc. as per your unique business setting.

Global Tiktok Users Statistical Data Portrait PDF
This slide shows the statistical data representing the analysis of global TikTok users on TikTok to help marketers to analyze and identify target audience. It shows data related to users of TikTok are youths and millennials. If you are looking for a format to display your unique thoughts, then the professionally designed Global Tiktok Users Statistical Data Portrait PDF is the one for you. You can use it as a Google Slides template or a PowerPoint template. Incorporate impressive visuals, symbols, images, and other charts. Modify or reorganize the text boxes as you desire. Experiment with shade schemes and font pairings. Alter, share or cooperate with other people on your work. Download Global Tiktok Users Statistical Data Portrait PDF and find out how to give a successful presentation. Present a perfect display to your team and make your presentation unforgettable.

Big Data Management In Education Sector Ppt PowerPoint Presentation Diagram Templates PDF
Presenting Big Data Management In Education Sector Ppt PowerPoint Presentation Diagram Templates PDF to provide visual cues and insights. Share and navigate important information on four stages that need your due attention. This template can be used to pitch topics like Cluster Analysis, Data Warehouse, Cloud Environment. In addtion, this PPT design contains high resolution images, graphics, etc, that are easily editable and available for immediate download.
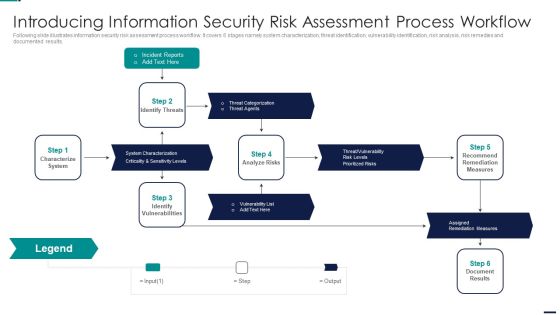
Risk Management Model For Data Introducing Information Security Risk Assessment Process Sample PDF
Following slide illustrates information security risk assessment process workflow. It covers 6 stages namely system characterization, threat identification, vulnerability identification, risk analysis, risk remedies and documented results. This is a Risk Management Model For Data Introducing Information Security Risk Assessment Process Sample PDF template with various stages. Focus and dispense information on five stages using this creative set, that comes with editable features. It contains large content boxes to add your information on topics like Incident Reports, Characterize System, Identify Vulnerabilities, Assigned Remediation Measures. You can also showcase facts, figures, and other relevant content using this PPT layout. Grab it now.

Market Research And Analysis Diagram Ppt Sample
This is a market research and analysis diagram ppt sample. This is a five stage process. The stages in this process are location analysis, data mining, sowt analysis, market research and analysis, competition analysis, marketing potential.
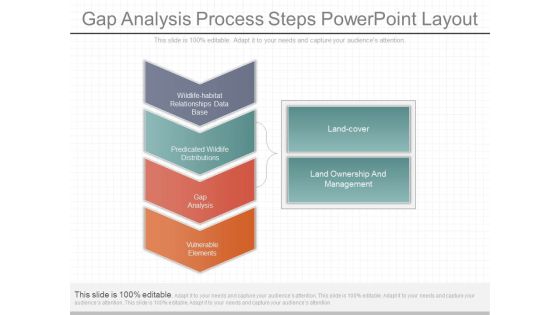
Gap Analysis Process Steps Powerpoint Layout
This is a gap analysis process steps powerpoint layout. This is a six stage process. The stages in this process are wildlife habitat relationships data base, predicated wildlife distributions, gap analysis, vulnerable elements, land cover, land ownership and management.

Construction Project Categorization And Dimensions Structure Graphics PDF
The slide highlights the categories and dimensions structure for construction projects management. Structure includes categories company structure, building material, project data, IT architecture, etc and dimensions project structure, project management, project data and project phase. Showcasing this set of slides titled Construction Project Categorization And Dimensions Structure Graphics PDF. The topics addressed in these templates are Project Management, Company Structure, Building Material. All the content presented in this PPT design is completely editable. Download it and make adjustments in color, background, font etc. as per your unique business setting.

Key Performance Indicator Dashboard For Transportation Management Formats PDF
The following slide highlights key performance indicator dashboard for transportation management illustrating transportation cost, effectiveness, utilization and quality for last month and current month in America, Europe and Asia, it considers delivery and return cost, packing productivity and time, packing material cost and equipment utilization. Showcasing this set of slides titled Key Performance Indicator Dashboard For Transportation Management Formats PDF. The topics addressed in these templates are Transportation Cost, Effectiveness, Utilization, Quality. All the content presented in this PPT design is completely editable. Download it and make adjustments in color, background, font etc. as per your unique business setting.

Big Data Analytics Lifecycle Lifecycle Phases Of Big Data Analytics Ppt Gallery Sample PDF
This slide depicts the lifecycle phases of big data analytics, including business case evaluation, data identification, data filtering, data extraction, data aggregation, data analysis, data visualization, and final analysis output. Slidegeeks is one of the best resources for PowerPoint templates. You can download easily and regulate Big Data Analytics Lifecycle Lifecycle Phases Of Big Data Analytics Ppt Gallery Sample PDF for your personal presentations from our wonderful collection. A few clicks is all it takes to discover and get the most relevant and appropriate templates. Use our Templates to add a unique zing and appeal to your presentation and meetings. All the slides are easy to edit and you can use them even for advertisement purposes.

Data Project Lifecycle Management With Other Systems Portrait PDF
This slide data lifecycle management with other systems. It involves data governance, metadata management, administrative tasks, analysis and data cleaning.Persuade your audience using this Data Project Lifecycle Management With Other Systems Portrait PDF. This PPT design covers five stages, thus making it a great tool to use. It also caters to a variety of topics including Descriptive Analytics, Predictive Analytics, Diagnose Analytics. Download this PPT design now to present a convincing pitch that not only emphasizes the topic but also showcases your presentation skills.

Information Science Exploratory Data Analysis EDA In Model Planning Phase Ppt PowerPoint Presentation Infographics Graphics Pictures PDF
This slide depicts the exploratory data analysis in the model planning phase of data science and its various stages and reasons behind using it.This is a Information Science Exploratory Data Analysis EDA In Model Planning Phase Ppt PowerPoint Presentation Infographics Graphics Pictures PDF template with various stages. Focus and dispense information on six stages using this creative set, that comes with editable features. It contains large content boxes to add your information on topics like Measures Dispersion, Graphical Representation, Skewness Right. You can also showcase facts, figures, and other relevant content using this PPT layout. Grab it now.
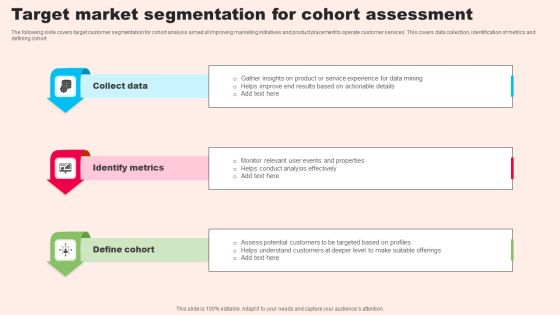
Target Market Segmentation For Cohort Assessment Mockup PDF
The following slide covers target customer segmentation for cohort analysis aimed at improving marketing initiatives and product placement to operate customer services. This covers data collection, identification of metrics and defining cohort. Persuade your audience using this Target Market Segmentation For Cohort Assessment Mockup PDF. This PPT design covers three stages, thus making it a great tool to use. It also caters to a variety of topics including Define Cohort, Identify Metrics, Collect Data. Download this PPT design now to present a convincing pitch that not only emphasizes the topic but also showcases your presentation skills.

Checklist For Data Requirements For Analytics Information PDF
This slide covers checklist for data requirement analysis which includes points such as do you have the software for data analysis and interpretation, do you have the dashboard for tracking customer buying pattern, do you have DBMS to store the collected data etc. Presenting checklist for data requirements for analytics information pdf to dispense important information. This template comprises two stages. It also presents valuable insights into the topics including analysis, customers, dashboard. This is a completely customizable PowerPoint theme that can be put to use immediately. So, download it and address the topic impactfully.

 Home
Home