Executive Kpi

KPI Dashboard To Track Brand Performance Ppt Ideas Pictures PDF
Mentioned slide showcases KPI dashboard that can be used to check the financial performance of a brand. Metrics covered in the dashboard are return on assets, working capital ratio, return on equity etc. Formulating a presentation can take up a lot of effort and time, so the content and message should always be the primary focus. The visuals of the PowerPoint can enhance the presenters message, so our KPI Dashboard To Track Brand Performance Ppt Ideas Pictures PDF was created to help save time. Instead of worrying about the design, the presenter can concentrate on the message while our designers work on creating the ideal templates for whatever situation is needed. Slidegeeks has experts for everything from amazing designs to valuable content, we have put everything into KPI Dashboard To Track Brand Performance Ppt Ideas Pictures PDF.

Viral Campaigns Kpi Dashboard With Engagement Metrics Template PDF
This slide showcases KPI dashboard which can help marketers in assessing engagement metrics. It provides details about user metrics, direct signups, seed contacts, community members, social KPIs, engagement rate, etc. Want to ace your presentation in front of a live audience Our Viral Campaigns Kpi Dashboard With Engagement Metrics Template PDF can help you do that by engaging all the users towards you. Slidegeeks experts have put their efforts and expertise into creating these impeccable powerpoint presentations so that you can communicate your ideas clearly. Moreover, all the templates are customizable, and easy to edit and downloadable. Use these for both personal and commercial use.
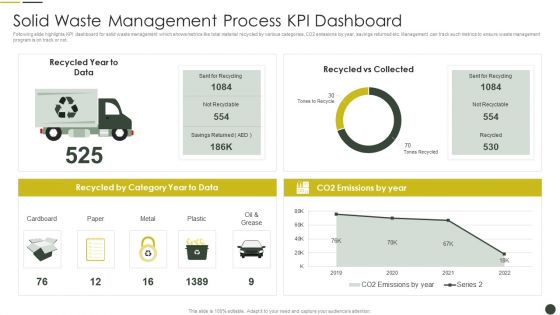
Solid Waste Management Process KPI Dashboard Pictures PDF
Following slide highlights KPI dashboard for solid waste management which shows metrics like total material recycled by various categories, CO2 emissions by year, savings returned etc. Management can track such metrics to ensure waste management program is on track or not.Showcasing this set of slides titled Solid Waste Management Process KPI Dashboard Pictures PDF The topics addressed in these templates are Recycled Category, Sent Recycling, Tones Recycle All the content presented in this PPT design is completely editable. Download it and make adjustments in color, background, font etc. as per your unique business setting.
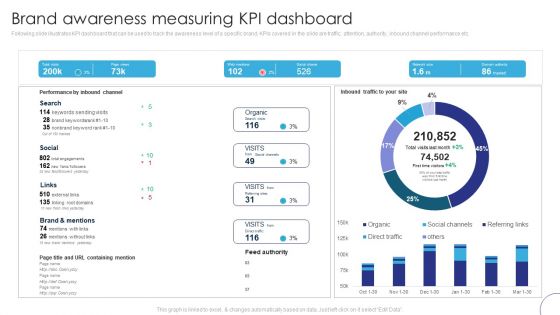
Implementing Brand Leadership Brand Awareness Measuring Kpi Dashboard Template PDF
Following slide illustrates KPI dashboard that can be used to track the awareness level of a specific brand. KPIs covered in the slide are traffic, attention, authority, inbound channel performance etc. Get a simple yet stunning designed Implementing Brand Leadership Brand Awareness Measuring Kpi Dashboard Template PDF. It is the best one to establish the tone in your meetings. It is an excellent way to make your presentations highly effective. So, download this PPT today from Slidegeeks and see the positive impacts. Our easy-to-edit Implementing Brand Leadership Brand Awareness Measuring Kpi Dashboard Template PDF can be your go-to option for all upcoming conferences and meetings. So, what are you waiting for Grab this template today.

KPI Dashboard To Measure Annual Marketing Plan Performance Microsoft PDF
The purpose of this slide is to illustrate performance KPI dashboard which can be used to evaluate the effectiveness of yearly marketing plan. The kpis are website visitors, lifetime value of a customer LTV, lead conversion rate, etc. Showcasing this set of slides titled KPI Dashboard To Measure Annual Marketing Plan Performance Microsoft PDF. The topics addressed in these templates are Website Visitors, Lifetime Value Customer, Bounce Dormancy Rate. All the content presented in this PPT design is completely editable. Download it and make adjustments in color, background, font etc. as per your unique business setting.
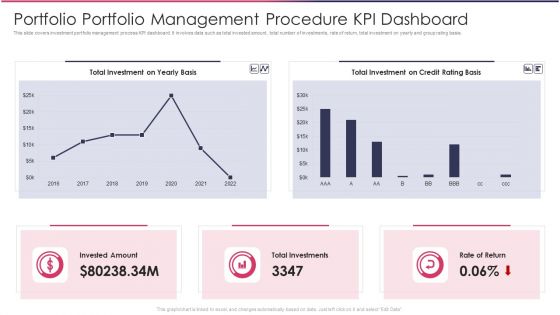
Portfolio Portfolio Management Procedure KPI Dashboard Demonstration PDF
This slide covers investment portfolio management process KPI dashboard. It involves data such as total invested amount, total number of investments, rate of return, total investment on yearly and group rating basis.Showcasing this set of slides titled Portfolio Portfolio Management Procedure KPI Dashboard Demonstration PDF The topics addressed in these templates are Total Investment, Credit Basis, Total Investments All the content presented in this PPT design is completely editable. Download it and make adjustments in color, background, font etc. as per your unique business setting.

KPI Dashboard Showcasing New Product Management Project Themes PDF
This slide represents KPI dashboard showcasing new product development project which can be used by managers to track performance. It provides information regarding cost by stage, resource availability and resource stage. Pitch your topic with ease and precision using this KPI Dashboard Showcasing New Product Management Project Themes PDF. This layout presents information on Cost By Stage, Resource By Stage, Resource Availability By Role. It is also available for immediate download and adjustment. So, changes can be made in the color, design, graphics or any other component to create a unique layout.
Product Management Team Performance Tracking KPI Dashboard Pictures PDF
This slide provides performance tracking dashboard for product development project team. It provides information regarding hours spent on project, deadlines, employee responsible, new leads and revenue generated. Pitch your topic with ease and precision using this Product Management Team Performance Tracking KPI Dashboard Pictures PDF. This layout presents information on Tracking KPI Dashboard, Product Management Team Performance. It is also available for immediate download and adjustment. So, changes can be made in the color, design, graphics or any other component to create a unique layout.
KPI Dashboard For Tracking Financial Management Challenges Download PDF
Following slide demonstrates KPI dashboard for monitoring business cash flow management pain points to improve organisation financial performance. It includes elements such as quick ratio, current ration, annual cash balance, monthly cash balance, accounts receivable and payables, etc. Showcasing this set of slides titled KPI Dashboard For Tracking Financial Management Challenges Download PDF. The topics addressed in these templates are Monthly Cash Flow, Account Payable By Days, Annual Revenue, Annual Cost, Annual Net Profits. All the content presented in this PPT design is completely editable. Download it and make adjustments in color, background, font etc. as per your unique business setting.
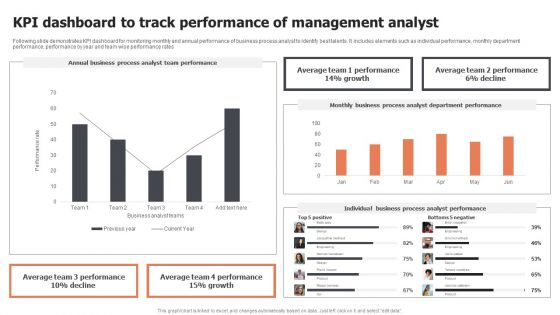
Kpi Dashboard To Track Performance Of Management Analyst Inspiration PDF
Following slide demonstrates KPI dashboard for monitoring monthly and annual performance of business process analyst to identify best talents. It includes elements such as individual performance, monthly department performance, performance by year and team wise performance rates. Showcasing this set of slides titled Kpi Dashboard To Track Performance Of Management Analyst Inspiration PDF. The topics addressed in these templates are Annual Business Process, Analyst Team Performance, Average Team. All the content presented in this PPT design is completely editable. Download it and make adjustments in color, background, font etc. as per your unique business setting.

KPI Dashboard To Monitor Land Asset Management Practices Clipart PDF
Following slide demonstrate KPI dashboard for tracking expenses incurred on real estate asset maintenance and to reduce operational cost. It includes elements such as net income, monthly income and expenses, last quarter rent collection status, rental revenue , budget, etc. Pitch your topic with ease and precision using this KPI Dashboard To Monitor Land Asset Management Practices Clipart PDF. This layout presents information on Revenue, Budget, Income. It is also available for immediate download and adjustment. So, changes can be made in the color, design, graphics or any other component to create a unique layout.
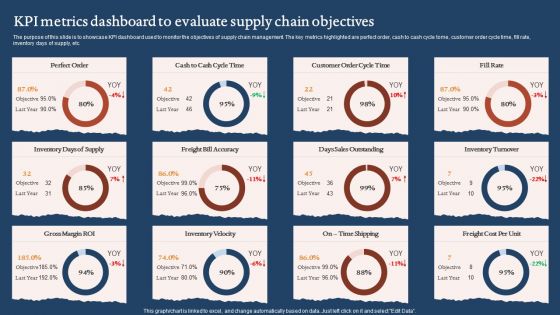
KPI Metrics Dashboard To Evaluate Supply Chain Objectives Graphics PDF
The purpose of this slide is to showcase KPI dashboard used to monitor the objectives of supply chain management. The key metrics highlighted are perfect order, cash to cash cycle tome, customer order cycle time, fill rate, inventory days of supply, etc. Pitch your topic with ease and precision using this KPI Metrics Dashboard To Evaluate Supply Chain Objectives Graphics PDF. This layout presents information on Days Sales Outstanding, Inventory Velocity, Gross Margin Roi. It is also available for immediate download and adjustment. So, changes can be made in the color, design, graphics or any other component to create a unique layout.

Problem Administration Kpi Dashboard With Bugs Status Ideas PDF
This slide covers dashboard that will help the project managers to keep the track of the bugs faced by the team members during the IT project. Pitch your topic with ease and precision using this problem administration kpi dashboard with bugs status ideas pdf. This layout presents information on problem administration kpi dashboard with bugs status. It is also available for immediate download and adjustment. So, changes can be made in the color, design, graphics or any other component to create a unique layout.
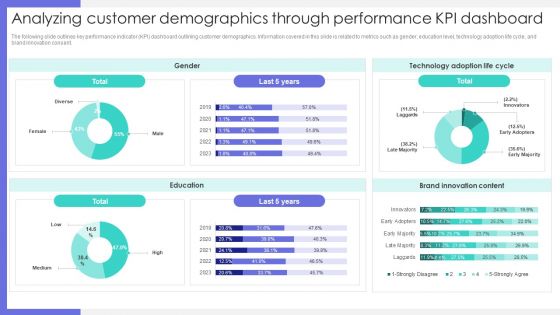
Analyzing Customer Demographics Through Performance KPI Dashboard Graphics PDF
The following slide outlines key performance indicator KPI dashboard outlining customer demographics. Information covered in this slide is related to metrics such as gender, education level, technology adoption life cycle, and brand innovation consent. Find a pre designed and impeccable Analyzing Customer Demographics Through Performance KPI Dashboard Graphics PDF. The templates can ace your presentation without additional effort. You can download these easy to edit presentation templates to make your presentation stand out from others. So, what are you waiting for Download the template from Slidegeeks today and give a unique touch to your presentation.
KPI Metrics For SQA Ppt PowerPoint Presentation Icon Deck PDF
This slide shows the KPI metrics which can be used by an organization to measure the software quality. It includes passed test defects fixed per day, Average time to test, quality ratio, etc. Showcasing this set of slides titled KPI Metrics For SQA Ppt PowerPoint Presentation Icon Deck PDF. The topics addressed in these templates are Quality Ratio, Kpis, Passed Tests. All the content presented in this PPT design is completely editable. Download it and make adjustments in color, background, font etc. as per your unique business setting.
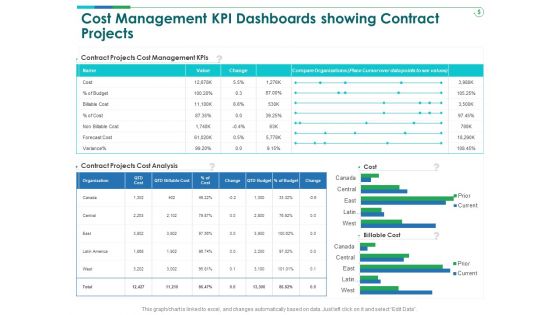
TCM Cost Management KPI Dashboards Showing Contract Projects Sample PDF
Presenting this set of slides with name tcm cost management kpi dashboards showing contract projects sample pdf. The topics discussed in these slides are cost, management, budget, organizations, variance. This is a completely editable PowerPoint presentation and is available for immediate download. Download now and impress your audience.

Performance Measurement KPI Dashboard For Fintech Firm Topics PDF
Following slide portrays performance measurement dashboard for FinTech companies with KPIs namely available cash, cash flow, ROA, working capital ratio, days sales outstanding and days payable outstanding. Create an editable Performance Measurement KPI Dashboard For Fintech Firm Topics PDF that communicates your idea and engages your audience. Whether you are presenting a business or an educational presentation, pre designed presentation templates help save time. Performance Measurement KPI Dashboard For Fintech Firm Topics PDF is highly customizable and very easy to edit, covering many different styles from creative to business presentations. Slidegeeks has creative team members who have crafted amazing templates. So, go and get them without any delay.

Search Engine Marketing Campaign KPI Dashboard Inspiration PDF
This slide represents the dashboard showing key performance metrics of an search engine marketing SEM campaign. It includes details related to key performance indicators such as ad cost, cost per conversion, clicks, conversion rate, impressions, ad impressions, cost per click, cost per thousand impressions etc. Showcasing this set of slides titled Search Engine Marketing Campaign KPI Dashboard Inspiration PDF. The topics addressed in these templates are Search Engine Marketing, Campaign KPI Dashboard. All the content presented in this PPT design is completely editable. Download it and make adjustments in color, background, font etc. as per your unique business setting.

Annual Revenue And Cost Budget Deficit KPI Dashboard Ideas PDF
The following slide depicts the yearly budget variance to compare projected and actual results. It includes elements such as net income, service revenues, profit margin, payroll cost, cost of goods sold etc. Showcasing this set of slides titled Annual Revenue And Cost Budget Deficit KPI Dashboard Ideas PDF. The topics addressed in these templates are Cost Budget, Deficit KPI Dashboard. All the content presented in this PPT design is completely editable. Download it and make adjustments in color, background, font etc. as per your unique business setting.

Saas Company KPI Dashboard With Assigned Subscriptions Formats PDF
The purpose of this slide is to showcase SaaS key performance indicator KPI metrics dashboard. Information covered in this template is related to current subscription spend, percent of stale subscription, etc. Pitch your topic with ease and precision using this Saas Company KPI Dashboard With Assigned Subscriptions Formats PDF. This layout presents information on Current Subscription Spend, Percentage Of Stale Subscriptions, True Up Cost, Underperforming Subscription Spend. It is also available for immediate download and adjustment. So, changes can be made in the color, design, graphics or any other component to create a unique layout.
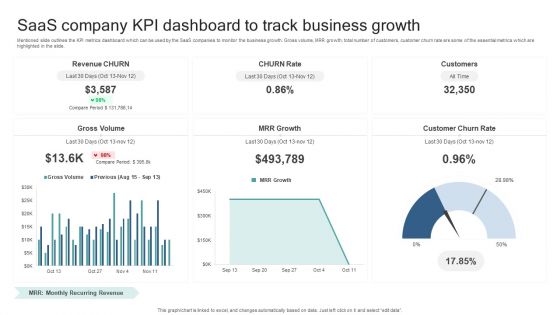
Saas Company KPI Dashboard To Track Business Growth Guidelines PDF
Mentioned slide outlines the KPI metrics dashboard which can be used by the SaaS companies to monitor the business growth. Gross volume, MRR growth, total number of customers, customer churn rate are some of the essential metrics which are highlighted in the slide. Showcasing this set of slides titled Saas Company KPI Dashboard To Track Business Growth Guidelines PDF. The topics addressed in these templates are Gross Volume, Mrr Growth, Customer Churn Rate. All the content presented in this PPT design is completely editable. Download it and make adjustments in color, background, font etc. as per your unique business setting.
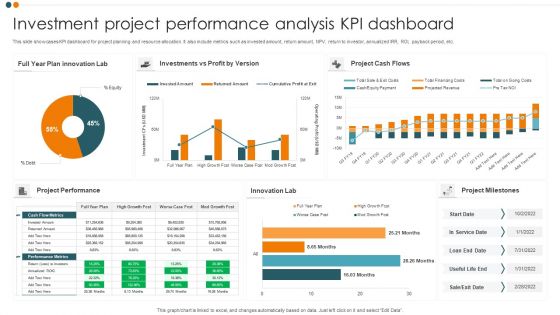
Investment Project Performance Analysis KPI Dashboard Professional PDF
This slide showcases KPI dashboard for project planning and resource allocation. It also include metrics such as invested amount, return amount, NPV, return to investor, annualized IRR, ROI, payback period, etc. Pitch your topic with ease and precision using this Investment Project Performance Analysis KPI Dashboard Professional PDF. This layout presents information on Project Cash Flows, Project Performance, Innovation Lab. It is also available for immediate download and adjustment. So, changes can be made in the color, design, graphics or any other component to create a unique layout.
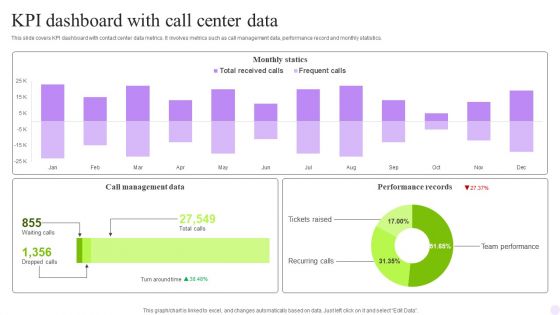
KPI Dashboard With Call Center Data Rules PDF
This slide covers contact center performance metrics KPI dashboard. It involves details such as number of total calls, average answer speed, abandon rate, data of agents performance and call abandon rate by departments. Pitch your topic with ease and precision using this KPI Dashboard With Call Center Data Rules PDF. This layout presents information on Monthly Statics, Management Data, Performance Records. It is also available for immediate download and adjustment. So, changes can be made in the color, design, graphics or any other component to create a unique layout.

KPI Framework For Manufacturing Ppt PowerPoint Presentation Gallery Themes PDF
This slide highlights key performance indicator framework for manufacturing company which includes different kpis such as labor cost, material cost, equipment utilization, average downtime etc. It also includes the success criteria for each KPI. Pitch your topic with ease and precision using this kpi framework for manufacturing ppt powerpoint presentation gallery themes pdf This layout presents information on measure, manufacturing, performance. It is also available for immediate download and adjustment. So, changes can be made in the color, design, graphics or any other component to create a unique layout.
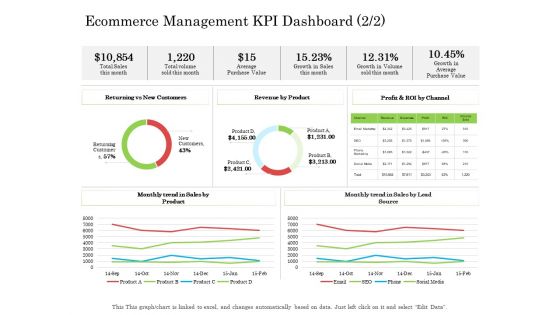
Ecommerce Management KPI Dashboard Ppt Styles Design Ideas PDF
Deliver and pitch your topic in the best possible manner with this ecommerce management kpi dashboard ppt styles design ideas pdf. Use them to share invaluable insights on average purchase value, revenue by product, sales by product and impress your audience. This template can be altered and modified as per your expectations. So, grab it now.
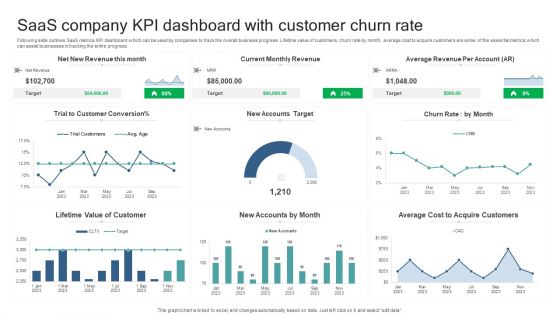
Saas Company KPI Dashboard With Customer Churn Rate Microsoft PDF
Following slide outlines SaaS metrics KPI dashboard which can be used by companies to track the overall business progress. Lifetime value of customers, churn rate by month, average cost to acquire customers are some of the essential metrics which can assist businesses in tracking the entire progress. Pitch your topic with ease and precision using this Saas Company KPI Dashboard With Customer Churn Rate Microsoft PDF. This layout presents information on Lifetime Value Of Customer, New Accounts By Month, Average Cost Acquire Customers. It is also available for immediate download and adjustment. So, changes can be made in the color, design, graphics or any other component to create a unique layout.

SEO Marketing Activities KPI Dashboard With Major Leads Formats PDF
This slide covers CMO marketing KPI dashboard to improve performance visibility of marketing. It involves details such as conversion metrics, quality of trial leads, engagement from social media and top channels.Showcasing this set of slides titled SEO Marketing Activities KPI Dashboard With Major Leads Formats PDF. The topics addressed in these templates are Conversion Metrics, Media Engagement, Conversion Rate. All the content presented in this PPT design is completely editable. Download it and make adjustments in color, background, font etc. as per your unique business setting.
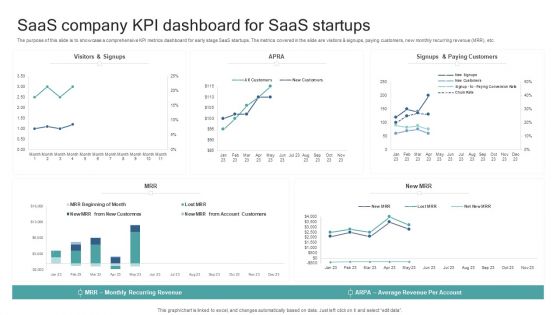
Saas Company KPI Dashboard For Saas Startups Background PDF
The purpose of this slide is to showcase a comprehensive KPI metrics dashboard for early stage SaaS startups. The metrics covered in the slide are visitors and signups, paying customers, new monthly recurring revenue MRR, etc. Showcasing this set of slides titled Saas Company KPI Dashboard For Saas Startups Background PDF. The topics addressed in these templates are Average Revenue Per Account, Monthly Recurring Revenue. All the content presented in this PPT design is completely editable. Download it and make adjustments in color, background, font etc. as per your unique business setting.
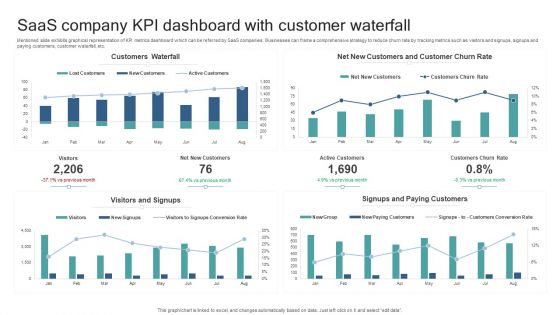
Saas Company KPI Dashboard With Customer Waterfall Slides PDF
Mentioned slide exhibits graphical representation of KPI metrics dashboard which can be referred by SaaS companies. Businesses can frame a comprehensive strategy to reduce churn rate by tracking metrics such as visitors and signups, signups and paying customers, customer waterfall, etc. Pitch your topic with ease and precision using this Saas Company KPI Dashboard With Customer Waterfall Slides PDF. This layout presents information on Customers Waterfall, Visitors And Signups, Signups And Paying Customers. It is also available for immediate download and adjustment. So, changes can be made in the color, design, graphics or any other component to create a unique layout.
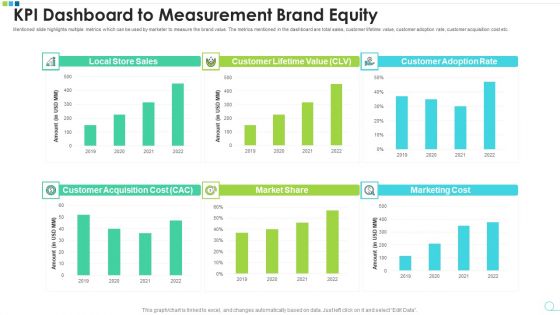
KPI Dashboard To Measurement Brand Equity Microsoft PDF
Mentioned slide highlights multiple metrics which can be used by marketer to measure the brand value. The metrics mentioned in the dashboard are total sales, customer lifetime value, customer adoption rate, customer acquisition cost etc. Pitch your topic with ease and precision using this kpi dashboard to measurement brand equity microsoft pdf. This layout presents information on kpi dashboard to measurement brand equity. It is also available for immediate download and adjustment. So, changes can be made in the color, design, graphics or any other component to create a unique layout.

Hazard Administration Crisis Management KPI Metrics Ppt Slides Shapes PDF
Presenting this set of slides with name hazard administration crisis management kpi metrics ppt slides shapes pdf. The topics discussed in these slides are degree of completeness of it risk management framework, it risk management structures and activities set up vs planned. This is a completely editable PowerPoint presentation and is available for immediate download. Download now and impress your audience.

KPI Dashboard To Measure Success Of IMC Strategy Microsoft PDF
This slide shows KPI dashboard to measure success of integrated marketing communication plan which can be referred by marketers in making decisions for future consumer campaigns. It includes information about page visit, bounce rate, user type, etc. Pitch your topic with ease and precision using this KPI Dashboard To Measure Success Of IMC Strategy Microsoft PDF. This layout presents information on Average, Bounce Rate. It is also available for immediate download and adjustment. So, changes can be made in the color, design, graphics or any other component to create a unique layout.
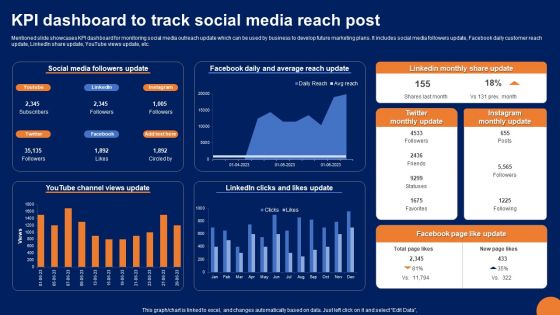
KPI Dashboard To Track Social Media Reach Post Portrait PDF
Mentioned slide showcases KPI dashboard for monitoring social media outreach update which can be used by business to develop future marketing plans. It includes social media followers update, Facebook daily customer reach update, LinkedIn share update, YouTube views update, etc. Showcasing this set of slides titled KPI Dashboard To Track Social Media Reach Post Portrait PDF. The topics addressed in these templates are Social Media Followers Update, Facebook Daily, Average Reach Update. All the content presented in this PPT design is completely editable. Download it and make adjustments in color, background, font etc. as per your unique business setting.
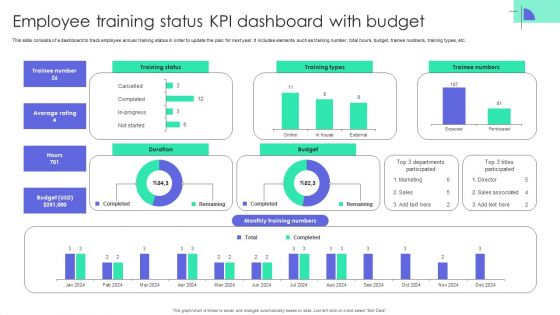
Employee Training Status KPI Dashboard With Budget Summary PDF
This slide consists of a dashboard to track employee annual training status in order to update the plan for next year. It includes elements such as training number, total hours, budget, trainee numbers, training types, etc. Pitch your topic with ease and precision using this Employee Training Status KPI Dashboard With Budget Summary PDF. This layout presents information on Employee Training Status, KPI Dashboard With Budget. It is also available for immediate download and adjustment. So, changes can be made in the color, design, graphics or any other component to create a unique layout.
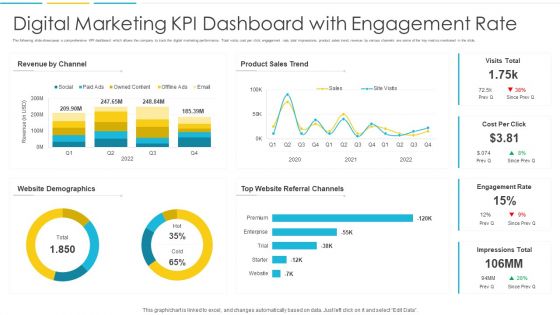
Digital Marketing KPI Dashboard With Engagement Rate Background PDF
The following slide showcases a comprehensive KPI dashboard which allows the company to track the digital marketing performance. Total visits, cost per click, engagement rate, total impressions, product sales trend, revenue by various channels are some of the key metrics mentioned in the slide. Showcasing this set of slides titled Digital Marketing KPI Dashboard With Engagement Rate Background PDF. The topics addressed in these templates are Demographics, Revenue, Sales. All the content presented in this PPT design is completely editable. Download it and make adjustments in color, background, font etc. as per your unique business setting.
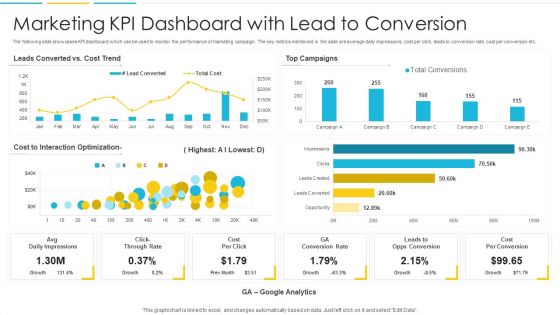
Marketing KPI Dashboard With Lead To Conversion Structure PDF
The following slide showcases KPI dashboard which can be used to monitor the performance of marketing campaign. The key metrics mentioned in the slide are average daily impressions, cost per click, leads to conversion rate, cost per conversion etc. Showcasing this set of slides titled Marketing KPI Dashboard With Lead To Conversion Structure PDF. The topics addressed in these templates are Impressions, Optimization, Cost. All the content presented in this PPT design is completely editable. Download it and make adjustments in color, background, font etc. as per your unique business setting.

Software Product Evaluation KPI Dashboard With Average Defects Infographics PDF
Mentioned slide indicates software product testing KPI dashboard which shows various aspects like defects by type and severity, average solution over last 18 weeks etc. These metrics can assist the developers to evaluate the performance of software by performing test.Showcasing this set of slides titled Software Product Evaluation KPI Dashboard With Average Defects Infographics PDF The topics addressed in these templates are Software Product, Evaluation Dashboard, Average Defects All the content presented in this PPT design is completely editable. Download it and make adjustments in color, background, font etc. as per your unique business setting.
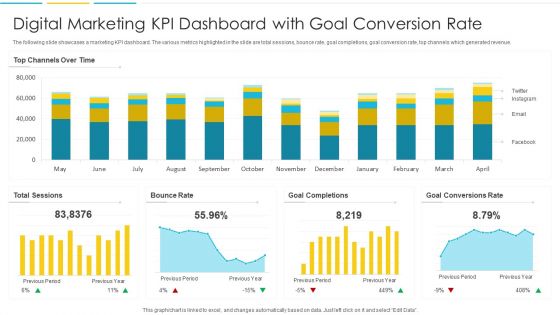
Digital Marketing KPI Dashboard With Goal Conversion Rate Ideas PDF
The following slide showcases a marketing KPI dashboard. The various metrics highlighted in the slide are total sessions, bounce rate, goal completions, goal conversion rate, top channels which generated revenue. Pitch your topic with ease and precision using this Digital Marketing KPI Dashboard With Goal Conversion Rate Ideas PDF. This layout presents information on Rate, Goal, Conversions. It is also available for immediate download and adjustment. So, changes can be made in the color, design, graphics or any other component to create a unique layout.
Monthly Project Investment Expense Tracking KPI Dashboard Themes PDF
This slide showcases KPI dashboard for analysing the variance between billed and budgeted expenses. It also include metrics such as project budget, potential, billed, cost, margin billed vs. budget labour cost, hours details by resources, etc. Pitch your topic with ease and precision using this Monthly Project Investment Expense Tracking KPI Dashboard Themes PDF. This layout presents information on Project Summary, Sales Potential. It is also available for immediate download and adjustment. So, changes can be made in the color, design, graphics or any other component to create a unique layout.
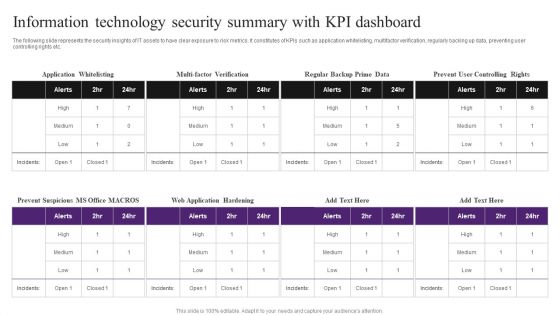
Information Technology Security Summary With KPI Dashboard Inspiration PDF
The following slide represents the security insights of IT assets to have clear exposure to risk metrics. It constitutes of KPIs such as application whitelisting, multifactor verification, regularly backing up data, preventing user controlling rights etc. Pitch your topic with ease and precision using this Information Technology Security Summary With KPI Dashboard Inspiration PDF. This layout presents information on Information Technology Security, Summary With KPI Dashboard. It is also available for immediate download and adjustment. So, changes can be made in the color, design, graphics or any other component to create a unique layout.

Customer Service Measurement KPI Dashboard Ppt Infographics Themes PDF
Mentioned slide portrays customer service measurement KPI dashboard that includes metrics namely request volume vs. service level, customer satisfaction, customer retention, costs per support and average time to solve issue. If your project calls for a presentation, then Slidegeeks is your go-to partner because we have professionally designed, easy-to-edit templates that are perfect for any presentation. After downloading, you can easily edit Customer Service Measurement KPI Dashboard Ppt Infographics Themes PDF and make the changes accordingly. You can rearrange slides or fill them with different images. Check out all the handy templates
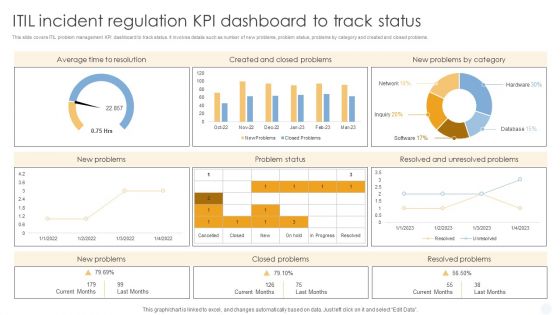
ITIL Incident Regulation Kpi Dashboard To Track Status Mockup PDF
This slide covers ITIL problem management KPI dashboard to track status. It involves details such as number of new problems, problem status, problems by category and created and closed problems.Showcasing this set of slides titled ITIL Incident Regulation Kpi Dashboard To Track Status Mockup PDF. The topics addressed in these templates are Average Time Resolution, Created Problems, Problems Category. All the content presented in this PPT design is completely editable. Download it and make adjustments in color, background, font etc. as per your unique business setting.
KPI Dashboard For Tracking Brand Communication Techniques Performance Topics PDF
The following slide illustrates dashboard which helps brand managers to improve their communication campaign performance. It presents information related to campaigns, cost per acquisitions, etc. Pitch your topic with ease and precision using this KPI Dashboard For Tracking Brand Communication Techniques Performance Topics PDF. This layout presents information on KPI Dashboard, Tracking Brand Communication, Techniques Performance. It is also available for immediate download and adjustment. So, changes can be made in the color, design, graphics or any other component to create a unique layout.
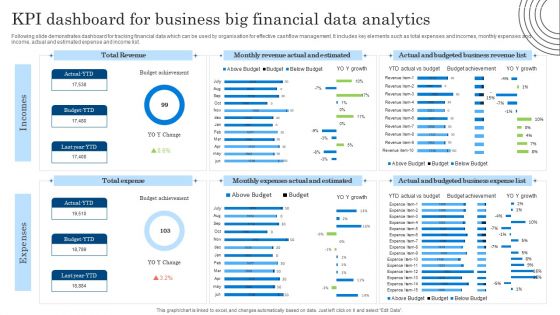
KPI Dashboard For Business Big Financial Data Analytics Diagrams PDF
Following slide demonstrates dashboard for tracking financial data which can be used by organisation for effective cashflow management. It includes key elements such as total expenses and incomes, monthly expenses and income, actual and estimated expense and income list. Showcasing this set of slides titled KPI Dashboard For Business Big Financial Data Analytics Diagrams PDF. The topics addressed in these templates are KPI Dashboard, Business Big Financial, Data Analytics. All the content presented in this PPT design is completely editable. Download it and make adjustments in color, background, font etc. as per your unique business setting.
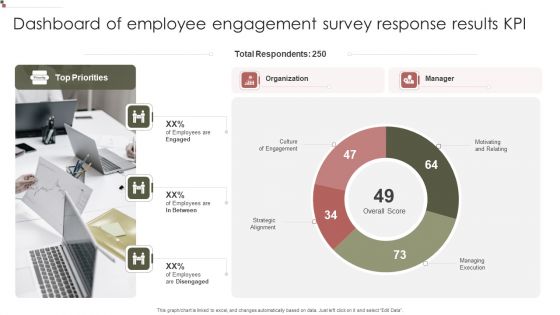
Dashboard Of Employee Engagement Survey Response Results KPI Microsoft PDF
Showcasing this set of slides titled Dashboard Of Employee Engagement Survey Response Results KPI Microsoft PDF. The topics addressed in these templates are Total Respondents, Organization Culture, Engagement. All the content presented in this PPT design is completely editable. Download it and make adjustments in color, background, font etc. as per your unique business setting.

Revenue Analysis KPI Dashboard Post Building Marketing Strategy Infographics PDF
Following slide outlines a revenue analysis dashboard showcasing the business results after implementing marketing strategy. It provides information about total revenue for the month, revenue for year to date, revenue trend, product revenue and services revenue etc. Pitch your topic with ease and precision using this revenue analysis kpi dashboard post building marketing strategy infographics pdf. This layout presents information on revenue analysis kpi dashboard post building marketing strategy. It is also available for immediate download and adjustment. So, changes can be made in the color, design, graphics or any other component to create a unique layout.
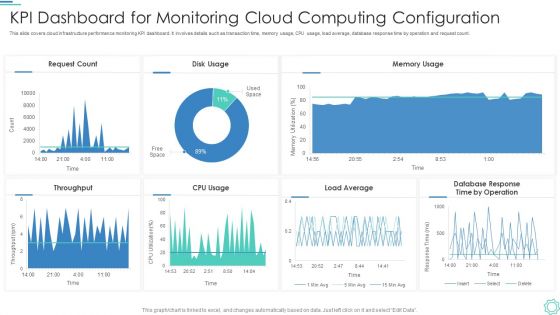
Kpi Dashboard For Monitoring Cloud Computing Configuration Portrait PDF
This slide covers cloud infrastructure performance monitoring KPI dashboard. It involves details such as transaction time, memory usage, CPU usage, load average, database response time by operation and request count.Showcasing this set of slides titled Kpi Dashboard For Monitoring Cloud Computing Configuration Portrait PDF. The topics addressed in these templates are Request Count, Disk Usage, Memory Usage. All the content presented in this PPT design is completely editable. Download it and make adjustments in color, background, font etc. as per your unique business setting.

Food And Beverage Industry Kpi Dashboard Professional PDF
This slide covers the food and beverage analysis dashboard. It include KPIs such as revenue by location, top five expenses by account, revenue by type, top five expenses by department, etc.Showcasing this set of slides titled Food And Beverage Industry Kpi Dashboard Professional PDF. The topics addressed in these templates are Food And Beverage Industry KPI Dashboard. All the content presented in this PPT design is completely editable. Download it and make adjustments in color, background, font etc. as per your unique business setting
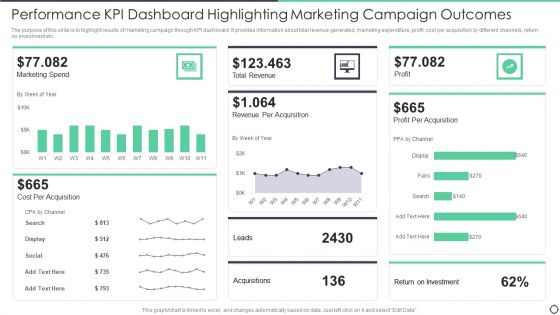
Performance Kpi Dashboard Highlighting Marketing Campaign Outcomes Topics PDF
The purpose of this slide is to highlight results of marketing campaign through KPI dashboard. It provides information about total revenue generated, marketing expenditure, profit, cost per acquisition by different channels, return on investment etc. Pitch your topic with ease and precision using this Performance Kpi Dashboard Highlighting Marketing Campaign Outcomes Topics PDF. This layout presents information on Cost, Marketing, Revenue. It is also available for immediate download and adjustment. So, changes can be made in the color, design, graphics or any other component to create a unique layout.

Social Media Marketing Results With Kpi Scorecard Demonstration PDF
The purpose of this slide is to outline the results of different social media marketing channels through KPIs. Followers, impressions, link counts, engagement rate, average order value are some of the key KPIs which are used to measure the marketing results. Showcasing this set of slides titled Social Media Marketing Results With Kpi Scorecard Demonstration PDF. The topics addressed in these templates are Social Media Marketing Results With Kpi Scorecard. All the content presented in this PPT design is completely editable. Download it and make adjustments in color, background, font etc. as per your unique business setting.
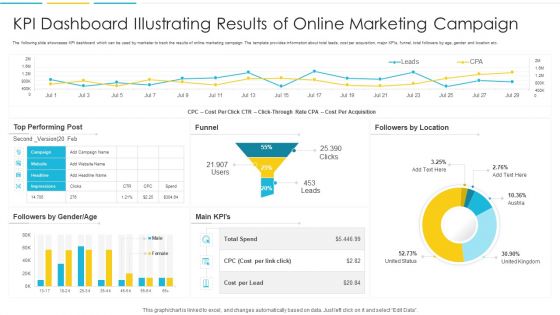
KPI Dashboard Illustrating Results Of Online Marketing Campaign Slides PDF
The following slide showcases KPI dashboard which can be used by marketer to track the results of online marketing campaign. The template provides information about total leads, cost per acquisition, major KPIs, funnel, total followers by age, gender and location etc. Showcasing this set of slides titled KPI Dashboard Illustrating Results Of Online Marketing Campaign Slides PDF. The topics addressed in these templates are Cost, Location, Performing. All the content presented in this PPT design is completely editable. Download it and make adjustments in color, background, font etc. as per your unique business setting

Marketing KPI Dashboard With Cost Per Click Infographics PDF
The following slide showcases a comprehensive KPI dashboard used to analyze the pay-per-click advertising performance. The KPIs covered in the slide are total ad cost, total clicks, impressions, cost per conversion, conversion rate, cost per click etc. Pitch your topic with ease and precision using this Marketing KPI Dashboard With Cost Per Click Infographics PDF. This layout presents information on Conversions, Cost, Impressions. It is also available for immediate download and adjustment. So, changes can be made in the color, design, graphics or any other component to create a unique layout.
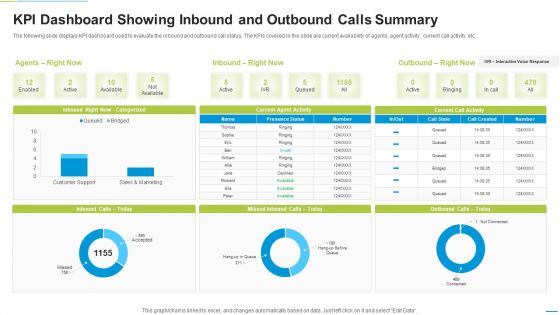
KPI Dashboard Showing Inbound And Outbound Calls Summary Formats PDF
The following slide displays KPI dashboard used to evaluate the inbound and outbound call status. The KPIs covered in the slide are current availability of agents, agent activity, current call activity etc. Showcasing this set of slides titled KPI Dashboard Showing Inbound And Outbound Calls Summary Formats PDF. The topics addressed in these templates are Current Agent Activity, Current Call Activity, Inbound Categorized. All the content presented in this PPT design is completely editable. Download it and make adjustments in color, background, font etc. as per your unique business setting.

Skill Evaluation KPI Dashboard For New Hiring Download PDF
Following slide outlines talent assessment KPI dashboard for hiring new employees at workplace. It also provides relevant information about elements like total applicants, shortlisted candidates, hired candidates, cost to hire, applicant details, positions by departments etc.Showcasing this set of slides titled Skill Evaluation KPI Dashboard For New Hiring Download PDF The topics addressed in these templates are Hired Candidates, Rejected Candidate, Shortlisted Candidates All the content presented in this PPT design is completely editable. Download it and make adjustments in color, background, font etc. as per your unique business setting.

HR Analytical Workforce Administration Kpi Dashboard Introduction PDF
The below slide provides an insights to various KPAs of HR analytics. It includes elements such as extra time worked, leave hours, job order wise workforce expenses, expected versus actual hours etc. Showcasing this set of slides titled HR Analytical Workforce Administration Kpi Dashboard Introduction PDF. The topics addressed in these templates are Workforce Expenses, Administration KPI Dashboard. All the content presented in this PPT design is completely editable. Download it and make adjustments in color, background, font etc. as per your unique business setting.
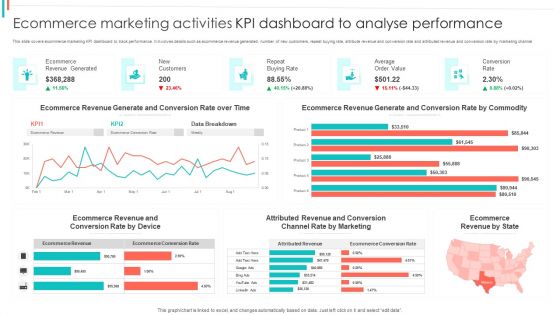
Ecommerce Marketing Activities KPI Dashboard To Analyse Performance Guidelines PDF
This slide covers ecommerce marketing KPI dashboard to track performance. It involves details such as ecommerce revenue generated, number of new customers, repeat buying rate, attribute revenue and conversion rate and attributed revenue and conversion rate by marketing channel.Pitch your topic with ease and precision using this Ecommerce Marketing Activities KPI Dashboard To Analyse Performance Guidelines PDF. This layout presents information on Revenue Generated, Ecommerce Revenue, Generate Conversion. It is also available for immediate download and adjustment. So, changes can be made in the color, design, graphics or any other component to create a unique layout.
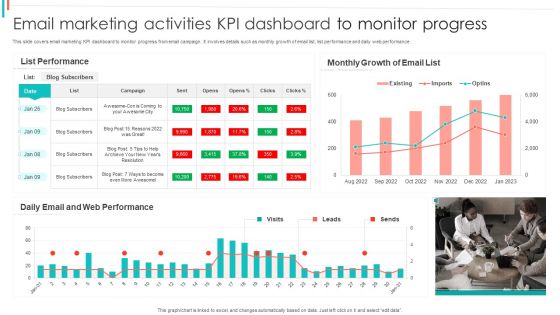
Email Marketing Activities KPI Dashboard To Monitor Progress Pictures PDF
This slide covers email marketing KPI dashboard to monitor progress from email campaign. It involves details such as monthly growth of email list, list performance and daily web performance.Showcasing this set of slides titled Email Marketing Activities KPI Dashboard To Monitor Progress Pictures PDF. The topics addressed in these templates are List Performance, Monthly Growth, Web Performance. All the content presented in this PPT design is completely editable. Download it and make adjustments in color, background, font etc. as per your unique business setting.
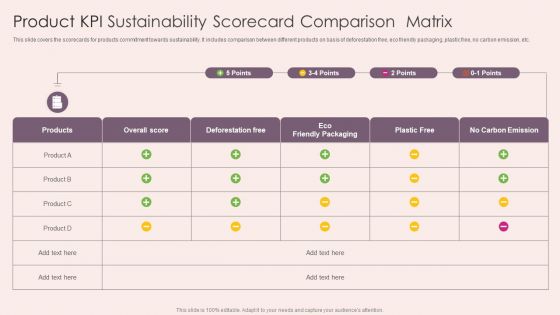
Product KPI Sustainability Scorecard Comparison Matrix Demonstration PDF
This slide covers the scorecards for products commitment towards sustainability. It includes comparison between different products on basis of deforestation free, eco friendly packaging, plastic free, no carbon emission, etc. Showcasing this set of slides titled Product KPI Sustainability Scorecard Comparison Matrix Demonstration PDF. The topics addressed in these templates are Product Kpi Sustainability, Scorecard Comparison Matrix. All the content presented in this PPT design is completely editable. Download it and make adjustments in color, background, font etc. as per your unique business setting.

Web Analysis Summary KPI Dashboard With Conversion Rate Themes PDF
This slide depicts website analytics report dashboard to determine performance. It involves details such as total conversions, number of total users, conversion and engagement rate. Pitch your topic with ease and precision using this Web Analysis Summary KPI Dashboard With Conversion Rate Themes PDF. This layout presents information on Web Analysis Summary, KPI Dashboard, Conversion Rate. It is also available for immediate download and adjustment. So, changes can be made in the color, design, graphics or any other component to create a unique layout.
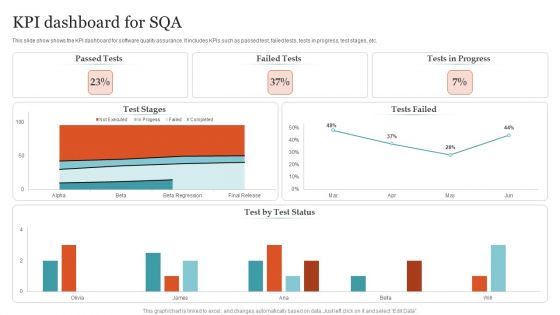
KPI Dashboard For SQA Ppt PowerPoint Presentation Gallery Structure PDF
This slide show shows the KPI dashboard for software quality assurance. It includes KPIs such as passed test, failed tests, tests in progress, test stages, etc. Pitch your topic with ease and precision using this KPI Dashboard For SQA Ppt PowerPoint Presentation Gallery Structure PDF. This layout presents information on Passed Tests, Failed Tests, Tests Progress . It is also available for immediate download and adjustment. So, changes can be made in the color, design, graphics or any other component to create a unique layout.

 Home
Home