Executive Kpi

Sales Quarterly Performance Review System Service Support Department Infographics PDF
This slide shows sales customer service division quarterly business review QBR. It provides information about quality, accuracy, absenteeism, attrition, call flow, employee tenure, etc. Pitch your topic with ease and precision using this Sales Quarterly Performance Review System Service Support Department Infographics PDF. This layout presents information on KPI, Goal, Quality Accuracy. It is also available for immediate download and adjustment. So, changes can be made in the color, design, graphics or any other component to create a unique layout.

Business Intelligence And Big Business Data Analytics Requirement Table Formats PDF
In this slide, we are tabulating the key requirements required for data analytics project in various fields of business. It includes timeframe and KPIs to measure the project results. Deliver an awe inspiring pitch with this creative business intelligence and big business data analytics requirement table formats pdf bundle. Topics like category management, kpi, analytics, sales orders, retailer forecast can be discussed with this completely editable template. It is available for immediate download depending on the needs and requirements of the user.

Data Management Presentation Powerpoint Templates
This is a data management presentation powerpoint templates. This is a five stage process. The stages in this process are new technology, data management, decision support, data analysis, data sources.

Business Diagram Sample Advantages Benefits Of Big Data Analysis And Modelling Ppt Slide
Explain the concept of sample advantages and benefits of big data analysis with this unique diagram. This slide contains the graphic of data icons. Use this slide to present data analysis and modeling related topics in any presentation.

Data Migration PowerPoint Template Ppt PowerPoint Presentation Portfolio Layout
This is a data migration powerpoint template ppt powerpoint presentation portfolio layout. This is a six stage process. The stages in this process are Migration Approach, Data Analysis, Migration Design, Migration Execution, Migration Testing.
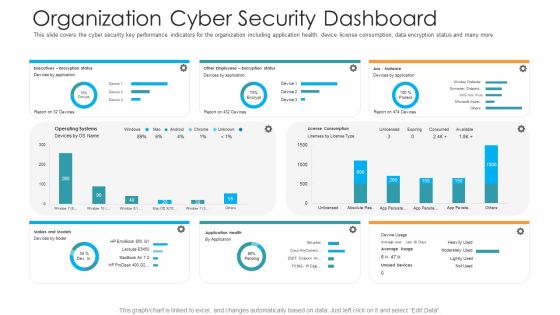
Organization Cyber Security Dashboard Hacking Prevention Awareness Training For IT Security Professional PDF
This slide covers the cyber security key performance indicators for the organization including application health, device license consumption, data encryption status and many more. Deliver and pitch your topic in the best possible manner with this organization cyber security dashboard hacking prevention awareness training for it security professional pdf. Use them to share invaluable insights on executives, license consumption, operating systems and impress your audience. This template can be altered and modified as per your expectations. So, grab it now.

Data Management Bom Management Ppt Sample
This is a data management bom management ppt sample. This is a six stage process. The stages in this process are arrows, business, marketing.
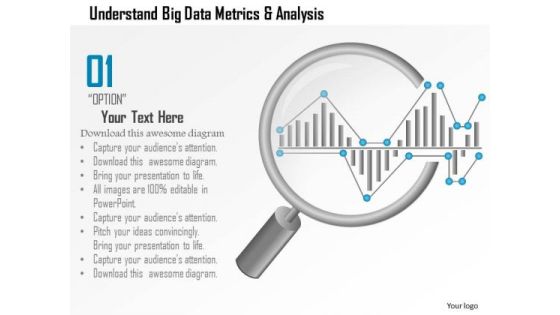
Business Diagram Understand Big Data Metrics And Analysis Showing By Magnifying Glass Ppt Slide
This PPT slide has been designed with big data metrics and magnifying glass. This diagram helps to portray concept of data analysis and data search. Download this diagram to make professional presentations.

Arrow Infographics For Financial Data Analysis Powerpoint Template
This PowerPoint slide contains diagram of arrows infographic. This professional slide helps to exhibit financial data analysis for business growth. Use this PowerPoint template to make impressive presentations.
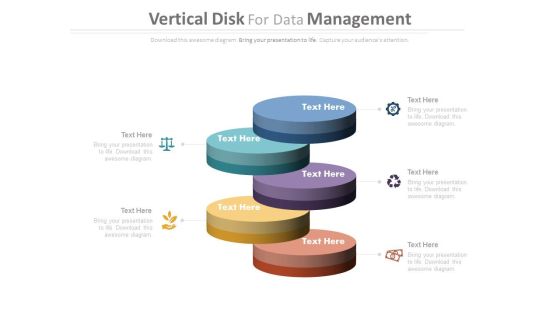
Vertical Steps For Data Management Powerpoint Template
This PowerPoint template contains diagram of vertical steps. You may use this PPT slide to depict data management. The color coding of this template is specifically designed to highlight you points.
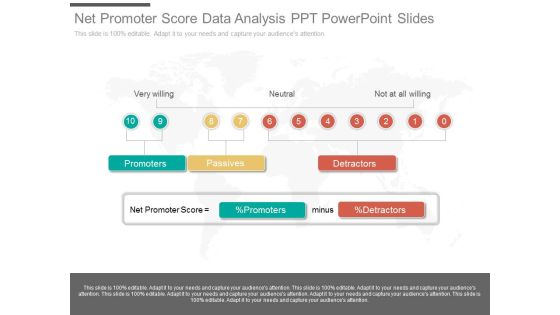
Net Promoter Score Data Analysis Ppt Powerpoint Slides
This is a net promoter score data analysis ppt powerpoint slides. This is a ten stage process. The stages in this process are very willing, neutral, not at all willing, promoters, passives, detractors, net promoter score, percentage promoters, minus, percentage detractors.

Master Data Management Regulatory Compliance Ppt Example
This is a master data management regulatory compliance ppt example. This is a three stage process. The stages in this process are business, marketing.
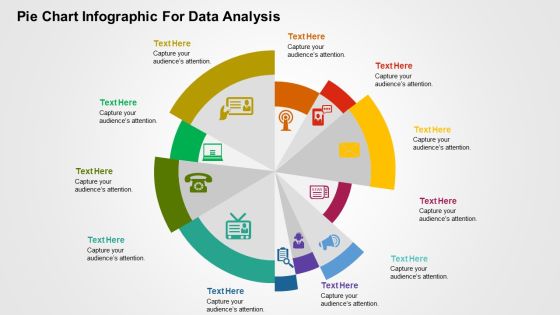
Pie Chart Infographic For Data Analysis PowerPoint Templates
This is one of the most downloaded PowerPoint template. This slide can be used for various purposes and to explain a number of processes. This can be included in your presentation to explain each step of a process and even include its relevance and importance in a single diagram. Using the uneven circular structure of the pie chart, the presenter can also explain random steps or highlight particular steps of process or parts of an organization or business that need special attention of any kind to the audience. Additionally, you can use this slide to show a transformation process or highlight key features of a product.
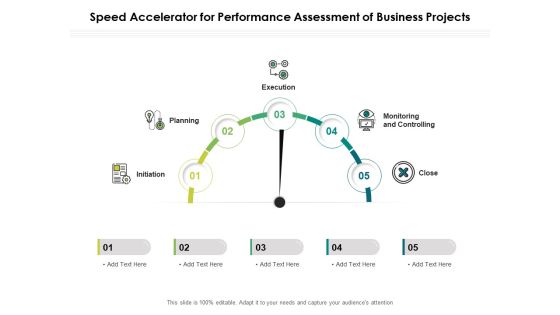
Speed Accelerator For Performance Assessment Of Business Projects Ppt PowerPoint Presentation Show Example Introduction PDF
Presenting this set of slides with name speed accelerator for performance assessment of business projects ppt powerpoint presentation show example introduction pdf. This is a five stage process. The stages in this process are initiation, planning, execution, monitoring and controlling, close. This is a completely editable PowerPoint presentation and is available for immediate download. Download now and impress your audience.

Five Warehouse Key Efficiency Management Indicators Analysis Table Demonstration PDF
This slide shows the table representing the key metrics for measurement of performance of warehouse system of an organization. It includes data related to five activities of receiving, put away, storage, order picking and shipping of products. Showcasing this set of slides titled Five Warehouse Key Efficiency Management Indicators Analysis Table Demonstration PDF. The topics addressed in these templates are Activity, Received, Storage. All the content presented in this PPT design is completely editable. Download it and make adjustments in color, background, font etc. as per your unique business setting.

Data Management Marketing Analysis Ppt Slide
This is a data management marketing analysis ppt slide. This is a eight stage process. The stages in this process are marketing, sales, business, success.

Data Reports Visualization Vector Ppt PowerPoint Presentation Visual Aids Deck
Presenting this set of slides with name data reports visualization vector ppt powerpoint presentation visual aids deck. The topics discussed in these slides are data visualization icon, research analysis, business focus. This is a completely editable PowerPoint presentation and is available for immediate download. Download now and impress your audience.

Data Collection Powerpoint Slides Templates Download
This is a data collection powerpoint slides templates download. This is a four stage process. The stages in this process are review and update, implement plan, identify problems, data collection.
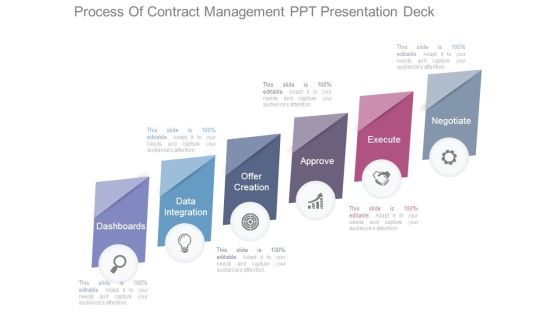
Process Of Contract Management Ppt Presentation Deck
This is a process of contract management ppt presentation Deck. This is a six stage process. The stages in this process are dashboards, data integration, offer creation, approve, execute, negotiate.

Big Data Funnel Diagram Powerpoint Templates
Our above business slide has been designed with graphics of big data funnel diagram. This slide is suitable to present data analysis, storage and sharing. Use this business diagram to present your work in a more smart and precise manner.
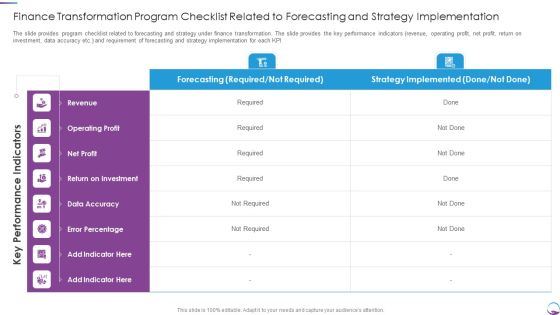
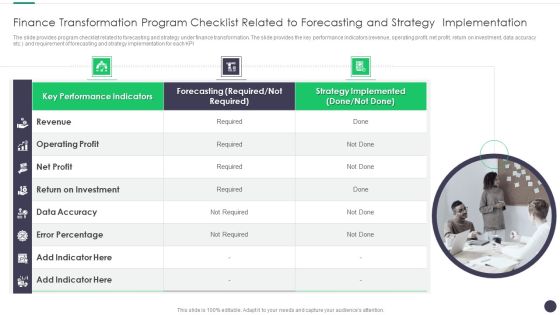
Finance Transformation Program Checklist Related To Forecasting And Strategy Implementation Pictures PDF
The slide provides program checklist related to forecasting and strategy under finance transformation. The slide provides the key performance indicators revenue, operating profit, net profit, return on investment, data accuracy etc. and requirement of forecasting and strategy implementation for each KPI. Deliver and pitch your topic in the best possible manner with this Finance Transformation Program Checklist Related To Forecasting And Strategy Implementation Pictures PDF. Use them to share invaluable insights on Finance Transformation Program Checklist Related To Forecasting And Strategy Implementation and impress your audience. This template can be altered and modified as per your expectations. So, grab it now.
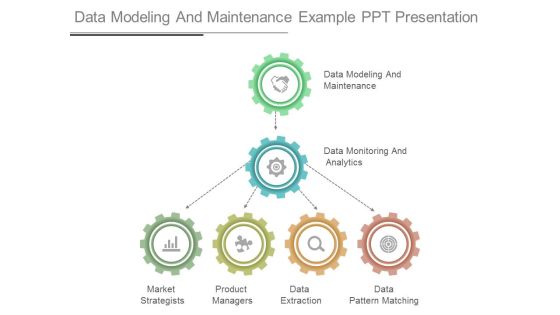
Data Modeling And Maintenance Example Ppt Presentation
This is a data modeling and maintenance example ppt presentation. This is a six stage process. The stages in this process are data modeling and maintenance, data monitoring and analytics, market strategists, product managers, data extraction, data pattern matching.

Social Data And Communication Data Representation Powerpoint Template
This PPT slide has been designed with text layout. This PowerPoint template is designed to display text message in visual manner. This professional slide helps in making an instant impact on viewers.
Pie Chart For Data Presentation Vector Ppt PowerPoint Presentation Summary Files
Presenting this set of slides with name pie chart for data presentation vector ppt powerpoint presentation summary files. The topics discussed in these slides are data visualization icon, research analysis, business focus. This is a completely editable PowerPoint presentation and is available for immediate download. Download now and impress your audience.
Finance And Accounting Online Conversion Plan Finance Transformation Program Brochure PDF
The slide provides program checklist related to forecasting and strategy under finance transformation. The slide provides the key performance indicators revenue, operating profit, net profit, return on investment, data accuracy etc. and requirement of forecasting and strategy implementation for each KPI. This is a Finance And Accounting Online Conversion Plan Finance Transformation Program Brochure PDF template with various stages. Focus and dispense information on one stage using this creative set, that comes with editable features. It contains large content boxes to add your information on topics like Performance Indicators, Strategy Implemented, Revenue. You can also showcase facts, figures, and other relevant content using this PPT layout. Grab it now.

Multi Segment Circle For Data Interpretation Powerpoint Template
This PowerPoint template has been designed with circular web diagram. This diagram is useful to display outline of a business plan. Visual effect helps in maintaining the flow of the discussion and provides more clarity to the subject.

Organisational Level Employee Key Performance Indicators Performance Indicators Rules PDF
The following slide highlights the organisational level staff key performance Indicators illustrating key headings KPI, description, benchmark and value. It also depicts revenue per employee, profit per FTE, human capital ROI, absenteeism rate and overtime per employee Showcasing this set of slides titled Organisational Level Employee Key Performance Indicators Performance Indicators Rules PDF The topics addressed in these templates are Revenue Compensation, Overtime Employee, Benchmark All the content presented in this PPT design is completely editable. Download it and make adjustments in color, background, font etc. as per your unique business setting.

Four Staged Numeric Tags For Data Representation Powerpoint Template
Our above PowerPoint slide contains diagram of four numeric tags. Download this business slide for data representations. Use this diagram to impart more clarity to data and to create more sound impact on viewers.
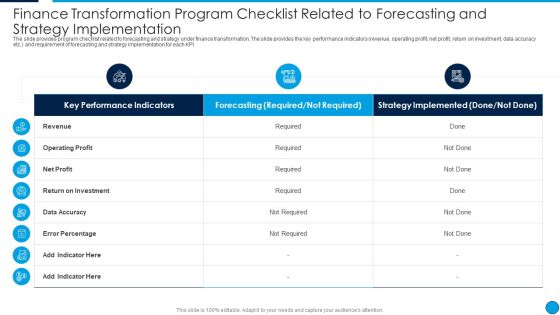
Summary Finance Transformation Program Checklist Related To Forecasting Clipart PDF
The slide provides program checklist related to forecasting and strategy under finance transformation. The slide provides the key performance indicators revenue, operating profit, net profit, return on investment, data accuracy etc. and requirement of forecasting and strategy implementation for each KPI. Deliver and pitch your topic in the best possible manner with this Summary Finance Transformation Program Checklist Related To Forecasting Clipart PDF. Use them to share invaluable insights on Key Performance Indicators, Forecasting Required, Not Required, Strategy Implemented, Return On Investment and impress your audience. This template can be altered and modified as per your expectations. So, grab it now.
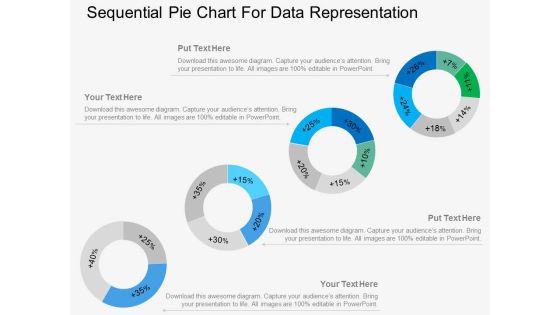
Four Sequential Pie Charts For Data Representation Powerpoint Template
Our above PowerPoint template displays infographic diagram of sequential pie chart. This diagram slide may be used for data representation in visual manner. Above slide provide ideal backdrop to make business presentations.
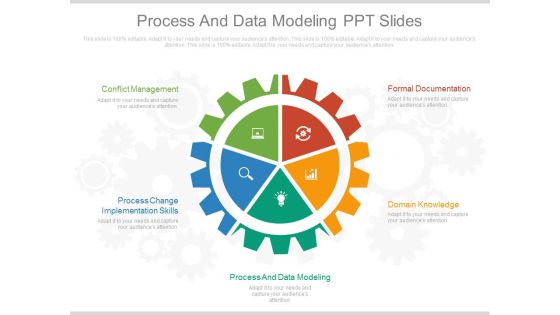
Process And Data Modeling Ppt Slides
This is a process and data modeling ppt slides. This is a five stage process. The stages in this process are marketing, business, success.
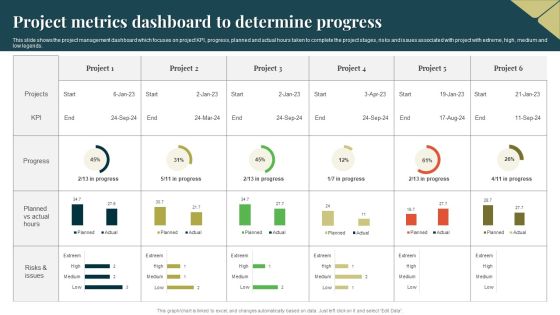
Project Metrics Dashboard To Determine Progress Guidelines PDF
This slide shows the project management dashboard which focuses on project KPI, progress, planned and actual hours taken to complete the project stages, risks and issues associated with project with extreme, high, medium and low legends. Showcasing this set of slides titled Project Metrics Dashboard To Determine Progress Guidelines PDF. The topics addressed in these templates are Project Metrics Dashboard, Determine Progress. All the content presented in this PPT design is completely editable. Download it and make adjustments in color, background, font etc. as per your unique business setting.
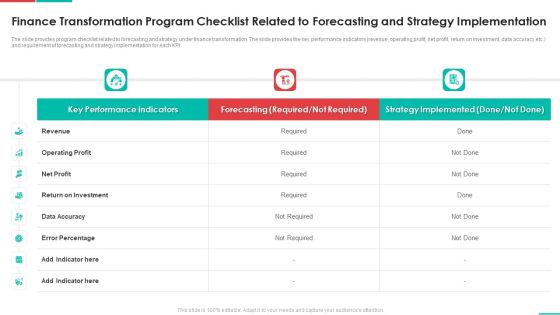
Roadmap For Financial Accounting Transformation Finance Transformation Program Checklist Related Themes PDF
The slide provides program checklist related to forecasting and strategy under finance transformation. The slide provides the key performance indicators revenue, operating profit, net profit, return on investment, data accuracy etc. and requirement of forecasting and strategy implementation for each KPI. Deliver and pitch your topic in the best possible manner with this roadmap for financial accounting transformation finance transformation program checklist related themes pdf. Use them to share invaluable insights on revenue, operating profit, net profit, return on investment, data accuracy and impress your audience. This template can be altered and modified as per your expectations. So, grab it now.
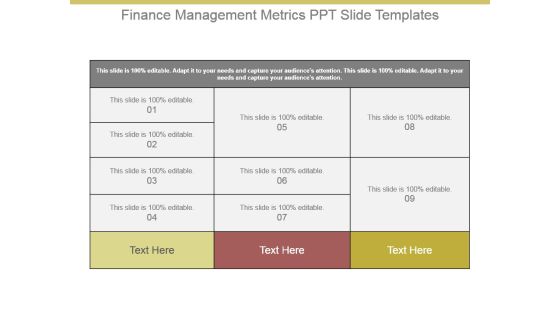
Finance Management Metrics Ppt Slide Templates
This is a finance management metrics ppt slide templates. This is a nine stage process. The stages in this process are business, marketing, management, table.
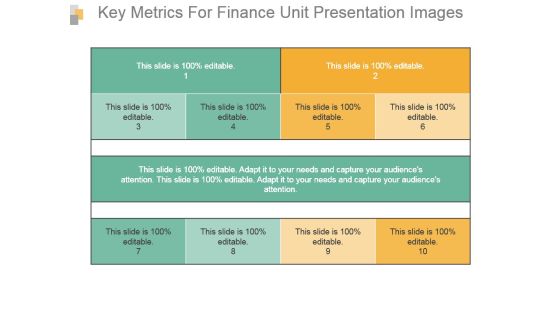
Key Metrics For Finance Unit Presentation Images
This is a key metrics for finance unit presentation images. This is a three stage process. The stages in this process are business, management, strategy, finance unit, marketing.

Work Quality Employee Key Performance Indicators Performance Indicators Metrics Template PDF
The following slide highlights the work quality staff key performance Indicators metrics illustrating key headings which includes KPI, Description, Percentage, Score and result for measurement of Management goals, subjective appraisal, product defects, number of errors, net promoter score and peer rating Deliver an awe inspiring pitch with this creative Work Quality Employee Key Performance Indicators Performance Indicators Metrics Template PDF bundle. Topics like Products Manufactured, Visit Meeting, Conversion can be discussed with this completely editable template. It is available for immediate download depending on the needs and requirements of the user.

Business Process Performance Indicators Ppt Slide Design
This is a business process performance indicators ppt slide design. This is a four stage process. The stages in this process are focus, objective, measures, targets, invites, vision and strategy, area of focus, metrics, targets, objectives.

Our Key Metrics Ppt PowerPoint Presentation Portfolio
This is a our key metrics ppt powerpoint presentation portfolio. This is a five stage process. The stages in this process are cash flow, turnover, productivity, customer satisfaction, net income.

Infographic For Data Analysis Powerpoint Templates
This PowerPoint slide has been designed with process infographic. This PPT diagram may be used to display evaluation of business process. This diagram slide can be used to make impressive presentations.
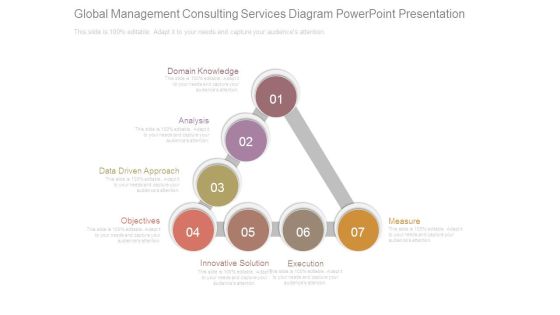
Global Management Consulting Services Diagram Powerpoint Presentation
This is a global management consulting services diagram powerpoint presentation. This is a seven stage process. The stages in this process are domain knowledge, analysis, data driven approach, objectives, innovative solution, execution, measure.
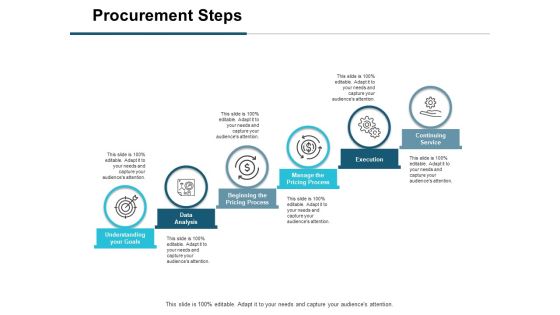
Procurement Steps Ppt PowerPoint Presentation Visual Aids Portfolio
This is a procurement steps ppt powerpoint presentation visual aids portfolio. This is a six stage process. The stages in this process are understanding your goals, data analysis, beginning pricing process, manage pricing process, execution.

Continuous Auditing Business Template Ppt Model
This is a continuous auditing business template ppt model. This is a six stage process. The stages in this process are risk management, work program execution, continuous auditing, audit plan management, data analysis, continuous monitoring.

Procurement Steps Ppt PowerPoint Presentation Slides Templates
This is a procurement steps ppt powerpoint presentation slides templates. This is a six stage process. The stages in this process are understanding your goals, data analysis, beginning the pricing process, manage the pricing process, execution, continuing service.

Continuous Risk Assessment Diagram Powerpoint Slides Templates
This is a continuous risk assessment diagram powerpoint slides templates. This is a eight stage process. The stages in this process are internal audit plan, project planning, data analysis, project reporting, stakeholder reporting, project execution, risk assessment, project reporting.
Procurement Steps Ppt PowerPoint Presentation Icon Objects
This is a procurement steps ppt powerpoint presentation icon objects. This is a six stage process. The stages in this process are understanding your goals, data analysis, beginning the pricing process, manage the pricing process, execution.

Procurement Steps Ppt PowerPoint Presentation Pictures Backgrounds
This is a procurement steps ppt powerpoint presentation pictures backgrounds. This is a six stage process. The stages in this process are data analysis, execution, continuing service, understanding your goals.

Key Customer Service Metrics Powerpoint Slide Deck
This is a key customer service metrics powerpoint slide deck. This is a five stage process. The stages in this process are process, management, arrow, marketing, strategy.

CSR Activities Company Reputation Management CSR Framework With Initiatives Aligned With Sdgs Ppt Layouts Inspiration PDF
This slide covers details about CSR framework that comprises of CSR initiatives that firm is planning to perform in next financial period and it depicts the alignment of each initiative with sustainable development goals SDGs. Deliver and pitch your topic in the best possible manner with this csr activities company reputation management csr framework with initiatives aligned with sdgs ppt layouts inspiration pdf. Use them to share invaluable insights on initiative, kpi, scope, sdg alignment, risk management and impress your audience. This template can be altered and modified as per your expectations. So, grab it now.
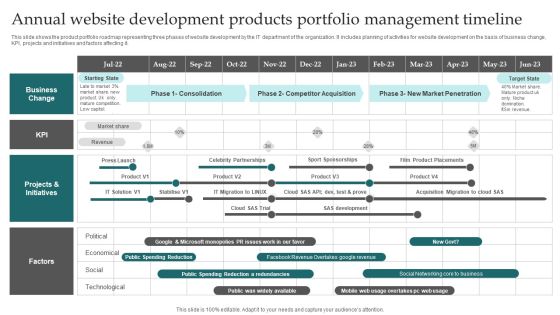
Annual Website Development Products Portfolio Management Timeline Inspiration PDF
This slide shows the product portfolio roadmap representing three phases of website development by the IT department of the organization. It includes planning of activities for website development on the basis of business change, KPI, projects and initiatives and factors affecting it. Showcasing this set of slides titled Annual Website Development Products Portfolio Management Timeline Inspiration PDF. The topics addressed in these templates are Business Change, Market Penetration, Competitor Acquisition. All the content presented in this PPT design is completely editable. Download it and make adjustments in color, background, font etc. as per your unique business setting.

Annual Strategic Annual Business Growth Plan Themes PDF
This slide showcase growth plan of organization in coming year with a focus of increasing sales revenue. It also includes purpose, key objectives, initiatives and key performance indicators KPI. Presenting Annual Strategic Annual Business Growth Plan Themes PDF to dispense important information. This template comprises three stages. It also presents valuable insights into the topics including Market Development, Process Improvement, People Development. This is a completely customizable PowerPoint theme that can be put to use immediately. So, download it and address the topic impactfully.

Comparative Assessment Of Big Information Management Frameworks Demonstration PDF
This slide shows comparative analysis of big data management frameworks. It provides information such as performance, intermediate storage, data transfer, query execution, fault tolerance, multiple job support, etc. Showcasing this set of slides titled Comparative Assessment Of Big Information Management Frameworks Demonstration PDF. The topics addressed in these templates are Intermediate Storage, Data Transfer, Query Execution. All the content presented in this PPT design is completely editable. Download it and make adjustments in color, background, font etc. as per your unique business setting.

Managers Scorecard Kpis For Startups Slides PDF
This slide mentions key performance indicators that are to be considered while formulating balanced scorecard for startups. It includes attraction, engagement, value and retention KPI. Persuade your audience using this Managers Scorecard Kpis For Startups Slides PDF. This PPT design covers four stages, thus making it a great tool to use. It also caters to a variety of topics including Value, Attraction, Retention. Download this PPT design now to present a convincing pitch that not only emphasizes the topic but also showcases your presentation skills.
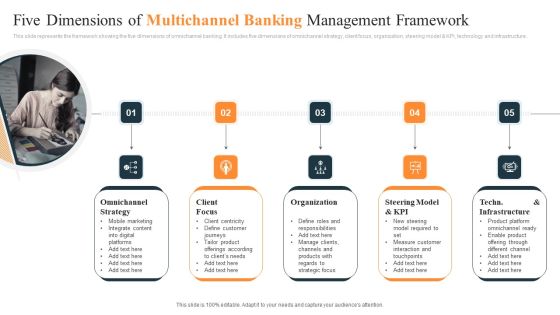
Five Dimensions Of Multichannel Banking Management Framework Ppt Outline Files PDF
This slide represents the framework showing the five dimensions of omnichannel banking. It includes five dimensions of omnichannel strategy, client focus, organization, steering model and KPI, technology and infrastructure. Persuade your audience using this Five Dimensions Of Multichannel Banking Management Framework Ppt Outline Files PDF. This PPT design covers five stages, thus making it a great tool to use. It also caters to a variety of topics including Omnichannel Strategy, Client Focus, Organization. Download this PPT design now to present a convincing pitch that not only emphasizes the topic but also showcases your presentation skills.
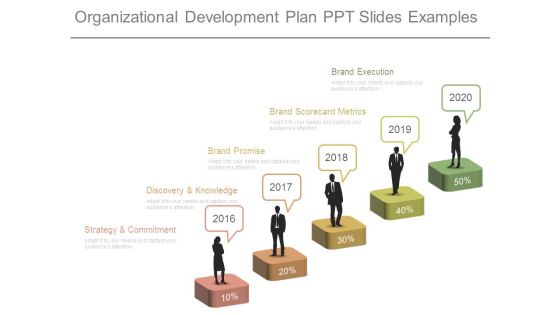
Organizational Development Plan Ppt Slides Examples
This is a organizational development plan ppt slides examples. This is a five stage process. The stages in this process are strategy and commitment, discovery and knowledge, brand promise, brand scorecard metrics, brand execution.

Communication Feedback Survey Forms After Consulting Doctor Formats PDF
This templates shows the results of after consulting. The purpose of his slide is to evaluate the communication flow between patient and doctor to receive valuable feedback major communication KPI. It includes such as does doctor listen patiently, give valuable feedback involve in decision making, etc. Showcasing this set of slides titled Communication Feedback Survey Forms After Consulting Doctor Formats PDF. The topics addressed in these templates are Problem Patiently, Explanation Prescription, Doctor Lacking. All the content presented in this PPT design is completely editable. Download it and make adjustments in color, background, font etc. as per your unique business setting.
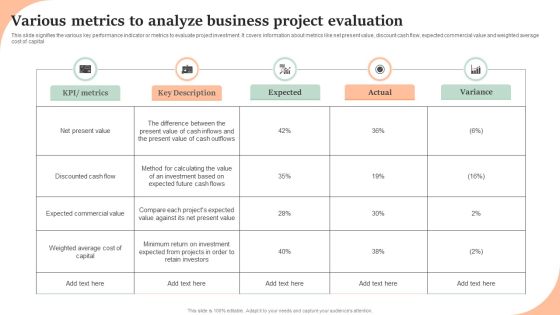
Various Metrics To Analyze Business Project Evaluation Inspiration PDF
This slide signifies the various key performance indicator or metrics to evaluate project investment. It covers information about metrics like net present value, discount cash flow, expected commercial value and weighted average cost of capital. Pitch your topic with ease and precision using this Various Metrics To Analyze Business Project Evaluation Inspiration PDF. This layout presents information on KPI, Metrics, Key Description, Expected, Actual, Variance. It is also available for immediate download and adjustment. So, changes can be made in the color, design, graphics or any other component to create a unique layout.

It Operation Management Sheet With Status Icons PDF
This slide covers IT operations monitoring report. The purpose of this is to give an overview of information technology operations performance tracking. It includes elements such as status, tasks, KPI, target value, actual value and difference Showcasing this set of slides titled It Operation Management Sheet With Status Icons PDF. The topics addressed in these templates are Target Value, Actual Value, Difference. All the content presented in this PPT design is completely editable. Download it and make adjustments in color, background, font etc. as per your unique business setting.

Kpis To Measure Supply Chain Stock Management System Effectiveness Introduction PDF
This slide presents various metrics to analyze effectiveness of supply chain inventory control system. It includes key components such as KPI, actual performance, benchmark performance and strategies to improve. Showcasing this set of slides titled Kpis To Measure Supply Chain Stock Management System Effectiveness Introduction PDF. The topics addressed in these templates are Actual, Benchmark, Strategies To Improve. All the content presented in this PPT design is completely editable. Download it and make adjustments in color, background, font etc. as per your unique business setting.
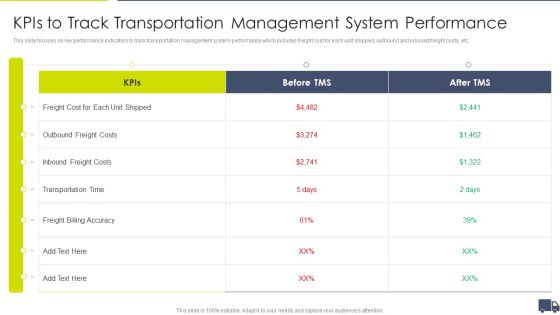
Enhancing Logistics Customer Service Kpis To Track Transportation Management Information PDF
This slide focuses on key performance indicators to track transportation management system performance which includes freight cost for each unit shipped, outbound and inbound freight costs, etc. Deliver and pitch your topic in the best possible manner with this Enhancing Logistics Customer Service Kpis To Track Transportation Management Information PDF. Use them to share invaluable insights on Freight Cost Each, Unit Shipped KPI, Outbound Freight Costs, Freight Billing Accuracy and impress your audience. This template can be altered and modified as per your expectations. So, grab it now.

Data Interpretations Market Analysis Templates For Business Plan PowerPoint
We present our data interpretations market analysis templates for business plan PowerPoint.Present our Circle Charts PowerPoint Templates because Our PowerPoint Templates and Slides come in all colours, shades and hues. They help highlight every nuance of your views. Use our Business PowerPoint Templates because Our PowerPoint Templates and Slides will let you Hit the right notes. Watch your audience start singing to your tune. Download our Shapes PowerPoint Templates because Our PowerPoint Templates and Slides will fulfill your every need. Use them and effectively satisfy the desires of your audience. Present our Signs PowerPoint Templates because Our PowerPoint Templates and Slides will provide you a launch platform. Give a lift off to your ideas and send them into orbit. Use our Metaphors-Visual Concepts PowerPoint Templates because You have a driving passion to excel in your field. Our PowerPoint Templates and Slides will prove ideal vehicles for your ideas.Use these PowerPoint slides for presentations relating to business, chart, circle, circular, diagram, economy, finance, framework, graph, isolated, percentage, pie chart, results, scheme, statistics, stats, strategy, success. The prominent colors used in the PowerPoint template are Blue, Green, Blue light.

 Home
Home