AI PPT Maker
Templates
PPT Bundles
Design Services
Business PPTs
Business Plan
Management
Strategy
Introduction PPT
Roadmap
Self Introduction
Timelines
Process
Marketing
Agenda
Technology
Medical
Startup Business Plan
Cyber Security
Dashboards
SWOT
Proposals
Education
Pitch Deck
Digital Marketing
KPIs
Project Management
Product Management
Artificial Intelligence
Target Market
Communication
Supply Chain
Google Slides
Research Services
 One Pagers
All Categories
-
Home
- Customer Favorites
- Executive Dashboard
Executive Dashboard
Icon For Target Market Assessment Survey Diagrams PDF
Persuade your audience using this Icon For Target Market Assessment Survey Diagrams PDF. This PPT design covers four stages, thus making it a great tool to use. It also caters to a variety of topics including Icon For Target Market, Assessment Survey. Download this PPT design now to present a convincing pitch that not only emphasizes the topic but also showcases your presentation skills.
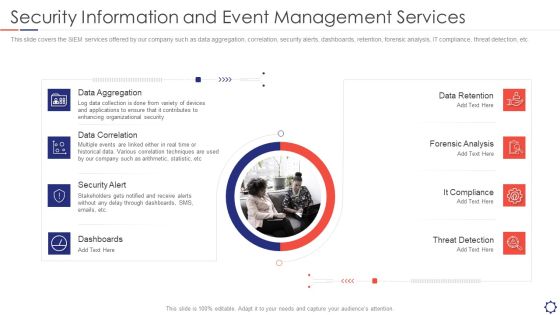
SIEM Security Information And Event Management Services Ppt Ideas Graphics Pictures PDF
This slide covers the SIEM services offered by our company such as data aggregation, correlation, security alerts, dashboards, retention, forensic analysis, IT compliance, threat detection, etc. This is a siem security information and event management services ppt ideas graphics pictures pdf template with various stages. Focus and dispense information on eight stages using this creative set, that comes with editable features. It contains large content boxes to add your information on topics like Data Aggregation, Data Correlation, Security Alert, Dashboards, Data Retention. You can also showcase facts, figures, and other relevant content using this PPT layout. Grab it now.
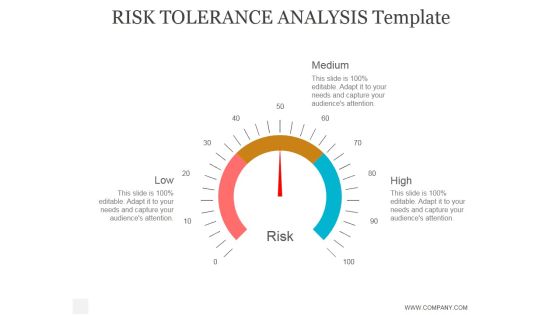
Risk Tolerance Analysis Template Ppt PowerPoint Presentation Example
This is a risk tolerance analysis template ppt powerpoint presentation example. This is a four stage process. The stages in this process are business, strategy, marketing, analysis, success, arrow.
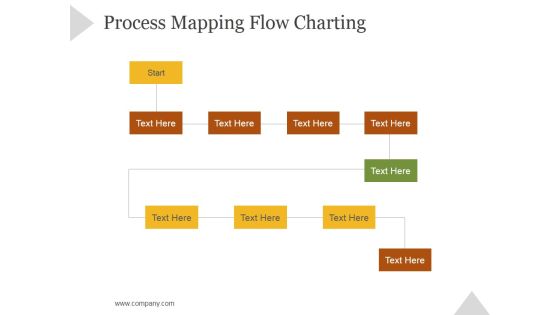
Process Mapping Flow Charting Ppt PowerPoint Presentation Slide Download
This is a process mapping flow charting ppt powerpoint presentation slide download. This is a ten stage process. The stages in this process are business, strategy, marketing, success, growth strategy, flowchart.
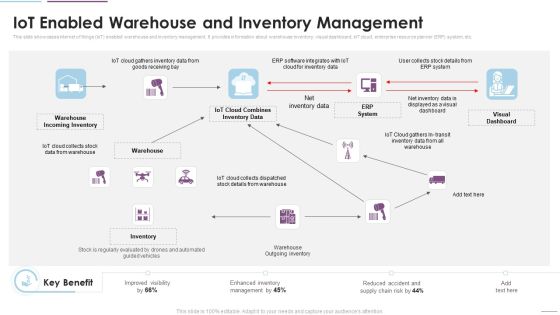
Supply Chain Management Iot Enabled Warehouse And Inventory Management Demonstration PDF
This slide showcases internet of things IoT enabled warehouse and inventory management. It provides information about warehouse inventory, visual dashboard, IoT cloud, enterprise resource planner ERP system, etc. Presenting Supply Chain Management Iot Enabled Warehouse And Inventory Management Demonstration PDF to provide visual cues and insights. Share and navigate important information on one stages that need your due attention. This template can be used to pitch topics like Warehouse Incoming Inventory, Visual Dashboard, ERP System. In addtion, this PPT design contains high resolution images, graphics, etc, that are easily editable and available for immediate download.
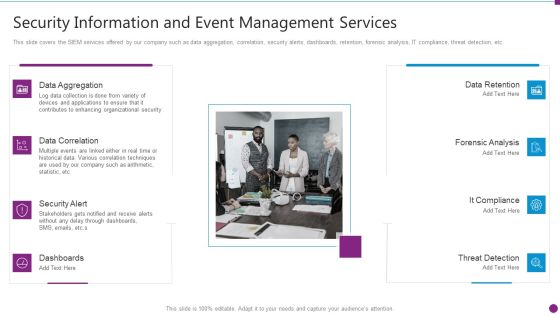
Security Information And Event Management Services Mockup PDF
This slide covers the SIEM services offered by our company such as data aggregation, correlation, security alerts, dashboards, retention, forensic analysis, IT compliance, threat detection, etc. Presenting security information and event management services mockup pdf to provide visual cues and insights. Share and navigate important information on eight stages that need your due attention. This template can be used to pitch topics like data aggregation, data correlation, security alert, dashboards. In addtion, this PPT design contains high resolution images, graphics, etc, that are easily editable and available for immediate download.

Solution Selling Template Powerpoint Slide Designs Download
This is a solution selling template powerpoint slide designs download. This is a five stage process. The stages in this process are export controls, report and refine, campaign invention, execution, goals and objective.

Business Diagram Alarm Clock With Pie Chart For Result Analysis PowerPoint Slide
This business slide displays alarm clock with pie chart. This diagram is a data visualization tool that gives you a simple way to present statistical information. This slide helps your audience examine and interpret the data you present.

Tools Used By Organizations For 5S Lean Production Strategies Ppt Icon Slides PDF
This slide defines the 5s lean strategic tools used by the organization. It includes information related dashboards, trend charts and checklist used to analyze the working conditions of an industry. Presenting Tools Used By Organizations For 5S Lean Production Strategies Ppt Icon Slides PDF to dispense important information. This template comprises four stages. It also presents valuable insights into the topics including Checklist, Trends Charts, Dashboards. This is a completely customizable PowerPoint theme that can be put to use immediately. So, download it and address the topic impactfully.

Campaign Report Ppt PowerPoint Presentation Show Graphic Tips
This is a campaign report ppt powerpoint presentation show graphic tips. This is a ten stage process. The stages in this process are email name, send date time, recipients, delivered, spam.
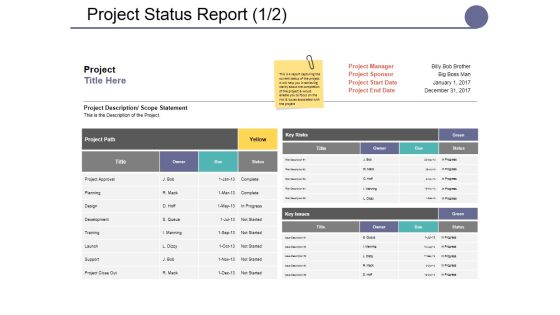
Project Status Report Ppt PowerPoint Presentation Slides Format Ideas
This is a project status report ppt powerpoint presentation slides format ideas. This is a six stage process. The stages in this process are deadlines, budget, requirements, overall status, next steps.

Project Conclusion Report Deadline Milestones Ppt PowerPoint Presentation Outline Guidelines
This is a project conclusion report deadline milestones ppt powerpoint presentation outline guidelines. This is a four stage process. The stages in this process are staff costs, material, travel expenses, advertising expenses, hardware.

Project Conclusion Report Deadline Milestones Ppt PowerPoint Presentation File Examples
This is a project conclusion report deadline milestones ppt powerpoint presentation file examples. This is a four stage process. The stages in this process are date, milestone, deviations, cause.

Kaizen Report Form Ppt PowerPoint Presentation Styles Samples
This is a kaizen report form ppt powerpoint presentation styles samples. This is a four stage process. The stages in this process are problem description, solution description, before, after, implementation date.

Components Of The Audit Plan Template Powerpoint Slide
This is a components of the audit plan template powerpoint slide. This is a six stage process. The stages in this process are risk assessment, internal audit plan, stakeholder reporting, project plan, project execution, project reporting.

Contract Lifecycle Example Diagram Presentation Deck
This is a contract lifecycle example diagram presentation deck. This is a eight stage process. The stages in this process are create, risk management, execute, reporting, quality, approve, incident reporting and analysis, exit.

Data Assimilation BI Applications Monitoring Ppt Icon Maker PDF
Presenting data assimilation bi applications monitoring ppt icon maker pdf to provide visual cues and insights. Share and navigate important information on nine stages that need your due attention. This template can be used to pitch topics like digital dashboards, business, monitoring, data warehouse, data mining. In addtion, this PPT design contains high resolution images, graphics, etc, that are easily editable and available for immediate download.
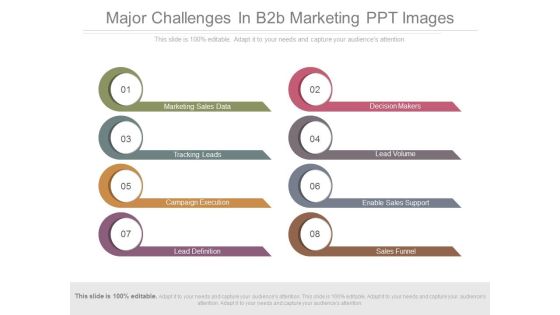
Major Challenges In B2b Marketing Ppt Images
This is a major challenges in b2b marketing ppt images. This is a eight stage process. The stages in this process are marketing sales data, decision makers, tracking leads, lead volume, campaign execution, enable sales support, lead definition, sales funnel.
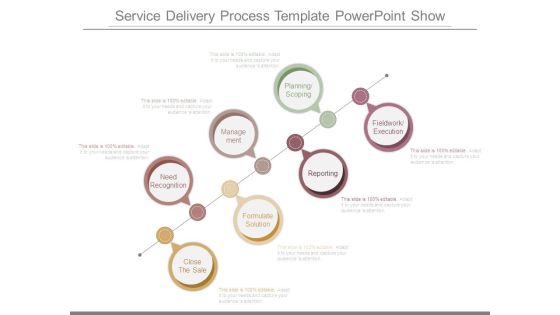
Service Delivery Process Template Powerpoint Show
This is a service delivery process template powerpoint show. This is a seven stage process. The stages in this process are need recognition, management, planning scoping, close the sale, formulate solution, reporting, fieldwork execution.
Business Diagram 3d Capsule With Multiple Icons For Business Data Flow PowerPoint Slide
This diagram has been designed with 3d graphic of capsule with multiple icons. This data driven PowerPoint slide can be used to give your presentations more effective look. It helps in clearly conveying your message to clients and audience.
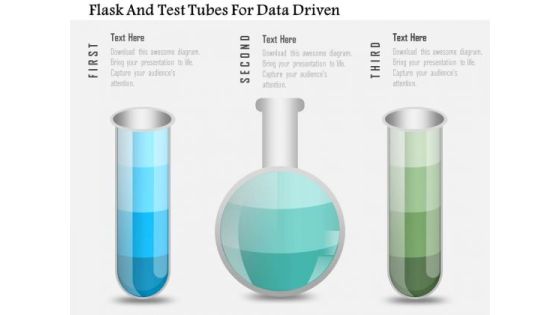
Business Diagram Flask And Test Tubes For Data Driven PowerPoint Slide
This data driven diagram has been designed with flask and test tubes. Download this diagram to give your presentations more effective look. It helps in clearly conveying your message to clients and audience.
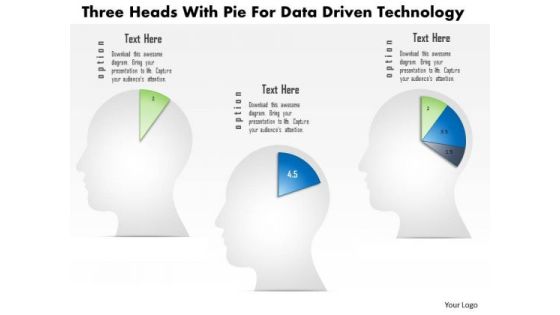
Business Diagram Three Heads With Pie For Data Driven Technology PowerPoint Slide
This business diagram displays three human faces with pie charts. This Power Point template has been designed to compare and present business data. You may use this diagram to impart professional appearance to your presentations.
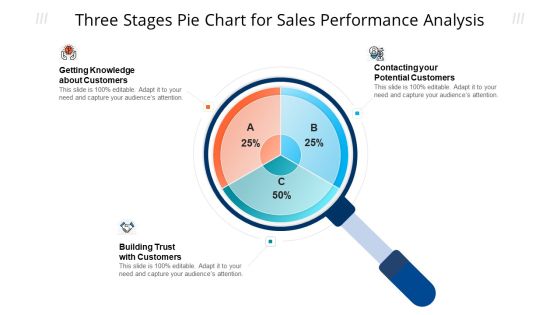
Three Stages Pie Chart For Sales Performance Analysis Ppt Model Tips PDF
Persuade your audience using this three stages pie chart for sales performance analysis ppt model tips pdf. This PPT design covers three stages, thus making it a great tool to use. It also caters to a variety of topics including potential customers, knowledge about customers, sales performance analysis. Download this PPT design now to present a convincing pitch that not only emphasizes the topic but also showcases your presentation skills.
Ingestion Icon For Stream Processing And Analysis Ppt PowerPoint Presentation Gallery Visual Aids PDF
Persuade your audience using this Ingestion Icon For Stream Processing And Analysis Ppt PowerPoint Presentation Gallery Visual Aids PDF. This PPT design covers three stages, thus making it a great tool to use. It also caters to a variety of topics including Ingestion Icon, Stream, Processing And Analysis. Download this PPT design now to present a convincing pitch that not only emphasizes the topic but also showcases your presentation skills.

Icon Of BI System To Enhance Processes For Statistical Analysis Ppt Ideas Elements PDF
Persuade your audience using this Icon Of BI System To Enhance Processes For Statistical Analysis Ppt Ideas Elements PDF. This PPT design covers four stages, thus making it a great tool to use. It also caters to a variety of topics including Icon, BI System, Enhance Processes, Statistical Analysis. Download this PPT design now to present a convincing pitch that not only emphasizes the topic but also showcases your presentation skills.

Website Analysis Icon For SEO Performance Improvement Ppt Gallery Professional PDF
Persuade your audience using this Website Analysis Icon For SEO Performance Improvement Ppt Gallery Professional PDF. This PPT design covers four stages, thus making it a great tool to use. It also caters to a variety of topics including Website Analysis, Icon, SEO Performance Improvement. Download this PPT design now to present a convincing pitch that not only emphasizes the topic but also showcases your presentation skills.

Data Structure IT Healthcare Specific Data Model Structure Brochure PDF
If you are looking for a format to display your unique thoughts, then the professionally designed Data Structure IT Healthcare Specific Data Model Structure Brochure PDF is the one for you. You can use it as a Google Slides template or a PowerPoint template. Incorporate impressive visuals, symbols, images, and other charts. Modify or reorganize the text boxes as you desire. Experiment with shade schemes and font pairings. Alter, share or cooperate with other people on your work. Download Data Structure IT Healthcare Specific Data Model Structure Brochure PDF and find out how to give a successful presentation. Present a perfect display to your team and make your presentation unforgettable.

Statistical Data Analysis Chart Of Collected Data Formats PDF
Presenting statistical data analysis chart of collected data formats pdf to dispense important information. This template comprises four stages. It also presents valuable insights into the topics including statistical data analysis chart of collected data. This is a completely customizable PowerPoint theme that can be put to use immediately. So, download it and address the topic impactfully.
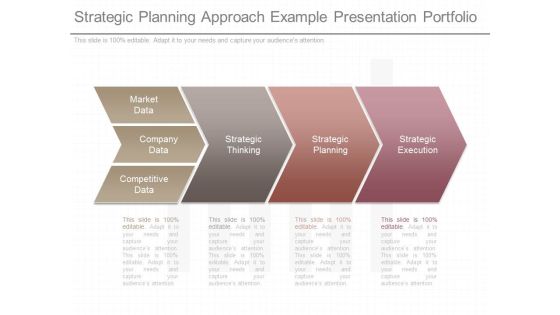
Strategic Planning Approach Example Presentation Portfolio
This is a strategic planning approach example presentation portfolio. This is a four stage process. The stages in this process are market data, company data, competitive data, strategic thinking, strategic planning, strategic execution.
Identify Target Market For Business Ppt PowerPoint Presentation Background Image
This is a identify target market for business ppt powerpoint presentation background image. This is a one stage process. The stages in this process are target audience, business, magnifier, research, marketing.

Work Breakdown Structure Ppt PowerPoint Presentation Portfolio Display
This is a work breakdown structure ppt powerpoint presentation portfolio display. This is a three stage process. The stages in this process are project name, prepared by, project closure report version control, department.
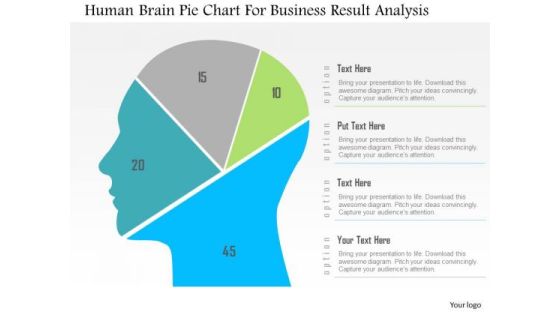
Business Diagram Human Brain Pie Chart For Business Result Analysis PowerPoint Slide
This diagram displays human face graphic divided into sections. This section can be used for data display. Use this diagram to build professional presentations for your viewers.

Business Transformation Template Ppt PowerPoint Presentation Layouts Styles
This is a business transformation template ppt powerpoint presentation layouts styles. This is a three stage process. The stages in this process are reduce complexity, shared services, data management, sales marketing, improve execution.

Data And Analysis Ppt PowerPoint Presentation Portfolio Layouts
This is a data and analysis ppt powerpoint presentation portfolio layouts. This is a six stage process. The stages in this process are root cause analysis, opportunity analysis, timeline analysis, force field analysis, fmea analysis.

Comprehensive Analysis Of Different Data Lineage Classification Components Of Data Lineage Technology Portrait PDF
This slide represents the components of data lineage technology, including IT systems, data elements, business processes, data checks and controls, information and reports. The IT systems include databases, customer relationship management, Enterprise resource planning, and dashboards. Present like a pro with Comprehensive Analysis Of Different Data Lineage Classification Components Of Data Lineage Technology Portrait PDF Create beautiful presentations together with your team, using our easy to use presentation slides. Share your ideas in real time and make changes on the fly by downloading our templates. So whether you are in the office, on the go, or in a remote location, you can stay in sync with your team and present your ideas with confidence. With Slidegeeks presentation got a whole lot easier. Grab these presentations today.

Investment Management Diagram Powerpoint Templates
This is a investment management diagram powerpoint templates. This is a seven stage process. The stages in this process are understanding, execution, risk control, performance reporting, meeting, analysis, assessment.

Business Process Management Lifecycle Diagram Powerpoint Slides Deck
This is a business process management lifecycle diagram powerpoint slides deck. This is a seven stage process. The stages in this process are business process management lifecycle, design, reporting and analytics, technology, monitoring, execution, optimization, quality monitoring.

Break Even Analysis Ppt PowerPoint Presentation Portfolio Clipart
This is a break even analysis ppt powerpoint presentation portfolio clipart. This is a five stage process. The stages in this process are fixed cost, variable cost, sales revenue, profit, key comments on the table, units of output.

Break Even Analysis Ppt PowerPoint Presentation Styles Template
This is a break even analysis ppt powerpoint presentation styles template. This is a five stage process. The stages in this process are fixed cost, variable cost, key comments on the table, units of output, business.

Business Diagram 3d Colorful Pie Graph With Magnifier Data Search PowerPoint Slide
This business slide displays 3d colorful pie graph with magnifier. This diagram is a data visualization tool that gives you a simple way to present statistical information. This slide helps your audience examine and interpret the data you present.

Business Diagram Data Driven Pie Chart Inside The Magnifier PowerPoint Slide
This business slide displays 3d colorful pie graph with magnifier. This diagram is a data visualization tool that gives you a simple way to present statistical information. This slide helps your audience examine and interpret the data you present.

User Big Data Input Analytics Designs PDF
Showcasing this set of slides titled user big data input analytics designs pdf. The topics addressed in these templates are analytical data store, data packet processing, stream processing. All the content presented in this PPT design is completely editable. Download it and make adjustments in color, background, font etc. as per your unique business setting.

Process Methodology Five Steps Ppt PowerPoint Presentation Layouts Grid
This is a process methodology five steps ppt powerpoint presentation layouts grid. This is a five stage process. The stages in this process are prepare, design, execute, manage monitor and report, discover, classify and audit.

Strong Service Culture Diagram Powerpoint Slides
This is a strong service culture diagram powerpoint slides. This is a six stage process. The stages in this process are employees, government, systems and processes, analyzing, executing, reporting.

Project Management And Accounting Example Of Ppt
This is a project management and accounting example of Ppt. This is a six stage process. The stages in this process are analyze and report, business development, service management, project execution, labor management, project management.
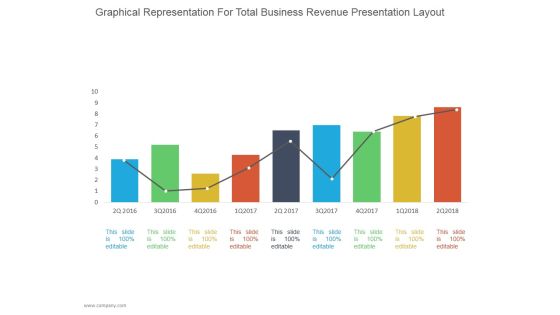
Graphical Representation For Total Business Revenue Ppt PowerPoint Presentation Diagrams
This is a graphical representation for total business revenue ppt powerpoint presentation diagrams. This is a nine stage process. The stages in this process are business, strategy, line chart, bar graph, marketing, management.
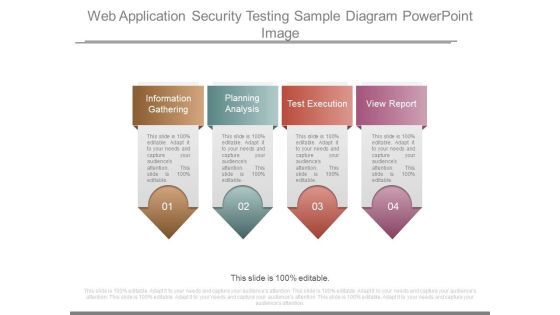
Web Application Security Testing Sample Diagram Powerpoint Image
This is a web application security testing sample diagram powerpoint image. This is a four stage process. The stages in this process are information gathering, planning analysis, test execution, view report.

Competitive Analysis Matrix Ppt PowerPoint Presentation Model Deck
This is a competitive analysis matrix ppt powerpoint presentation model deck. This is a six stage process. The stages in this process are new organization, table, business, marketing, strategy.

Business And Financial Analysis Ppt PowerPoint Presentation Layouts Portrait
This is a business and financial analysis ppt powerpoint presentation layouts portrait. This is a three stage process. The stages in this process are equipment, land cost, interior cost, employee cost, marketing cost.

Balanced Scorecard Best Practices Diagram Example Of Ppt Presentation
This is a balanced scorecard best practices diagram example of ppt presentation. This is a five stage process. The stages in this process are better strategic alignment, better strategic planning, improved communication and execution, better management information, improved performance reporting.

Automating Process Diagram Example Of Ppt
This is a automating process diagram example of ppt. This is a five stage process. The stages in this process are manage and control, capture data, define scope of automation, test tools selection, test execution.

Product Wise Pipeline Analysis Ppt PowerPoint Presentation Professional Files
This is a our goal ppt powerpoint presentation slides files. This is a four stage process. The stages in this process are business, marketing, strategy, planning, icons.

Sample For Strategic Plan Review Ppt Slides
This is a sample for strategic plan review ppt slides. This is a five stage process. The stages in this process are predictions, experiments, data collection, pattern recognition, effective execution.

Business Tactical And Strategic Analysis For Profitability Growth Icon Pictures PDF
Presenting Business Tactical And Strategic Analysis For Profitability Growth Icon Pictures PDF to dispense important information. This template comprises three stages. It also presents valuable insights into the topics including Business Tactical, Analysis, Profitability Growth, Icon. This is a completely customizable PowerPoint theme that can be put to use immediately. So, download it and address the topic impactfully.

COVID Impact Analysis On Economy Inflation Rate Ppt Portfolio Slide PDF
Presenting COVID Impact Analysis On Economy Inflation Rate Ppt Portfolio Slide PDF to dispense important information. This template comprises one stages. It also presents valuable insights into the topics including COVID Impact Analysis, Economy Inflation Rate. This is a completely customizable PowerPoint theme that can be put to use immediately. So, download it and address the topic impactfully.

Customer Oriented Sample Ppt PowerPoint Presentation Graphics
This is a customer oriented sample ppt powerpoint presentation graphics. This is a two stage process. The stages in this process are business, marketing, big data, strategy, success, management.

Big Data Analytics Procedure For Management Accounting Formats PDF
This slide illustrate big data analysis process for management accounting to generate financial reports for decision making. It includes elements such as cost accounting balance scorecards, performance measurement etc. Showcasing this set of slides titled Big Data Analytics Procedure For Management Accounting Formats PDF. The topics addressed in these templates are Accounting, Internal Data, Social Media. All the content presented in this PPT design is completely editable. Download it and make adjustments in color, background, font etc. as per your unique business setting.

Mobile Relationship Management Diagram Presentation Powerpoint Templates
This is a mobile relationship management diagram presentation powerpoint templates. This is a four stage process. The stages in this process are strategy, execution, data, transaction, engagement, awareness, loyalty.

Data Assimilation Your Title Here Metrics Ppt Icon Skills PDF
This is a data assimilation your title here metrics ppt icon skills pdf template with various stages. Focus and dispense information on two stages using this creative set, that comes with editable features. It contains large content boxes to add your information on topics like kpi metrics, kpi dashboards. You can also showcase facts, figures, and other relevant content using this PPT layout. Grab it now.

Comprehensive Analysis Of Different Data Lineage Classification Typical Use Cases Of Data Lineage Themes PDF
This slide outlines the typical use cases of data lineage that include performing root cause analysis, generating reports, deprecating columns, and setting data retention policies. Data lineage enables a broad range of information use applications for IT departments and various stakeholder groups. Make sure to capture your audiences attention in your business displays with our gratis customizable Comprehensive Analysis Of Different Data Lineage Classification Typical Use Cases Of Data Lineage Themes PDF. These are great for business strategies, office conferences, capital raising or task suggestions. If you desire to acquire more customers for your tech business and ensure they stay satisfied, create your own sales presentation with these plain slides.
