AI PPT Maker
Templates
PPT Bundles
Design Services
Business PPTs
Business Plan
Management
Strategy
Introduction PPT
Roadmap
Self Introduction
Timelines
Process
Marketing
Agenda
Technology
Medical
Startup Business Plan
Cyber Security
Dashboards
SWOT
Proposals
Education
Pitch Deck
Digital Marketing
KPIs
Project Management
Product Management
Artificial Intelligence
Target Market
Communication
Supply Chain
Google Slides
Research Services
 One Pagers
All Categories
-
Home
- Customer Favorites
- Executive Dashboard
Executive Dashboard
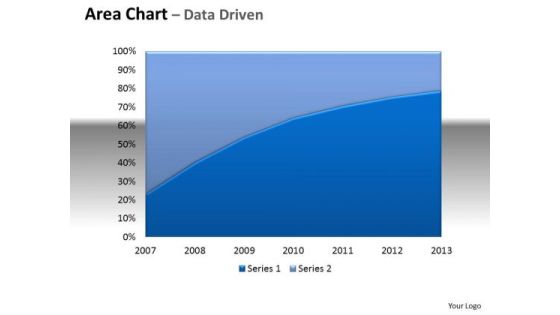
Financial Data Analysis Area Chart With Plotted Line Center PowerPoint Templates
Be The Doer With Our financial data analysis area chart with plotted line center Powerpoint Templates . Put Your Thoughts Into Practice.
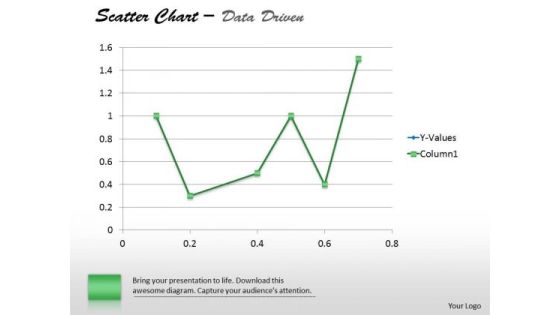
Financial Data Analysis Driven Demonstrate Statistics With Scatter Chart PowerPoint Slides Templates
Establish The Dominance Of Your Ideas. Our financial data analysis driven demonstrate statistics with scatter chart powerpoint slides Templates Will Put Them On Top.
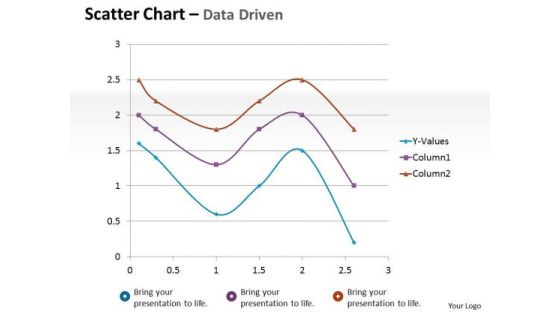
Financial Data Analysis Driven Scatter Chart Mathematical Diagram PowerPoint Slides Templates
Dominate Proceedings With Your Ideas. Our financial data analysis driven scatter chart mathematical diagram powerpoint slides Templates Will Empower Your Thoughts.
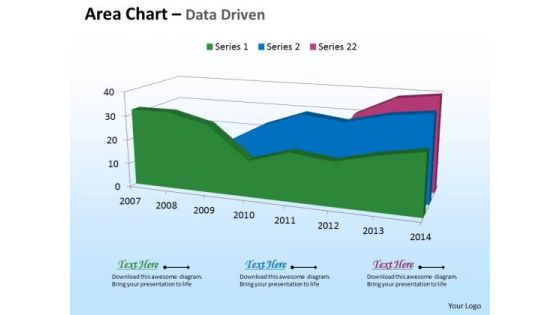
Microsoft Excel Data Analysis 3d Area Chart For Time Based PowerPoint Templates
Deliver The Right Dose With Our microsoft excel data analysis 3d area chart for time based Powerpoint Templates . Your Ideas Will Get The Correct Illumination.
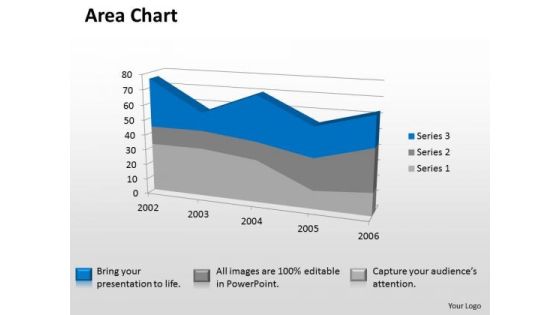
Microsoft Excel Data Analysis 3d Area Chart Showimg Change In Values PowerPoint Templates
Our microsoft excel data analysis 3d area chart showimg change in values Powerpoint Templates Deliver At Your Doorstep. Let Them In For A Wonderful Experience.
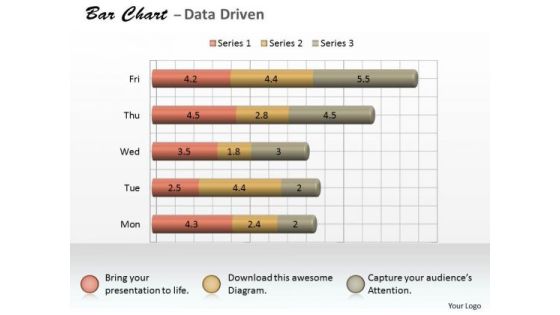
Microsoft Excel Data Analysis 3d Bar Chart As Research Tool PowerPoint Templates
Knock On The Door To Success With Our microsoft excel data analysis 3d bar chart as research tool Powerpoint Templates . Be Assured Of Gaining Entry.
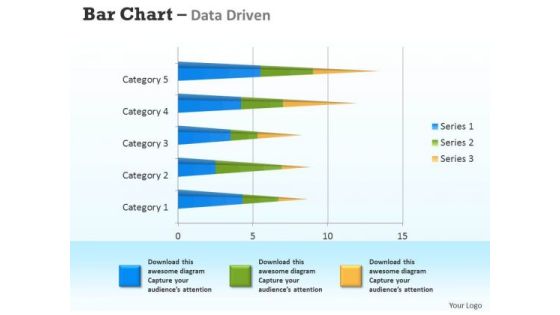
Microsoft Excel Data Analysis 3d Bar Chart For Analyzing Survey PowerPoint Templates
Connect The Dots With Our microsoft excel data analysis 3d bar chart for analyzing survey Powerpoint Templates . Watch The Whole Picture Clearly Emerge.

Microsoft Excel Data Analysis 3d Change In Business Process Chart PowerPoint Templates
Double Your Chances With Our microsoft excel data analysis 3d change in business process chart Powerpoint Templates . The Value Of Your Thoughts Will Increase Two-Fold.

Microsoft Excel Data Analysis 3d Chart For Business Observation PowerPoint Templates
Double Up Our microsoft excel data analysis 3d chart for business observation Powerpoint Templates With Your Thoughts. They Will Make An Awesome Pair.
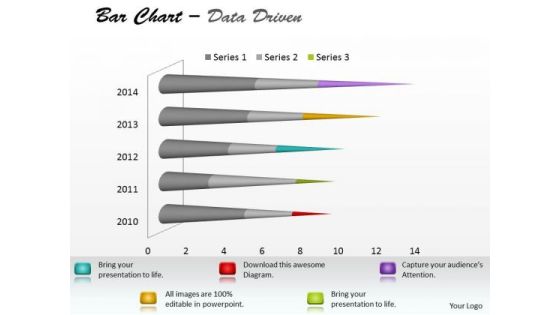
Microsoft Excel Data Analysis Bar Chart To Communicate Information PowerPoint Templates
With Our microsoft excel data analysis bar chart to communicate information Powerpoint Templates You Will Be Doubly Sure. They Possess That Stamp Of Authority.

Microsoft Excel Data Analysis Bar Chart To Compare Quantities PowerPoint Templates
Our microsoft excel data analysis bar chart to compare quantities Powerpoint Templates Leave No One In Doubt. Provide A Certainty To Your Views.
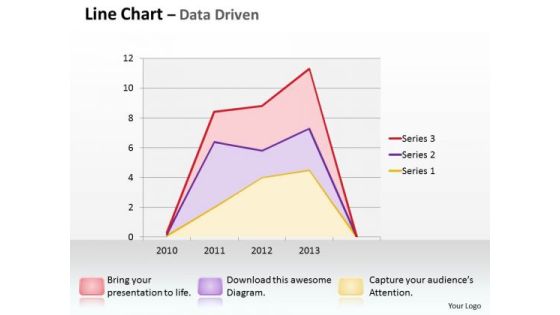
Multivariate Data Analysis Driven Line Chart Shows Revenue Trends PowerPoint Slides Templates
Good Camaraderie Is A Key To Teamwork. Our multivariate data analysis driven line chart shows revenue trends powerpoint slides Templates Can Be A Cementing Force.
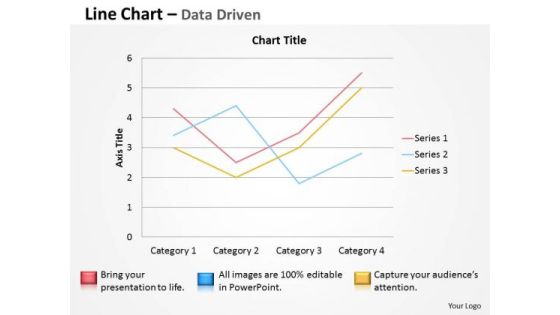
Multivariate Data Analysis Driven Line Chart To Demonstrate PowerPoint Slides Templates
Brace Yourself, Arm Your Thoughts. Prepare For The Hustle With Our multivariate data analysis driven line chart to demonstrate powerpoint slides Templates .
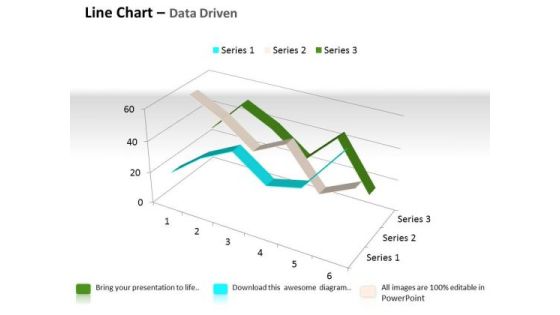
Quantitative Data Analysis 3d Line Chart For Comparison Of PowerPoint Templates
Touch Base With Our quantitative data analysis 3d line chart for comparison of Powerpoint Templates . Review Your Growth With Your Audience.

Quantitative Data Analysis 3d Pie Chart For Business Process PowerPoint Templates
Put Them On The Same Page With Our quantitative data analysis 3d pie chart for business process Powerpoint Templates . Your Team Will Sing From The Same Sheet.
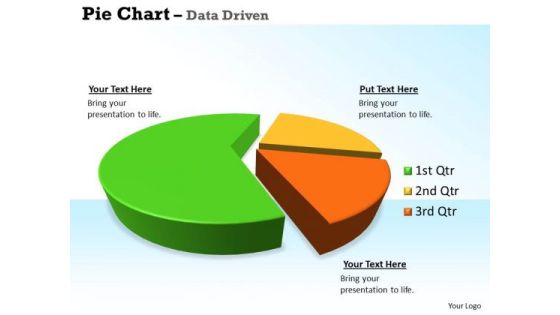
Quantitative Data Analysis 3d Pie Chart For Business Statistics PowerPoint Templates
Our quantitative data analysis 3d pie chart for business statistics Powerpoint Templates Allow You To Do It With Ease. Just Like Picking The Low Hanging Fruit.

Quantitative Data Analysis Driven Economic Status Line Chart PowerPoint Slides Templates
Be The Dramatist With Our quantitative data analysis driven economic status line chart powerpoint slides Templates . Script Out The Play Of Words.

Quantitative Data Analysis Driven Economic With Column Chart PowerPoint Slides Templates
Add Some Dramatization To Your Thoughts. Our quantitative data analysis driven economic with column chart powerpoint slides Templates Make Useful Props.

5 Stages Of Circular Data Flow Diagram Constructing Business Plan PowerPoint Slides
We present our 5 stages of circular data flow diagram constructing business plan PowerPoint Slides.Present our Circle Charts PowerPoint Templates because Our PowerPoint Templates and Slides are topically designed to provide an attractive backdrop to any subject. Use our Arrows PowerPoint Templates because Our PowerPoint Templates and Slides will let you Illuminate the road ahead to Pinpoint the important landmarks along the way. Present our Signs PowerPoint Templates because Your ideas provide food for thought. Our PowerPoint Templates and Slides will help you create a dish to tickle the most discerning palate. Download our Shapes PowerPoint Templates because Our PowerPoint Templates and Slides are topically designed to provide an attractive backdrop to any subject. Download and present our Process and Flows PowerPoint Templates because Our PowerPoint Templates and Slides will weave a web of your great ideas. They are gauranteed to attract even the most critical of your colleagues.Use these PowerPoint slides for presentations relating to process, chart, circular, arrow, diagram, organization, model, blank, sequence, numbers, business, sequential, concept, template, abstract, management, mba, cycle, circulation, illustration, icon, six, strategy, executive, design, empty, procedure, 6, conceptual, resource. The prominent colors used in the PowerPoint template are Yellow, Gray, Black.

5 Stages Of Circular Data Flow Diagram Business Plans PowerPoint Slides
We present our 5 stages of circular data flow diagram business plans PowerPoint Slides.Download our Circle Charts PowerPoint Templates because Our PowerPoint Templates and Slides are created by a hardworking bunch of busybees. Always flitting around with solutions gauranteed to please. Download and present our Arrows PowerPoint Templates because Our PowerPoint Templates and Slides are conceived by a dedicated team. Use them and give form to your wondrous ideas. Present our Signs PowerPoint Templates because Our PowerPoint Templates and Slides will let Your superior ideas hit the target always and everytime. Download our Shapes PowerPoint Templates because It will Strengthen your hand with your thoughts. They have all the aces you need to win the day. Download and present our Process and Flows PowerPoint Templates because you should Whip up a frenzy with our PowerPoint Templates and Slides. They will fuel the excitement of your team.Use these PowerPoint slides for presentations relating to process, chart, circular, arrow, diagram, organization, model, blank, sequence, numbers, business, sequential, concept, template, abstract, management, mba, cycle, circulation, illustration, icon, six, strategy, executive, design, empty, procedure, 6, conceptual, resource. The prominent colors used in the PowerPoint template are Blue, Gray, Black.

5 Stages Of Circular Data Flow Diagram Ppt Business Plan Guidelines PowerPoint Templates
We present our 5 stages of circular data flow diagram ppt business plan guidelines PowerPoint templates.Download and present our Circle Charts PowerPoint Templates because Our PowerPoint Templates and Slides are endowed to endure. Ideas conveyed through them will pass the test of time. Use our Arrows PowerPoint Templates because Our PowerPoint Templates and Slides will let your ideas bloom. Create a bed of roses for your audience. Download our Signs PowerPoint Templates because Our PowerPoint Templates and Slides provide you with a vast range of viable options. Select the appropriate ones and just fill in your text. Download and present our Shapes PowerPoint Templates because Your ideas provide food for thought. Our PowerPoint Templates and Slides will help you create a dish to tickle the most discerning palate. Download our Process and Flows PowerPoint Templates because Our PowerPoint Templates and Slides will let you Hit the right notes. Watch your audience start singing to your tune.Use these PowerPoint slides for presentations relating to process, chart, circular, arrow, diagram, organization, model, blank, sequence, numbers, business, sequential, concept, template, abstract, management, mba, cycle, circulation, illustration, icon, six, strategy, executive, design, empty, procedure, 6, conceptual, resource. The prominent colors used in the PowerPoint template are Red, Gray, Black.

5 Stages Of Circular Data Flow Diagram Ppt Business Plan PowerPoint Templates
We present our 5 stages of circular data flow diagram ppt business plan PowerPoint templates.Use our Circle Charts PowerPoint Templates because You can Channelise the thoughts of your team with our PowerPoint Templates and Slides. Urge them to focus on the goals you have set. Download our Arrows PowerPoint Templates because You are working at that stage with an air of royalty. Let our PowerPoint Templates and Slides be the jewels in your crown. Present our Signs PowerPoint Templates because Our PowerPoint Templates and Slides will let you Leave a lasting impression to your audiences. They possess an inherent longstanding recall factor. Download our Shapes PowerPoint Templates because Our PowerPoint Templates and Slides will steer your racing mind. Hit the right buttons and spur on your audience. Present our Process and Flows PowerPoint Templates because Our PowerPoint Templates and Slides have the Brilliant backdrops. Guaranteed to illuminate the minds of your audience.Use these PowerPoint slides for presentations relating to process, chart, circular, arrow, diagram, organization, model, blank, sequence, numbers, business, sequential, concept, template, abstract, management, mba, cycle, circulation, illustration, icon, six, strategy, executive, design, empty, procedure, 6, conceptual, resource. The prominent colors used in the PowerPoint template are Green, Gray, Black.

5 Stages Of Circular Data Flow Diagram Steps To Writing Business Plan PowerPoint Templates
We present our 5 stages of circular data flow diagram steps to writing business plan PowerPoint templates.Present our Circle Charts PowerPoint Templates because Our PowerPoint Templates and Slides will bullet point your ideas. See them fall into place one by one. Present our Arrows PowerPoint Templates because Our PowerPoint Templates and Slides will let you Hit the target. Go the full distance with ease and elan. Download and present our Signs PowerPoint Templates because Our PowerPoint Templates and Slides provide you with a vast range of viable options. Select the appropriate ones and just fill in your text. Download our Shapes PowerPoint Templates because You are well armed with penetrative ideas. Our PowerPoint Templates and Slides will provide the gunpowder you need. Download our Process and Flows PowerPoint Templates because you should once Tap the ingenuity of our PowerPoint Templates and Slides. They are programmed to succeed.Use these PowerPoint slides for presentations relating to process, chart, circular, arrow, diagram, organization, model, blank, sequence, numbers, business, sequential, concept, template, abstract, management, mba, cycle, circulation, illustration, icon, six, strategy, executive, design, empty, procedure, 6, conceptual, resource. The prominent colors used in the PowerPoint template are blue, Gray, Black.

Big Data Partnership Challenges Analysis Ppt Design
This is a big data partnership challenges analysis ppt design. This is a four stage process. The stages in this process are academia and scientific communities, national statically offers, big data providers data sources, research institutes and technology providers.

Data Quality Auditing And Threats Reporting Process Ppt Icon Picture PDF
This slide covers auditing process of data quality and reporting risk detected. It includes framework depicting checkpoints needed to audit data quality for data warehouse and business intelligence projects. Presenting Data Quality Auditing And Threats Reporting Process Ppt Icon Picture PDF to dispense important information. This template comprises one stages. It also presents valuable insights into the topics including External Data, Customer Data, Legacy Data. This is a completely customizable PowerPoint theme that can be put to use immediately. So, download it and address the topic impactfully.

Data Analytics Ppt PowerPoint Presentation Graphics
This is a data analytics ppt powerpoint presentation graphics. This is a five stage process. The stages in this process are data analysis, business, marketing, success, graph.

Activities For Digital Marketing Example Presentation Images
This is a activities for digital marketing example presentation images. This is a six stage process. The stages in this process are digital marketing, real the dashboard, action, strategy and planning, web presence, publication.
External Analysis Labour Market Forecasts Ppt PowerPoint Presentation Icon Guidelines
This is a external analysis labour market forecasts ppt powerpoint presentation icon guidelines. This is a seven stage process. The stages in this process are labour market characteristic, tables, data, analysis, planning.

Data Analysis On Excel 3d Chart Shows Interrelated Sets Of PowerPoint Templates
Put Them On The Same Page With Our data analysis on excel 3d chart shows interrelated sets of Powerpoint Templates . Your Team Will Sing From The Same Sheet.

Data Analytics Management Complexity Of Managing Data Quality Summary PDF
This slide depicts another big data challenge that is the complexity of managing data quality due to different data formats and sources of information.Deliver an awe inspiring pitch with this creative Data Analytics Management Complexity Of Managing Data Quality Summary PDF bundle. Topics like Received In Multiple, Accurate Reliable, Information Duplicate can be discussed with this completely editable template. It is available for immediate download depending on the needs and requirements of the user.

Enterprise Solutions And Tools For Project Monitoring Ppt Model Examples PDF
This slide enterprise solutions and tools for project controls. It provides information about user dashboards, time-phasing, bar charts and graph, collaboration and confidentiality. Presenting Enterprise Solutions And Tools For Project Monitoring Ppt Model Examples PDF to dispense important information. This template comprises three stages. It also presents valuable insights into the topics including User Dashboards, Time Phasing, Collaboration. This is a completely customizable PowerPoint theme that can be put to use immediately. So, download it and address the topic impactfully.

Data Analytics Ppt PowerPoint Presentation Themes
This is a data analytics ppt powerpoint presentation themes. This is a five stage process. The stages in this process are business, marketing, presentation, data analyst, management.

Vendor Data Profile For Data Analytics Software Business Analysis Modification Toolkit Topics PDF
This is a Vendor Data Profile For Data Analytics Software Business Analysis Modification Toolkit Topics PDF template with various stages. Focus and dispense information on four stages using this creative set, that comes with editable features. It contains large content boxes to add your information on topics like Predictive Applications, Reporting Features, Security Features. You can also showcase facts, figures, and other relevant content using this PPT layout. Grab it now.

Campaign Report Ppt PowerPoint Presentation Slides Professional
This is a campaign report ppt powerpoint presentation slides professional. This is a five stage process. The stages in this process are email name, send date time, recipients, delivered, spam, opt out, open, click, transactions, revenue.
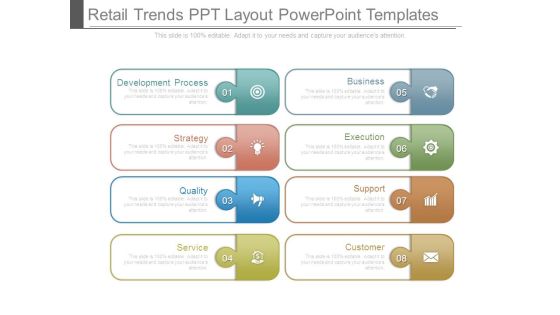
Retail Trends Ppt Layout Powerpoint Templates
This is a retail trends ppt layout powerpoint templates. This is a eight stage process. The stages in this process are development process, strategy, quality, service, business, execution, support, customer.

ROI Calculation Ppt PowerPoint Presentation Complete Deck With Slides
This is a roi calculation ppt powerpoint presentation complete deck with slides. This is a one stage process. The stages in this process are business, planning, strategy, marketing, management.

Project Conclusion Report Deadline Milestones Ppt PowerPoint Presentation Inspiration
This is a project conclusion report deadline milestones ppt powerpoint presentation inspiration. This is a four stage process. The stages in this process are cost, planning, table, project report, data management.
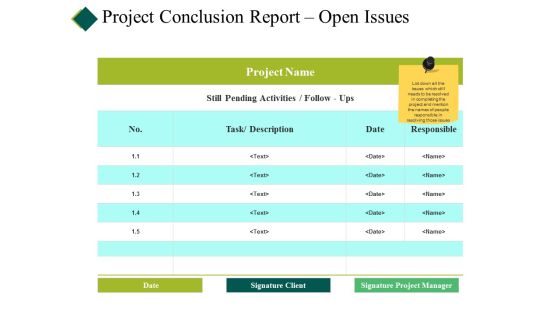
Project Conclusion Report Open Issues Ppt PowerPoint Presentation Show Summary
This is a project conclusion report open issues ppt powerpoint presentation show summary. This is a four stage process. The stages in this process are cost, planning, table, project report, data management.
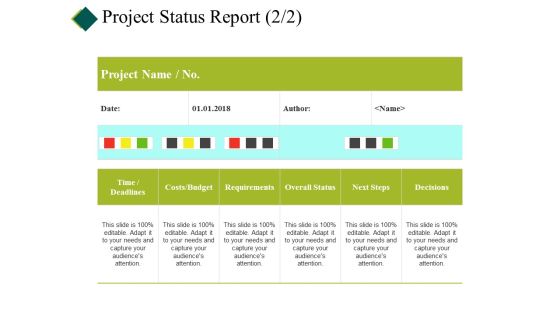
Project Status Report Template Ppt PowerPoint Presentation Infographics Ideas
This is a project status report template ppt powerpoint presentation infographics ideas. This is a five stage process. The stages in this process are cost, planning, table, project report, data management.
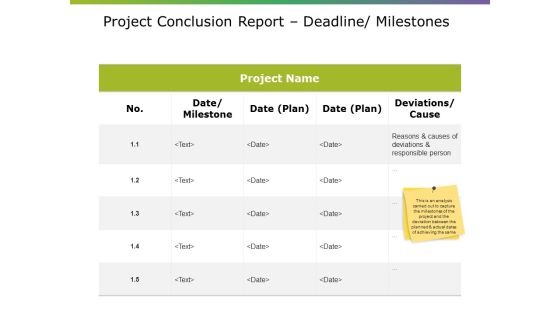
Project Conclusion Report Deadline Milestones Ppt PowerPoint Presentation Pictures Layouts
This is a project conclusion report deadline milestones ppt powerpoint presentation pictures layouts. This is a five stage process. The stages in this process are project name, table, cost, data, management.
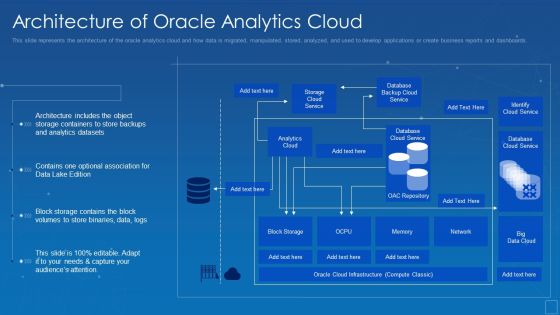
Oracle Cloud Data Analytics Administration IT Architecture Of Oracle Analytics Cloud Microsoft PDF
This slide represents the architecture of the oracle analytics cloud and how data is migrated, manipulated, stored, analyzed, and used to develop applications or create business reports and dashboards. Deliver an awe inspiring pitch with this creative oracle cloud data analytics administration it architecture of oracle analytics cloud microsoft pdf bundle. Topics like datasets, analytics, architecture, containers, association, optional can be discussed with this completely editable template. It is available for immediate download depending on the needs and requirements of the user.

Successful Business Men Leader Showing PowerPoint Theme Growth Factors Slides
We present our successful business men leader showing powerpoint theme growth factors Slides.Use our People PowerPoint Templates because It can Bubble and burst with your ideas. Use our Business PowerPoint Templates because You can Be the puppeteer with our PowerPoint Templates and Slides as your strings. Lead your team through the steps of your script. Download and present our Finance PowerPoint Templates because Our PowerPoint Templates and Slides are effectively colour coded to prioritise your plans They automatically highlight the sequence of events you desire. Download and present our Marketing PowerPoint Templates because It can Bubble and burst with your ideas. Present our Signs PowerPoint Templates because Our PowerPoint Templates and Slides are topically designed to provide an attractive backdrop to any subject.Use these PowerPoint slides for presentations relating to chart, growth, market, binder, leader, isolated, human, sales, file, document, economy, white, corporate, business, sign, line, adult, success, growing, male, graphic, finance, pen, report, people, black, close-up, suit, graph, illustration, object, paperwork, holding, executive, professional, showing, paper, organization, progress, information, background, work, manager, office, man, financial, hand, businessman. The prominent colors used in the PowerPoint template are Red, Green, Black.

Businessman Preparing Statistical Data Report Of Financial Data Brochure PDF
Presenting businessman preparing statistical data report of financial data brochure pdf to dispense important information. This template comprises four stages. It also presents valuable insights into the topics including businessman preparing statistical data report of financial data. This is a completely customizable PowerPoint theme that can be put to use immediately. So, download it and address the topic impactfully.
Data Computation And Management Analysis Report Icon Mockup PDF
Presenting Data Computation And Management Analysis Report Icon Mockup PDF to dispense important information. This template comprises three stages. It also presents valuable insights into the topics including Management Analysis Report Icon, Data Computation. This is a completely customizable PowerPoint theme that can be put to use immediately. So, download it and address the topic impactfully.

Growth Matrix For Retail Industry Data Analysis With Diversification Ppt Powerpoint Presentation Pictures Microsoft Pdf
Presenting growth matrix for retail industry data analysis with diversification ppt powerpoint presentation pictures microsoft pdf to dispense important information. This template comprises four stages. It also presents valuable insights into the topics including market penetration, concept development, diversification, market development, present retail concept format, present customer profiles, new customer profiles. This is a completely customizable PowerPoint theme that can be put to use immediately. So, download it and address the topic impactfully.

Consumer Complaint Handling Process Table Of Contents Ppt Portfolio Visuals PDF
This is a consumer complaint handling process table of contents ppt portfolio visuals pdf template with various stages. Focus and dispense information on eight stages using this creative set, that comes with editable features. It contains large content boxes to add your information on topics like current problems, complaint escalation, complaint management, complaint management team, automation compliant management, complaint handling system dashboard, complaint call handling dashboard. You can also showcase facts, figures, and other relevant content using this PPT layout. Grab it now.
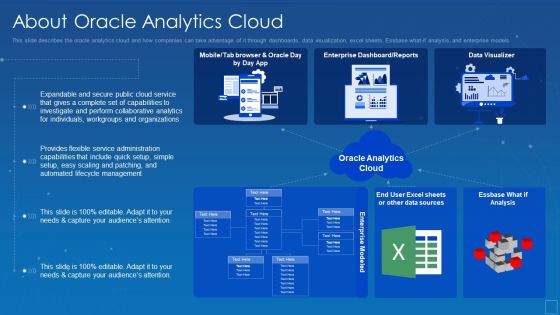
Oracle Cloud Data Analytics Administration IT About Oracle Analytics Cloud Clipart PDF
This slide describes the oracle analytics cloud and how companies can take advantage of it through dashboards, data visualization, excel sheets, Essbase what if analysis, and enterprise models. Deliver and pitch your topic in the best possible manner with this oracle cloud data analytics administration it about oracle analytics cloud clipart pdf. Use them to share invaluable insights on management, lifecycle, capabilities, service, flexible and impress your audience. This template can be altered and modified as per your expectations. So, grab it now.
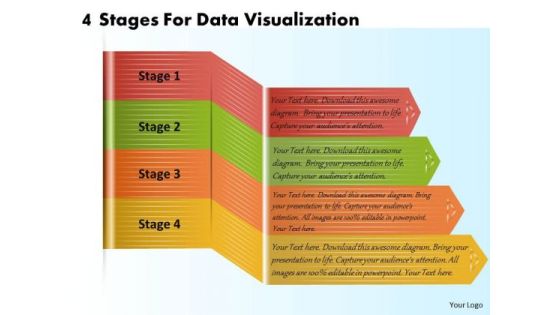
Business Plan And Strategy 4 Stages For Data Visualization Strategic Planning Template Ppt Slide
Your Listeners Will Never Doodle. Our business plan and strategy 4 stages for data visualization strategic planning template ppt slide Powerpoint Templates Will Hold Their Concentration. Do The One Thing With Your Thoughts. Uphold Custom With Our Process and Flows Powerpoint Templates.
Electric Circuit Issues Analysis Vector Icon Ppt PowerPoint Presentation Gallery Graphics Template PDF
Persuade your audience using this electric circuit issues analysis vector icon ppt powerpoint presentation gallery graphics template pdf. This PPT design covers three stages, thus making it a great tool to use. It also caters to a variety of topics including electric circuit issues analysis vector icon. Download this PPT design now to present a convincing pitch that not only emphasizes the topic but also showcases your presentation skills.

Project Issues Report Ppt PowerPoint Presentation Slide
This is a project issues report ppt powerpoint presentation slide. This is a six stage process. The stages in this process are issue description, reported on, reported by, owner, severity.
HR Process Analysis Vector Icon Ppt PowerPoint Presentation Styles Professional PDF
Presenting HR process analysis vector icon ppt powerpoint presentation styles professional pdf to dispense important information. This template comprises three stages. It also presents valuable insights into the topics including hr process analysis vector icon. This is a completely customizable PowerPoint theme that can be put to use immediately. So, download it and address the topic impactfully.

Enterprise Solutions And Tools Project Monitoring Ppt File Visuals PDF
This slide enterprise solutions and tools for project controls. It provides information about user dashboards, time-phasing, bar charts and graph, collaboration and confidentiality. Pitch your topic with ease and precision using this Enterprise Solutions And Tools Project Monitoring Ppt File Visuals PDF. This layout presents information on User Dashboards, Time Phasing, Collaboration. It is also available for immediate download and adjustment. So, changes can be made in the color, design, graphics or any other component to create a unique layout.

Social Platforms Data Analysis Influencer Marketing Data Icon Mockup PDF
Persuade your audience using this Social Platforms Data Analysis Influencer Marketing Data Icon Mockup PDF. This PPT design covers three stages, thus making it a great tool to use. It also caters to a variety of topics including Social Platforms Data Analysis, Influencer Marketing Data Icon. Download this PPT design now to present a convincing pitch that not only emphasizes the topic but also showcases your presentation skills.

Digitally Streamline Automation Sales Operations Choosing Best CRM System To Improve Sales Background PDF
This slide shows the comparison of customer relationship management on the basis of features such as phone support, live chat, custom dashboards, automated responses, round the clock support, etc. Deliver an awe inspiring pitch with this creative Digitally Streamline Automation Sales Operations Choosing Best CRM System To Improve Sales Background PDF bundle. Topics like Custom Dashboards, Automated Responses, Cost can be discussed with this completely editable template. It is available for immediate download depending on the needs and requirements of the user.

Sales Procedure Automation To Enhance Sales Choosing Best CRM System To Improve Sales Diagrams PDF
This slide shows the comparison of customer relationship management on the basis of features such as phone support, live chat, custom dashboards, automated responses, round the clock support, etc.Deliver an awe inspiring pitch with this creative Sales Procedure Automation To Enhance Sales Choosing Best CRM System To Improve Sales Diagrams PDF bundle. Topics like Custom Dashboards, Automated Responses, Phone Support can be discussed with this completely editable template. It is available for immediate download depending on the needs and requirements of the user.

Data Lake Architecture Future Of Data Analysis Difference Between Data Lake And Data Warehouse Information PDF
This slide depicts the difference between a data lake and a data warehouse based on characteristics such as data, schema, price, performance, users, and analytics.Deliver an awe inspiring pitch with this creative Data Lake Architecture Future Of Data Analysis Difference Between Data Lake And Data Warehouse Information PDF bundle. Topics like Relational And Transactional, Systems Operational, Databases can be discussed with this completely editable template. It is available for immediate download depending on the needs and requirements of the user.
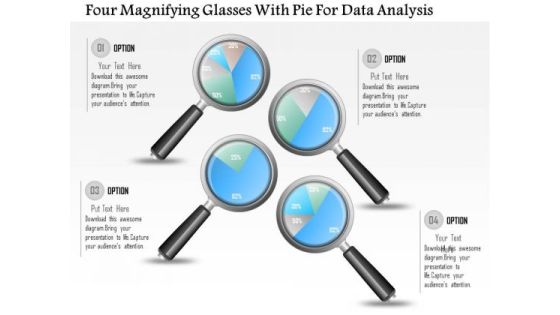
Business Diagram Four Magnifying Glasses With Pie For Data Analysis PowerPoint Slide
This business diagram displays graphic of pie charts in shape of magnifying glasses This business slide is suitable to present and compare business data. Use this diagram to build professional presentations for your viewers.
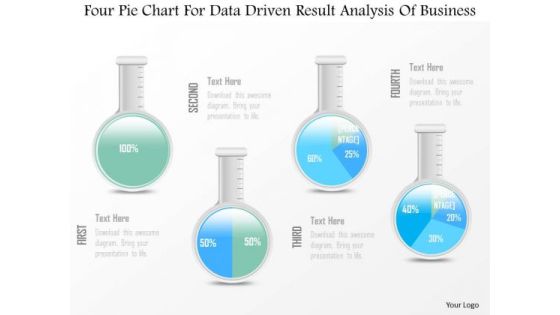
Business Diagram Four Pie Chart For Data Driven Result Analysis Of Business PowerPoint Slide
This business diagram displays graphic of pie charts in shape of flasks. This business slide is suitable to present and compare business data. Use this diagram to build professional presentations for your viewers.

Marketing And Launch Cost Analysis Ppt PowerPoint Presentation Portfolio Structure
This is a marketing and launch cost analysis ppt powerpoint presentation portfolio structure. This is a three stage process. The stages in this process are event, guerrilla marketing, social media, pay with a tweet, promotional video.
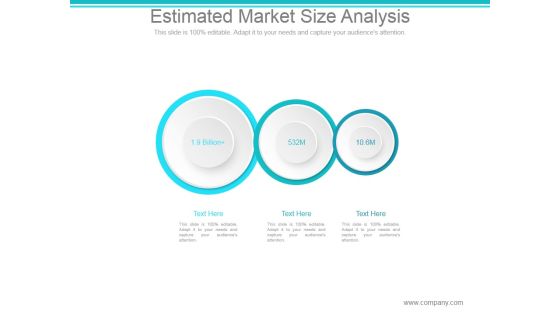
Estimated Market Size Analysis Ppt PowerPoint Presentation Slide Download
This is a estimated market size analysis ppt powerpoint presentation slide download. This is a three stage process. The stages in this process are billion, market, business.

Campaign Report Ppt PowerPoint Presentation File Icon
This is a campaign report ppt powerpoint presentation file icon. This is a ten stage process. The stages in this process are email name, send date time, recipients, delivered, spam.

Social Platforms Data Analysis Marketing Statistical Data Icon Ideas PDF
Presenting Social Platforms Data Analysis Marketing Statistical Data Icon Ideas PDF to dispense important information. This template comprises three stages. It also presents valuable insights into the topics including Social Platforms Data Analysis, Marketing Statistical Data Icon. This is a completely customizable PowerPoint theme that can be put to use immediately. So, download it and address the topic impactfully.
Project Conclusion Report Budget Costs Ppt PowerPoint Presentation Icon Graphics
This is a project conclusion report budget costs ppt powerpoint presentation icon graphics. This is a four stage process. The stages in this process are type of cost, planned costs, actual costs, equipment.

Data Structure IT Swot Analysis Diagrams PDF
Presenting this PowerPoint presentation, titled Data Structure IT Swot Analysis Diagrams PDF, with topics curated by our researchers after extensive research. This editable presentation is available for immediate download and provides attractive features when used. Download now and captivate your audience. Presenting this Data Structure IT Swot Analysis Diagrams PDF. Our researchers have carefully researched and created these slides with all aspects taken into consideration. This is a completely customizable Data Structure IT Swot Analysis Diagrams PDF that is available for immediate downloading. Download now and make an impact on your audience. Highlight the attractive features available with our PPTs.
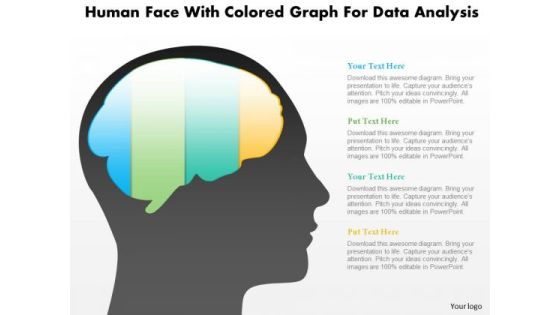
Business Diagram Human Face With Colored Graph For Data Analysis PowerPoint Slide
This diagram displays human face graphic with colored graph. This diagram can be used to represent strategy, planning, thinking of business plan. Display business options in your presentations by using this creative diagram.

Risk Management Report Template 2 Ppt PowerPoint Presentation Infographics Brochure
This is a risk management report template 2 ppt powerpoint presentation infographics brochure. This is a five stage process. The stages in this process are insignificant, minor, moderate, major, severe.
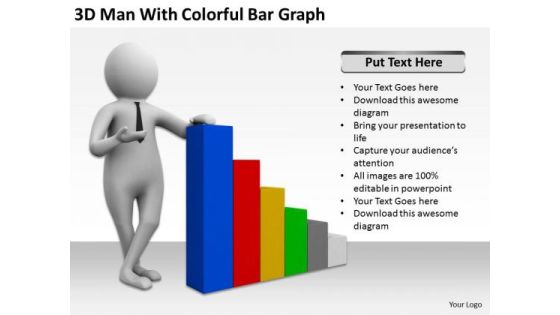
Top Business People 3d Man With Colorful Bar Graph PowerPoint Templates
We present our top business people 3d man with colorful bar graph PowerPoint templates.Download and present our Business PowerPoint Templates because Our PowerPoint Templates and Slides will let your words and thoughts hit bullseye everytime. Use our People PowerPoint Templates because Our PowerPoint Templates and Slides are effectively colour coded to prioritise your plans They automatically highlight the sequence of events you desire. Use our Future PowerPoint Templates because Our PowerPoint Templates and Slides will let you Hit the target. Go the full distance with ease and elan. Present our Marketing PowerPoint Templates because Our PowerPoint Templates and Slides will generate and maintain the level of interest you desire. They will create the impression you want to imprint on your audience. Present our Success PowerPoint Templates because Our PowerPoint Templates and Slides will provide weight to your words. They will bring out the depth of your thought process.Use these PowerPoint slides for presentations relating to 3d, achievement, ascending, bar, bargraph, business, businessman, career,chart, company, concept, corporate, design, development, executive, finance,financial, gain, goal, graph, graphic, growing, growth, happy, illustration, improvement, increase, man, manager, office, people, performance, person,photo, presentation, professional, profit, progress, report, rising, statistics,success, successful, technology, upward, top, winner. The prominent colors used in the PowerPoint template are Blue, Yellow, Red.
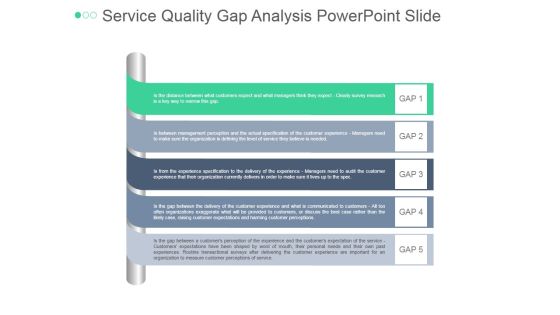
Service Quality Gap Analysis Ppt PowerPoint Presentation Visuals
This is a service quality gap analysis ppt powerpoint presentation visuals. This is a five stage process. The stages in this process are analysis, business, marketing, strategy, management, success.

Bar Chart With Magnifying Glass For Product Performance Analysis Ppt PowerPoint Presentation Gallery Example File PDF
Presenting bar chart with magnifying glass for product performance analysis ppt powerpoint presentation gallery example file pdf to dispense important information. This template comprises three stages. It also presents valuable insights into the topics including bar chart with magnifying glass for product performance analysis. This is a completely customizable PowerPoint theme that can be put to use immediately. So, download it and address the topic impactfully.

Software Incident Report Template Powerpoint Slide Background Designs
This is a software incident report template powerpoint slide background designs. This is a seven stage process. The stages in this process are test execution, environment setup, product release, test planning, test design, code reviews, test reports.

Business Data Analysis Data Warehouse Appliances Download PDF
Deliver and pitch your topic in the best possible manner with this business data analysis data warehouse appliances download pdf. Use them to share invaluable insights on are collecting from operational systems the internal, transactional data that is already prepared for analysis, these will likely become an integration target that will assist in enhancing the parsed and reduced results from your big data installation and impress your audience. This template can be altered and modified as per your expectations. So, grab it now.

Quarterly Revenue Data Insights Report Template PDF
The following slide gives an insight of organizations quarter wise revenue to assess the most profitable and weak segment for strategy formulation. It also includes operating divisions, product segments, SEQ and YOY growth. Showcasing this set of slides titled Quarterly Revenue Data Insights Report Template PDF. The topics addressed in these templates are Operating, Divisions products, Insights Report. All the content presented in this PPT design is completely editable. Download it and make adjustments in color, background, font etc. as per your unique business setting.

Pmi Best Practices Ppt Powerpoint Presentation Examples
This is a pmi best practices ppt powerpoint presentation examples. This is a three stage process. The stages in this process are plan, scope, schedule, cost, execute, work, record, control, measure, analyze, report.

Magnify Ppt PowerPoint Presentation Summary Portfolio
This is a magnify ppt powerpoint presentation summary portfolio. This is a five stage process. The stages in this process are magnify, business, technology, data analysis, marketing.

Enhancing Cyber Safety With Vulnerability Administration Security Information And Event Management Inspiration PDF
This slide covers the SIEM services offered by our company such as data aggregation, correlation, security alerts, dashboards, retention, forensic analysis, IT compliance, threat detection, etc. Presenting enhancing cyber safety with vulnerability administration security information and event management inspiration pdf to provide visual cues and insights. Share and navigate important information on two stages that need your due attention. This template can be used to pitch topics like data retention, forensic analysis, dashboards, data correlation, data aggregation. In addtion, this PPT design contains high resolution images, graphics, etc, that are easily editable and available for immediate download.
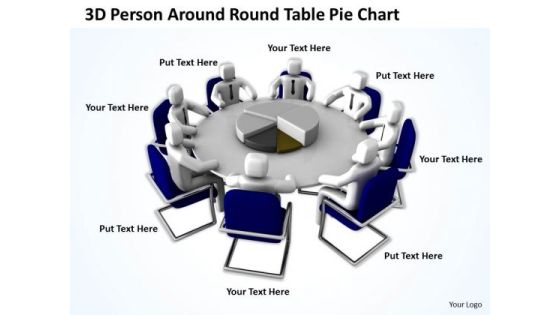
Business Persons 3d Around Table Pie Chart PowerPoint Templates
We present our business persons 3d around table pie chart PowerPoint templates.Download and present our Business PowerPoint Templates because Our PowerPoint Templates and Slides are focused like a searchlight beam. They highlight your ideas for your target audience. Download and present our Circle Charts PowerPoint Templates because Our PowerPoint Templates and Slides will let your words and thoughts hit bullseye everytime. Present our Teamwork PowerPoint Templates because Our PowerPoint Templates and Slides will Activate the energies of your audience. Get their creative juices flowing with your words. Download and present our Future PowerPoint Templates because You have gained great respect for your brilliant ideas. Use our PowerPoint Templates and Slides to strengthen and enhance your reputation. Use our Shapes PowerPoint Templates because You should Ascend the ladder of success with ease. Our PowerPoint Templates and Slides will provide strong and sturdy steps.Use these PowerPoint slides for presentations relating to 3d, arrow, boss, business, businessmen, cgi, chart, communication, company,concept, conference, cooperation, corporate, diagram, director, economy,executive, finance, financial, firm, graph, group, growth, illustration, improvement,increase, job, leader, manager, market, meeting, men, money, office, people,presentation, pie, project, render, report, rise, sales, success,successful, symbol, table, team, teamwork, up, work. The prominent colors used in the PowerPoint template are Blue, White, Gray.

Data Warehousing IT Data Warehouse Architecture With Staging Area And Data Ppt Layouts Example PDF
This slide depicts a data warehouse architecture with a staging area and data marts and how it can be used for different groups within an organization. Deliver and pitch your topic in the best possible manner with this data warehousing it data warehouse architecture with staging area and data ppt layouts example pdf. Use them to share invaluable insights on inventory, sales, purchasing, analysis, reporting and impress your audience. This template can be altered and modified as per your expectations. So, grab it now.

Change Analysis And Management Vector Icon Ppt PowerPoint Presentation File Outfit PDF
Persuade your audience using this change analysis and management vector icon ppt powerpoint presentation file outfit pdf. This PPT design covers three stages, thus making it a great tool to use. It also caters to a variety of topics including change analysis and management vector icon. Download this PPT design now to present a convincing pitch that not only emphasizes the topic but also showcases your presentation skills.

Best Practices For Efficient Power Consumption Management Sample PDF
The slide showcases the best practices implementing which commercial entities and manufacturers can minimize energy costs by carefully monitoring and understanding their energy utilization. It covers lead by example, collect data before executing, select the appropriate hardware and explore software options. Persuade your audience using this Best Practices For Efficient Power Consumption Management Sample PDF. This PPT design covers five stages, thus making it a great tool to use. It also caters to a variety of topics including Appropriate Hardware, Collect Data Before Executing, Explore Software Options. Download this PPT design now to present a convincing pitch that not only emphasizes the topic but also showcases your presentation skills.

Kubernetes Containers Architecture Overview Master Nodes In Kubernetes Ppt Portfolio Graphics PDF
Presenting this set of slides with name kubernetes containers architecture overview master nodes in kubernetes ppt portfolio graphics pdf. This is a five stage process. The stages in this process are controller, api server, schedular, key value store, master, dashboard. This is a completely editable PowerPoint presentation and is available for immediate download. Download now and impress your audience.

Magnifying Glass Ppt PowerPoint Presentation Outline Design Templates
This is a magnifying glass ppt powerpoint presentation outline design templates. This is a four stage process. The stages in this process are business, management, analysis, strategy, marketing.
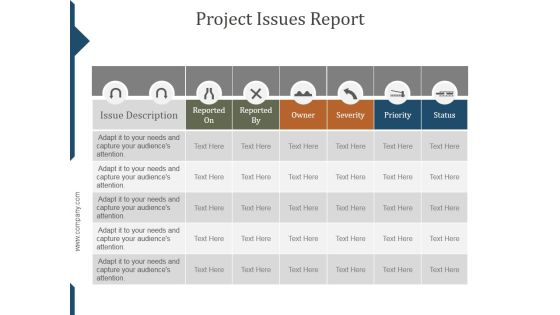
Project Issues Report Ppt PowerPoint Presentation Slide Download
This is a project issues report ppt powerpoint presentation slide download. This is a six stage process. The stages in this process are issue description, reported on, reported by, owner, severity, priority, status.

Business And Financial Analysis Ppt PowerPoint Presentation Portfolio Templates
This is a business and financial analysis ppt powerpoint presentation portfolio templates. This is a four stage process. The stages in this process are investment, tables, data analysis, marketing, equipment.

Data Collection And Analysis Flow Chart Ppt PowerPoint Presentation Sample
This is a data collection and analysis flow chart ppt powerpoint presentation sample. This is a five stage process. The stages in this process are business, strategy, marketing, process, growth strategy, finance.
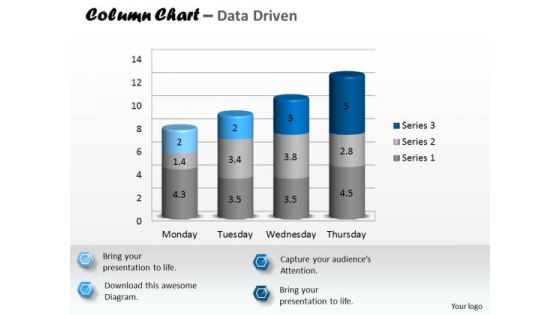
Data Analysis In Excel 3d Column Chart To Represent Information PowerPoint Templates
Rake In The Dough With

Consumers Research And Analysis Vector Icon Ppt PowerPoint Presentation File Deck PDF
Persuade your audience using this consumers research and analysis vector icon ppt powerpoint presentation file deck pdf. This PPT design covers three stages, thus making it a great tool to use. It also caters to a variety of topics including consumers research and analysis vector icon. Download this PPT design now to present a convincing pitch that not only emphasizes the topic but also showcases your presentation skills.
Impact Of Efficient Survey Analysis On Better Decision Making Inspiration PDF
Persuade your audience using this Impact Of Efficient Survey Analysis On Better Decision Making Inspiration PDF. This PPT design covers three stages, thus making it a great tool to use. It also caters to a variety of topics including Impact Of Efficient, Survey Analysis. Download this PPT design now to present a convincing pitch that not only emphasizes the topic but also showcases your presentation skills.
Magnifying Glass With Arrow Statistical Analysis Vector Icon Ppt PowerPoint Presentation Show Icon
Presenting this set of slides with name magnifying glass with arrow statistical analysis vector icon ppt powerpoint presentation show icon. This is a three stage process. The stages in this process are data icon, status icon, status symbol icon. This is a completely editable PowerPoint presentation and is available for immediate download. Download now and impress your audience.
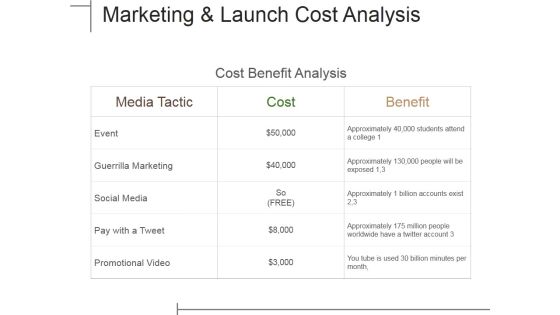
Marketing And Launch Cost Analysis Ppt PowerPoint Presentation Portfolio Good
This is a marketing and launch cost analysis ppt powerpoint presentation portfolio good. This is a three stage process. The stages in this process are media tactic, cost, benefit, event, guerrilla marketing.

Marketing And Launch Cost Analysis Ppt PowerPoint Presentation Gallery Slides
This is a marketing and launch cost analysis ppt powerpoint presentation gallery slides. This is a six stage process. The stages in this process are media tactic, event, guerrilla marketing, social media, pay with a tweet.

Enhancement Process Analysis And Planning Decision Icon Ppt Outline Visuals PDF
Presenting Enhancement Process Analysis And Planning Decision Icon Ppt Outline Visuals PDF to dispense important information. This template comprises three stages. It also presents valuable insights into the topics including Enhancement Process ,Analysis And Planning, Decision Icon. This is a completely customizable PowerPoint theme that can be put to use immediately. So, download it and address the topic impactfully.

Adaptive Data Quality Framework Sample Diagram Powerpoint Templates
This is a adaptive data quality framework sample diagram powerpoint templates. This is a three stage process. The stages in this process are review, assess, analyse, summaries, plan, execute, resolve, verify, prevent, monitor, govern, refine.
Project Timeline Ppt PowerPoint Presentation Icon Graphics Design
This is a project timeline ppt powerpoint presentation icon graphics design. This is a six stage process. The stages in this process are cost, planning, table, project report, data management.

Data Analysis Increases Effectiveness And Efficiency Ppt Powerpoint Show
This is a data analysis increases effectiveness and efficiency ppt powerpoint show. This is a five stage process. The stages in this process are is data rich report opportunistic, testing the entire populations versus sample, date analysis increases effectiveness and efficiency, effective for working remotely or on site, easier to share information electronically than via hardcopy reports.

Information Analysis And Project Management Icon Ppt Layouts Graphics Download PDF
Presenting Information Analysis And Project Management Icon Ppt Layouts Graphics Download PDF to dispense important information. This template comprises three stages. It also presents valuable insights into the topics including Information Analysis, Project Management, Icon. This is a completely customizable PowerPoint theme that can be put to use immediately. So, download it and address the topic impactfully.

Customer Centric Business Model Ppt Presentation
This is a customer centric business model ppt presentation. This is a four stage process. The stages in this process are success, arrows, business.
Information Analysis Via Literature Review Vector Icon Ppt PowerPoint Presentation Icon Ideas PDF
Persuade your audience using this information analysis via literature review vector icon ppt powerpoint presentation icon ideas pdf. This PPT design covers three stages, thus making it a great tool to use. It also caters to a variety of topics including information analysis via literature review vector icon. Download this PPT design now to present a convincing pitch that not only emphasizes the topic but also showcases your presentation skills.
Information Analysis With Magnifying Glass Vector Icon Ppt PowerPoint Presentation File Inspiration PDF
Persuade your audience using this information analysis with magnifying glass vector icon ppt powerpoint presentation file inspiration pdf. This PPT design covers three stages, thus making it a great tool to use. It also caters to a variety of topics including information analysis with magnifying glass vector icon. Download this PPT design now to present a convincing pitch that not only emphasizes the topic but also showcases your presentation skills.

Business Change Analysis To Identify Information Gaps Ppt PowerPoint Presentation File Skills PDF
Persuade your audience using this business change analysis to identify information gaps ppt powerpoint presentation file skills pdf. This PPT design covers three stages, thus making it a great tool to use. It also caters to a variety of topics including business change analysis to identify information gaps. Download this PPT design now to present a convincing pitch that not only emphasizes the topic but also showcases your presentation skills.

Business Diagram Thumb Diagram With Five Stages For Data Representation PowerPoint Slide
This business diagram displays thumb up with five stages. This diagram contains text boxes for data representation. Use this diagram to display business process workflows in any presentations.

Annual Financial Budget Analysis Example Of Ppt
This is a annual financial budget analysis example of ppt. This is a five stage process. The stages in this process are business, strategy, finance, planning, compare.

Bar Graph Icon For Research Analysis Ppt PowerPoint Presentation Summary Portfolio
Presenting this set of slides with name bar graph icon for research analysis ppt powerpoint presentation summary portfolio. This is a three stage process. The stages in this process are data visualization icon, research analysis, business focus. This is a completely editable PowerPoint presentation and is available for immediate download. Download now and impress your audience.
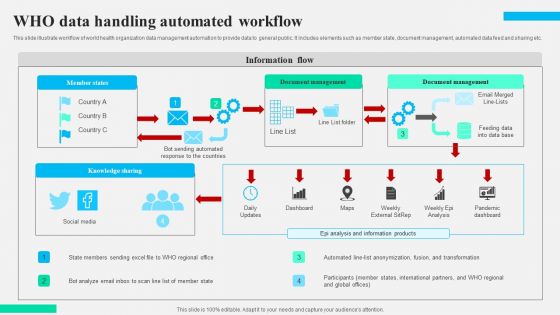
Who Data Handling Automated Workflow Background PDF
This slide illustrate workflow of world health organization data management automation to provide data to general public. It includes elements such as member state, document management, automated data feed and sharing etc. Pitch your topic with ease and precision using this Who Data Handling Automated Workflow Background PDF. This layout presents information on Social Media, Dashboard, Analysis And Information Products. It is also available for immediate download and adjustment. So, changes can be made in the color, design, graphics or any other component to create a unique layout.
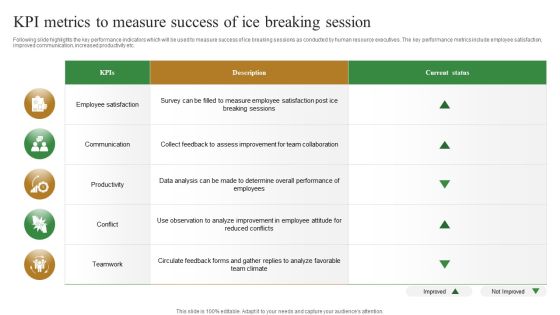
KPI Metrics To Measure Success Of Ice Breaking Session Microsoft PDF
Following slide highlights the key performance indicators which will be used to measure success of ice breaking sessions as conducted by human resource executives. The key performance metrics include employee satisfaction, improved communication, increased productivity etc. Showcasing this set of slides titled KPI Metrics To Measure Success Of Ice Breaking Session Microsoft PDF. The topics addressed in these templates are Communication, Productivity, Teamwork. All the content presented in this PPT design is completely editable. Download it and make adjustments in color, background, font etc. as per your unique business setting.

Competitor Analysis Tools Ppt PowerPoint Presentation Example File
This is a competitor analysis tools ppt powerpoint presentation example file. This is a five stage process. The stages in this process are criteria, revenue, profit, market share, main activity, number of employee, product quality.

Project Conclusion Report Budget Costs Ppt PowerPoint Presentation Show Picture
This is a project conclusion report budget costs ppt powerpoint presentation show picture. This is a four stage process. The stages in this process are type of cost, planned costs, actual costs, deviations.

Business Diagram Flask With Data Driven Chart PowerPoint Slide
This data driven diagram has been designed with flask graphics. Download this diagram to give your presentations more effective look. It helps in clearly conveying your message to clients and audience.

Business Diagram Laptop With Data Driven Area Chart PowerPoint Slide
This diagram has been designed with laptop and data driven area chart. Download this diagram to give your presentations more effective look. It helps in clearly conveying your message to clients and audience.

Real Time Assessment Of Security Threats Security Information And Event Management Services Information PDF
This slide covers the SIEM services offered by our company such as data aggregation, correlation, security alerts, dashboards, retention, forensic analysis, IT compliance, threat detection, etc. Presenting real time assessment of security threats security information and event management services information pdf to provide visual cues and insights. Share and navigate important information on eight stages that need your due attention. This template can be used to pitch topics like data aggregation, data correlation, security alert, dashboards, data retention. In addtion, this PPT design contains high resolution images, graphics, etc, that are easily editable and available for immediate download.
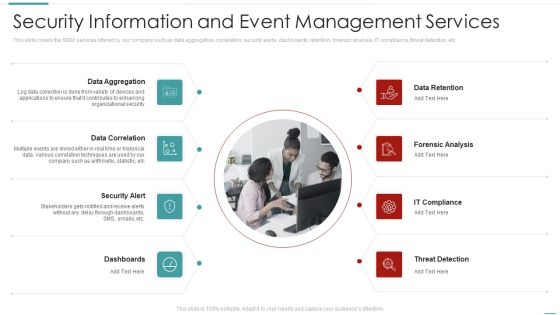
Risk Recognition Automation Security Information And Event Management Services Ppt Slides Demonstration PDF
This slide covers the SIEM services offered by our company such as data aggregation, correlation, security alerts, dashboards, retention, forensic analysis, IT compliance, threat detection, etc. Presenting risk recognition automation security information and event management services ppt slides demonstration pdf to provide visual cues and insights. Share and navigate important information on eight stages that need your due attention. This template can be used to pitch topics like data aggregation, data correlation, security alert, dashboards, data retention. In addtion, this PPT design contains high resolution images, graphics, etc, that are easily editable and available for immediate download.
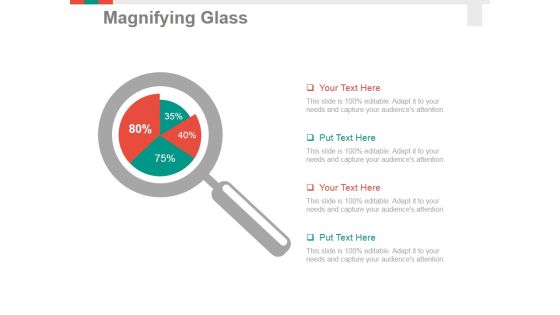
Magnifying Glass Ppt PowerPoint Presentation Pictures Graphics Design
This is a magnifying glass ppt powerpoint presentation pictures graphics design. This is a four stage process. The stages in this process are magnifier, search, marketing, analysis, business.
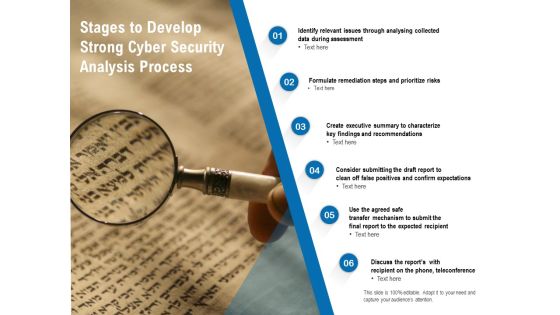
Stages To Develop Strong Cyber Security Analysis Process Ppt PowerPoint Presentation Outline Example File PDF
Persuade your audience using this stages to develop strong cyber security analysis process ppt powerpoint presentation outline example file pdf. This PPT design covers six stages, thus making it a great tool to use. It also caters to a variety of topics including formulate remediation steps and prioritize risks, analysing collected, recipient on the phone, teleconference. Download this PPT design now to present a convincing pitch that not only emphasizes the topic but also showcases your presentation skills.

Data Lake Architecture Future Of Data Analysis Purpose Of Data Lake In Business Background PDF
This slide depicts the purpose of the data lake in the business such as beneficial for time-to-market analytics, IT-driven business process, cost-effective decisions, and so on.Presenting Data Lake Architecture Future Of Data Analysis Purpose Of Data Lake In Business Background PDF to provide visual cues and insights. Share and navigate important information on six stages that need your due attention. This template can be used to pitch topics like Analytics Solutions, Business Process, Implementing A Cloud. In addtion, this PPT design contains high resolution images, graphics, etc, that are easily editable and available for immediate download.

Quality Management Definition Ppt PowerPoint Presentation Clipart
This is a quality management definition ppt powerpoint presentation clipart. This is a one stage process. The stages in this process are quality management, magnifier, search, marketing, analysis, business.
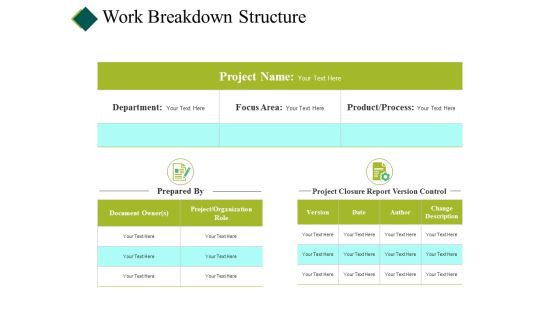
Work Breakdown Structure Ppt PowerPoint Presentation Show Example File
This is a work breakdown structure ppt powerpoint presentation show example file. This is a three stage process. The stages in this process are cost, planning, table, project report, data management.

Data Assimilation BI Applications Load Ppt Professional Layout Ideas PDF
This is a data assimilation bi applications load ppt professional layout ideas pdf template with various stages. Focus and dispense information on eleven stages using this creative set, that comes with editable features. It contains large content boxes to add your information on topics like visualization, dashboards, reporting, extraction, transformation. You can also showcase facts, figures, and other relevant content using this PPT layout. Grab it now.
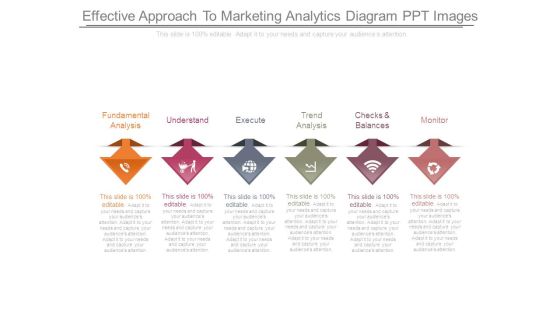
Effective Approach To Marketing Analytics Diagram Ppt Images
This is a effective approach to marketing analytics diagram ppt images. This is a six stage process. The stages in this process are fundamental analysis, understand, execute, trend analysis, checks and balances, monitor.
Icon Of Macroeconomic Analysis Illustrating Risk Reduction In Economy Formats PDF
Presenting Icon Of Macroeconomic Analysis Illustrating Risk Reduction In Economy Formats PDF to dispense important information. This template comprises one stages. It also presents valuable insights into the topics including Icon Of Macroeconomic Analysis Illustrating Risk Reduction In Economy. This is a completely customizable PowerPoint theme that can be put to use immediately. So, download it and address the topic impactfully.

Market Research Icon For Competitive Assessment Mockup PDF
Persuade your audience using this Market Research Icon For Competitive Assessment Mockup PDF. This PPT design covers three stages, thus making it a great tool to use. It also caters to a variety of topics including Market Research Icon, Competitive Assessment. Download this PPT design now to present a convincing pitch that not only emphasizes the topic but also showcases your presentation skills.
Icon For Target Market Assessment Survey Diagrams PDF
Persuade your audience using this Icon For Target Market Assessment Survey Diagrams PDF. This PPT design covers four stages, thus making it a great tool to use. It also caters to a variety of topics including Icon For Target Market, Assessment Survey. Download this PPT design now to present a convincing pitch that not only emphasizes the topic but also showcases your presentation skills.
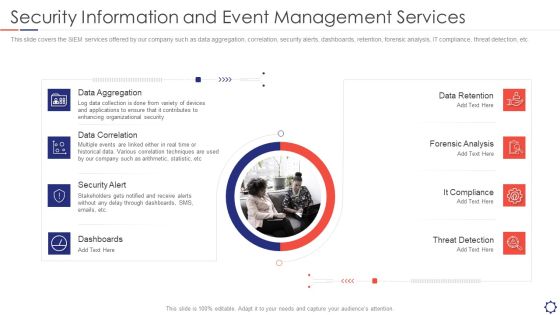
SIEM Security Information And Event Management Services Ppt Ideas Graphics Pictures PDF
This slide covers the SIEM services offered by our company such as data aggregation, correlation, security alerts, dashboards, retention, forensic analysis, IT compliance, threat detection, etc. This is a siem security information and event management services ppt ideas graphics pictures pdf template with various stages. Focus and dispense information on eight stages using this creative set, that comes with editable features. It contains large content boxes to add your information on topics like Data Aggregation, Data Correlation, Security Alert, Dashboards, Data Retention. You can also showcase facts, figures, and other relevant content using this PPT layout. Grab it now.
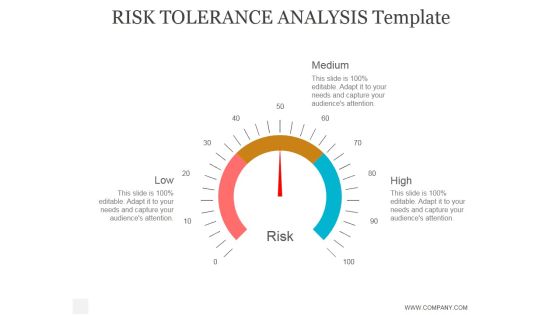
Risk Tolerance Analysis Template Ppt PowerPoint Presentation Example
This is a risk tolerance analysis template ppt powerpoint presentation example. This is a four stage process. The stages in this process are business, strategy, marketing, analysis, success, arrow.
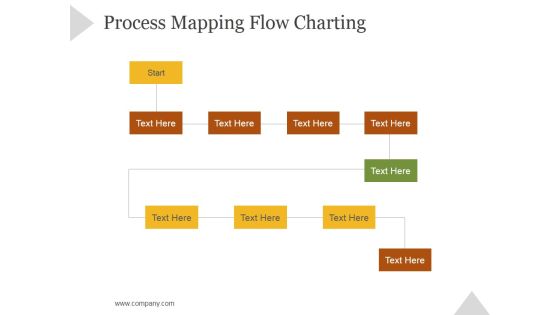
Process Mapping Flow Charting Ppt PowerPoint Presentation Slide Download
This is a process mapping flow charting ppt powerpoint presentation slide download. This is a ten stage process. The stages in this process are business, strategy, marketing, success, growth strategy, flowchart.
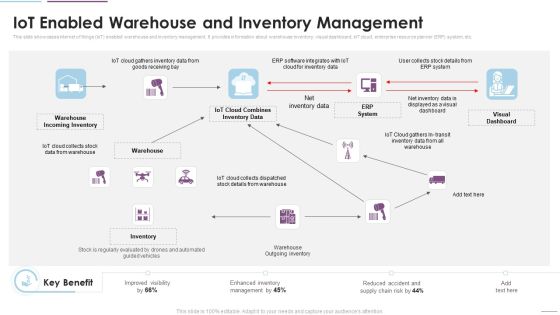
Supply Chain Management Iot Enabled Warehouse And Inventory Management Demonstration PDF
This slide showcases internet of things IoT enabled warehouse and inventory management. It provides information about warehouse inventory, visual dashboard, IoT cloud, enterprise resource planner ERP system, etc. Presenting Supply Chain Management Iot Enabled Warehouse And Inventory Management Demonstration PDF to provide visual cues and insights. Share and navigate important information on one stages that need your due attention. This template can be used to pitch topics like Warehouse Incoming Inventory, Visual Dashboard, ERP System. In addtion, this PPT design contains high resolution images, graphics, etc, that are easily editable and available for immediate download.
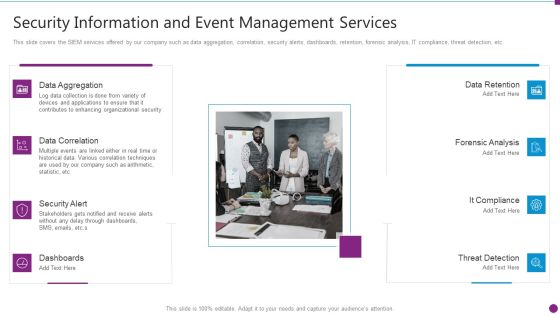
Security Information And Event Management Services Mockup PDF
This slide covers the SIEM services offered by our company such as data aggregation, correlation, security alerts, dashboards, retention, forensic analysis, IT compliance, threat detection, etc. Presenting security information and event management services mockup pdf to provide visual cues and insights. Share and navigate important information on eight stages that need your due attention. This template can be used to pitch topics like data aggregation, data correlation, security alert, dashboards. In addtion, this PPT design contains high resolution images, graphics, etc, that are easily editable and available for immediate download.

Solution Selling Template Powerpoint Slide Designs Download
This is a solution selling template powerpoint slide designs download. This is a five stage process. The stages in this process are export controls, report and refine, campaign invention, execution, goals and objective.

Business Diagram Alarm Clock With Pie Chart For Result Analysis PowerPoint Slide
This business slide displays alarm clock with pie chart. This diagram is a data visualization tool that gives you a simple way to present statistical information. This slide helps your audience examine and interpret the data you present.

Tools Used By Organizations For 5S Lean Production Strategies Ppt Icon Slides PDF
This slide defines the 5s lean strategic tools used by the organization. It includes information related dashboards, trend charts and checklist used to analyze the working conditions of an industry. Presenting Tools Used By Organizations For 5S Lean Production Strategies Ppt Icon Slides PDF to dispense important information. This template comprises four stages. It also presents valuable insights into the topics including Checklist, Trends Charts, Dashboards. This is a completely customizable PowerPoint theme that can be put to use immediately. So, download it and address the topic impactfully.

Campaign Report Ppt PowerPoint Presentation Show Graphic Tips
This is a campaign report ppt powerpoint presentation show graphic tips. This is a ten stage process. The stages in this process are email name, send date time, recipients, delivered, spam.
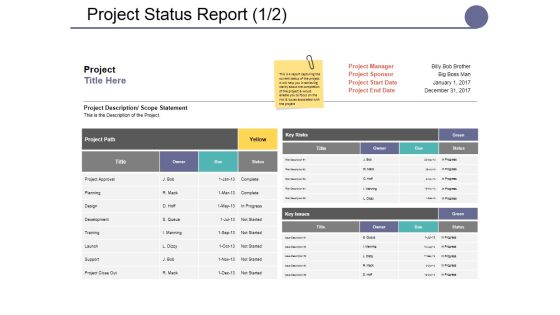
Project Status Report Ppt PowerPoint Presentation Slides Format Ideas
This is a project status report ppt powerpoint presentation slides format ideas. This is a six stage process. The stages in this process are deadlines, budget, requirements, overall status, next steps.

Project Conclusion Report Deadline Milestones Ppt PowerPoint Presentation Outline Guidelines
This is a project conclusion report deadline milestones ppt powerpoint presentation outline guidelines. This is a four stage process. The stages in this process are staff costs, material, travel expenses, advertising expenses, hardware.

Project Conclusion Report Deadline Milestones Ppt PowerPoint Presentation File Examples
This is a project conclusion report deadline milestones ppt powerpoint presentation file examples. This is a four stage process. The stages in this process are date, milestone, deviations, cause.

Kaizen Report Form Ppt PowerPoint Presentation Styles Samples
This is a kaizen report form ppt powerpoint presentation styles samples. This is a four stage process. The stages in this process are problem description, solution description, before, after, implementation date.

Components Of The Audit Plan Template Powerpoint Slide
This is a components of the audit plan template powerpoint slide. This is a six stage process. The stages in this process are risk assessment, internal audit plan, stakeholder reporting, project plan, project execution, project reporting.

Contract Lifecycle Example Diagram Presentation Deck
This is a contract lifecycle example diagram presentation deck. This is a eight stage process. The stages in this process are create, risk management, execute, reporting, quality, approve, incident reporting and analysis, exit.

Data Assimilation BI Applications Monitoring Ppt Icon Maker PDF
Presenting data assimilation bi applications monitoring ppt icon maker pdf to provide visual cues and insights. Share and navigate important information on nine stages that need your due attention. This template can be used to pitch topics like digital dashboards, business, monitoring, data warehouse, data mining. In addtion, this PPT design contains high resolution images, graphics, etc, that are easily editable and available for immediate download.
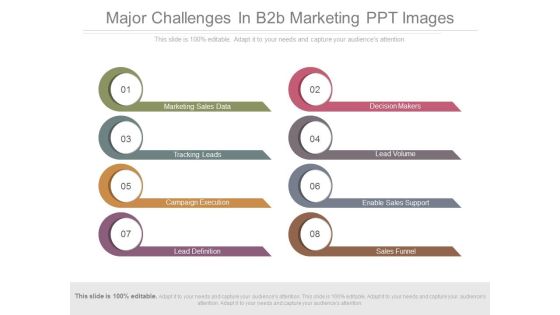
Major Challenges In B2b Marketing Ppt Images
This is a major challenges in b2b marketing ppt images. This is a eight stage process. The stages in this process are marketing sales data, decision makers, tracking leads, lead volume, campaign execution, enable sales support, lead definition, sales funnel.
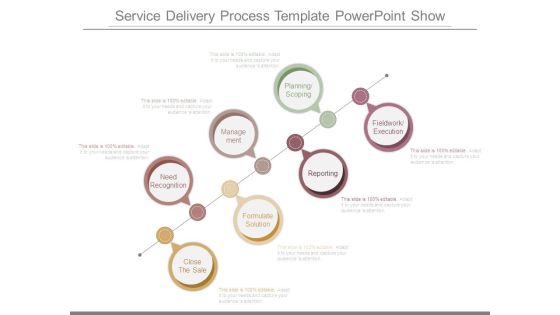
Service Delivery Process Template Powerpoint Show
This is a service delivery process template powerpoint show. This is a seven stage process. The stages in this process are need recognition, management, planning scoping, close the sale, formulate solution, reporting, fieldwork execution.
Business Diagram 3d Capsule With Multiple Icons For Business Data Flow PowerPoint Slide
This diagram has been designed with 3d graphic of capsule with multiple icons. This data driven PowerPoint slide can be used to give your presentations more effective look. It helps in clearly conveying your message to clients and audience.
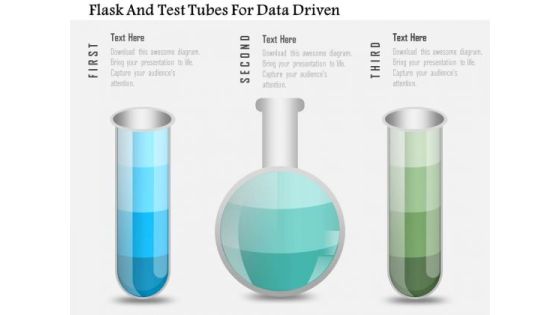
Business Diagram Flask And Test Tubes For Data Driven PowerPoint Slide
This data driven diagram has been designed with flask and test tubes. Download this diagram to give your presentations more effective look. It helps in clearly conveying your message to clients and audience.
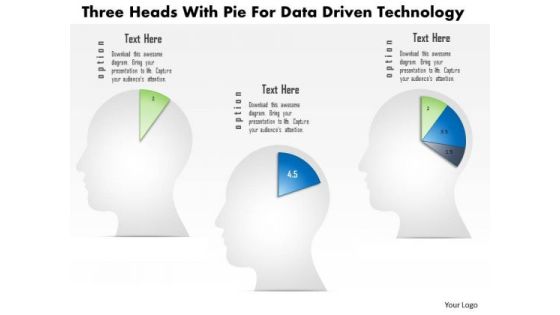
Business Diagram Three Heads With Pie For Data Driven Technology PowerPoint Slide
This business diagram displays three human faces with pie charts. This Power Point template has been designed to compare and present business data. You may use this diagram to impart professional appearance to your presentations.
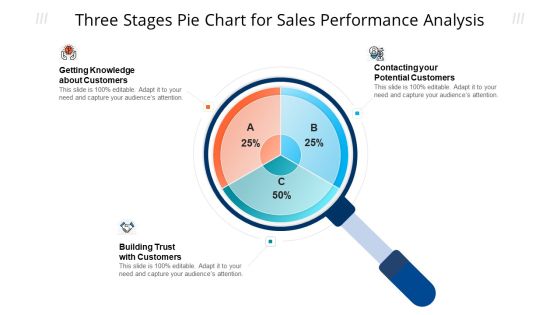
Three Stages Pie Chart For Sales Performance Analysis Ppt Model Tips PDF
Persuade your audience using this three stages pie chart for sales performance analysis ppt model tips pdf. This PPT design covers three stages, thus making it a great tool to use. It also caters to a variety of topics including potential customers, knowledge about customers, sales performance analysis. Download this PPT design now to present a convincing pitch that not only emphasizes the topic but also showcases your presentation skills.
Ingestion Icon For Stream Processing And Analysis Ppt PowerPoint Presentation Gallery Visual Aids PDF
Persuade your audience using this Ingestion Icon For Stream Processing And Analysis Ppt PowerPoint Presentation Gallery Visual Aids PDF. This PPT design covers three stages, thus making it a great tool to use. It also caters to a variety of topics including Ingestion Icon, Stream, Processing And Analysis. Download this PPT design now to present a convincing pitch that not only emphasizes the topic but also showcases your presentation skills.

Icon Of BI System To Enhance Processes For Statistical Analysis Ppt Ideas Elements PDF
Persuade your audience using this Icon Of BI System To Enhance Processes For Statistical Analysis Ppt Ideas Elements PDF. This PPT design covers four stages, thus making it a great tool to use. It also caters to a variety of topics including Icon, BI System, Enhance Processes, Statistical Analysis. Download this PPT design now to present a convincing pitch that not only emphasizes the topic but also showcases your presentation skills.

Website Analysis Icon For SEO Performance Improvement Ppt Gallery Professional PDF
Persuade your audience using this Website Analysis Icon For SEO Performance Improvement Ppt Gallery Professional PDF. This PPT design covers four stages, thus making it a great tool to use. It also caters to a variety of topics including Website Analysis, Icon, SEO Performance Improvement. Download this PPT design now to present a convincing pitch that not only emphasizes the topic but also showcases your presentation skills.

Data Structure IT Healthcare Specific Data Model Structure Brochure PDF
If you are looking for a format to display your unique thoughts, then the professionally designed Data Structure IT Healthcare Specific Data Model Structure Brochure PDF is the one for you. You can use it as a Google Slides template or a PowerPoint template. Incorporate impressive visuals, symbols, images, and other charts. Modify or reorganize the text boxes as you desire. Experiment with shade schemes and font pairings. Alter, share or cooperate with other people on your work. Download Data Structure IT Healthcare Specific Data Model Structure Brochure PDF and find out how to give a successful presentation. Present a perfect display to your team and make your presentation unforgettable.

Statistical Data Analysis Chart Of Collected Data Formats PDF
Presenting statistical data analysis chart of collected data formats pdf to dispense important information. This template comprises four stages. It also presents valuable insights into the topics including statistical data analysis chart of collected data. This is a completely customizable PowerPoint theme that can be put to use immediately. So, download it and address the topic impactfully.
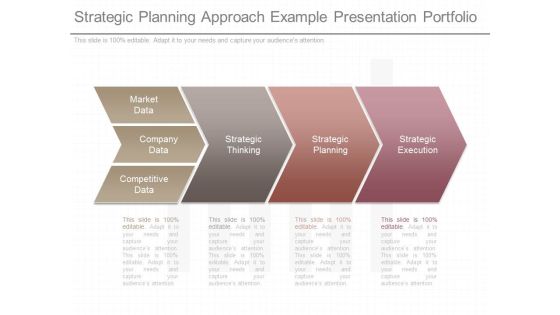
Strategic Planning Approach Example Presentation Portfolio
This is a strategic planning approach example presentation portfolio. This is a four stage process. The stages in this process are market data, company data, competitive data, strategic thinking, strategic planning, strategic execution.
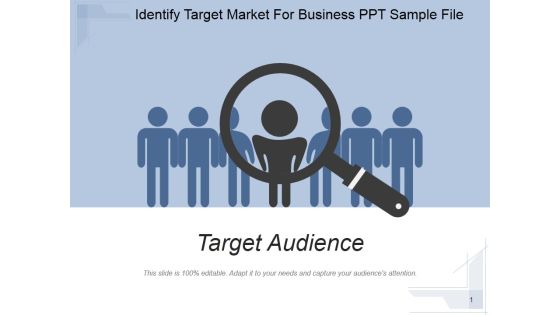
Identify Target Market For Business Ppt PowerPoint Presentation Background Image
This is a identify target market for business ppt powerpoint presentation background image. This is a one stage process. The stages in this process are target audience, business, magnifier, research, marketing.

Work Breakdown Structure Ppt PowerPoint Presentation Portfolio Display
This is a work breakdown structure ppt powerpoint presentation portfolio display. This is a three stage process. The stages in this process are project name, prepared by, project closure report version control, department.
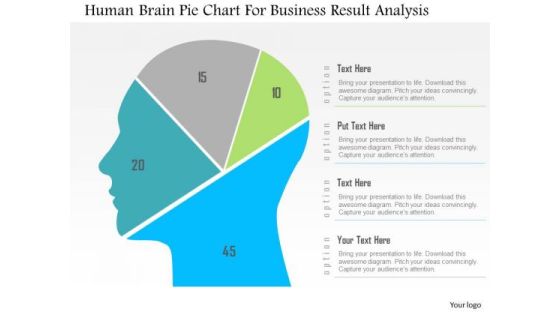
Business Diagram Human Brain Pie Chart For Business Result Analysis PowerPoint Slide
This diagram displays human face graphic divided into sections. This section can be used for data display. Use this diagram to build professional presentations for your viewers.

Business Transformation Template Ppt PowerPoint Presentation Layouts Styles
This is a business transformation template ppt powerpoint presentation layouts styles. This is a three stage process. The stages in this process are reduce complexity, shared services, data management, sales marketing, improve execution.

Data And Analysis Ppt PowerPoint Presentation Portfolio Layouts
This is a data and analysis ppt powerpoint presentation portfolio layouts. This is a six stage process. The stages in this process are root cause analysis, opportunity analysis, timeline analysis, force field analysis, fmea analysis.

Comprehensive Analysis Of Different Data Lineage Classification Components Of Data Lineage Technology Portrait PDF
This slide represents the components of data lineage technology, including IT systems, data elements, business processes, data checks and controls, information and reports. The IT systems include databases, customer relationship management, Enterprise resource planning, and dashboards. Present like a pro with Comprehensive Analysis Of Different Data Lineage Classification Components Of Data Lineage Technology Portrait PDF Create beautiful presentations together with your team, using our easy to use presentation slides. Share your ideas in real time and make changes on the fly by downloading our templates. So whether you are in the office, on the go, or in a remote location, you can stay in sync with your team and present your ideas with confidence. With Slidegeeks presentation got a whole lot easier. Grab these presentations today.

Investment Management Diagram Powerpoint Templates
This is a investment management diagram powerpoint templates. This is a seven stage process. The stages in this process are understanding, execution, risk control, performance reporting, meeting, analysis, assessment.

Business Process Management Lifecycle Diagram Powerpoint Slides Deck
This is a business process management lifecycle diagram powerpoint slides deck. This is a seven stage process. The stages in this process are business process management lifecycle, design, reporting and analytics, technology, monitoring, execution, optimization, quality monitoring.

Break Even Analysis Ppt PowerPoint Presentation Portfolio Clipart
This is a break even analysis ppt powerpoint presentation portfolio clipart. This is a five stage process. The stages in this process are fixed cost, variable cost, sales revenue, profit, key comments on the table, units of output.

Break Even Analysis Ppt PowerPoint Presentation Styles Template
This is a break even analysis ppt powerpoint presentation styles template. This is a five stage process. The stages in this process are fixed cost, variable cost, key comments on the table, units of output, business.

Business Diagram 3d Colorful Pie Graph With Magnifier Data Search PowerPoint Slide
This business slide displays 3d colorful pie graph with magnifier. This diagram is a data visualization tool that gives you a simple way to present statistical information. This slide helps your audience examine and interpret the data you present.

Business Diagram Data Driven Pie Chart Inside The Magnifier PowerPoint Slide
This business slide displays 3d colorful pie graph with magnifier. This diagram is a data visualization tool that gives you a simple way to present statistical information. This slide helps your audience examine and interpret the data you present.

User Big Data Input Analytics Designs PDF
Showcasing this set of slides titled user big data input analytics designs pdf. The topics addressed in these templates are analytical data store, data packet processing, stream processing. All the content presented in this PPT design is completely editable. Download it and make adjustments in color, background, font etc. as per your unique business setting.

Process Methodology Five Steps Ppt PowerPoint Presentation Layouts Grid
This is a process methodology five steps ppt powerpoint presentation layouts grid. This is a five stage process. The stages in this process are prepare, design, execute, manage monitor and report, discover, classify and audit.

Strong Service Culture Diagram Powerpoint Slides
This is a strong service culture diagram powerpoint slides. This is a six stage process. The stages in this process are employees, government, systems and processes, analyzing, executing, reporting.

Project Management And Accounting Example Of Ppt
This is a project management and accounting example of Ppt. This is a six stage process. The stages in this process are analyze and report, business development, service management, project execution, labor management, project management.
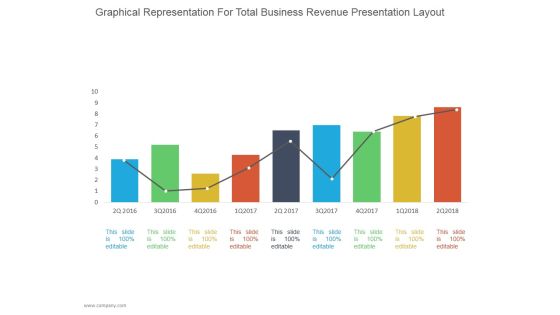
Graphical Representation For Total Business Revenue Ppt PowerPoint Presentation Diagrams
This is a graphical representation for total business revenue ppt powerpoint presentation diagrams. This is a nine stage process. The stages in this process are business, strategy, line chart, bar graph, marketing, management.
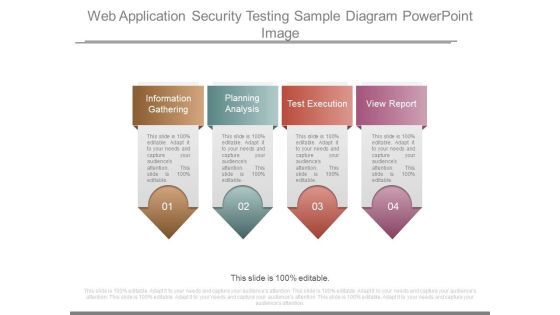
Web Application Security Testing Sample Diagram Powerpoint Image
This is a web application security testing sample diagram powerpoint image. This is a four stage process. The stages in this process are information gathering, planning analysis, test execution, view report.

Competitive Analysis Matrix Ppt PowerPoint Presentation Model Deck
This is a competitive analysis matrix ppt powerpoint presentation model deck. This is a six stage process. The stages in this process are new organization, table, business, marketing, strategy.

Business And Financial Analysis Ppt PowerPoint Presentation Layouts Portrait
This is a business and financial analysis ppt powerpoint presentation layouts portrait. This is a three stage process. The stages in this process are equipment, land cost, interior cost, employee cost, marketing cost.

Balanced Scorecard Best Practices Diagram Example Of Ppt Presentation
This is a balanced scorecard best practices diagram example of ppt presentation. This is a five stage process. The stages in this process are better strategic alignment, better strategic planning, improved communication and execution, better management information, improved performance reporting.

Automating Process Diagram Example Of Ppt
This is a automating process diagram example of ppt. This is a five stage process. The stages in this process are manage and control, capture data, define scope of automation, test tools selection, test execution.

Product Wise Pipeline Analysis Ppt PowerPoint Presentation Professional Files
This is a our goal ppt powerpoint presentation slides files. This is a four stage process. The stages in this process are business, marketing, strategy, planning, icons.

Sample For Strategic Plan Review Ppt Slides
This is a sample for strategic plan review ppt slides. This is a five stage process. The stages in this process are predictions, experiments, data collection, pattern recognition, effective execution.

Business Tactical And Strategic Analysis For Profitability Growth Icon Pictures PDF
Presenting Business Tactical And Strategic Analysis For Profitability Growth Icon Pictures PDF to dispense important information. This template comprises three stages. It also presents valuable insights into the topics including Business Tactical, Analysis, Profitability Growth, Icon. This is a completely customizable PowerPoint theme that can be put to use immediately. So, download it and address the topic impactfully.

COVID Impact Analysis On Economy Inflation Rate Ppt Portfolio Slide PDF
Presenting COVID Impact Analysis On Economy Inflation Rate Ppt Portfolio Slide PDF to dispense important information. This template comprises one stages. It also presents valuable insights into the topics including COVID Impact Analysis, Economy Inflation Rate. This is a completely customizable PowerPoint theme that can be put to use immediately. So, download it and address the topic impactfully.

Customer Oriented Sample Ppt PowerPoint Presentation Graphics
This is a customer oriented sample ppt powerpoint presentation graphics. This is a two stage process. The stages in this process are business, marketing, big data, strategy, success, management.

Big Data Analytics Procedure For Management Accounting Formats PDF
This slide illustrate big data analysis process for management accounting to generate financial reports for decision making. It includes elements such as cost accounting balance scorecards, performance measurement etc. Showcasing this set of slides titled Big Data Analytics Procedure For Management Accounting Formats PDF. The topics addressed in these templates are Accounting, Internal Data, Social Media. All the content presented in this PPT design is completely editable. Download it and make adjustments in color, background, font etc. as per your unique business setting.

Mobile Relationship Management Diagram Presentation Powerpoint Templates
This is a mobile relationship management diagram presentation powerpoint templates. This is a four stage process. The stages in this process are strategy, execution, data, transaction, engagement, awareness, loyalty.

Data Assimilation Your Title Here Metrics Ppt Icon Skills PDF
This is a data assimilation your title here metrics ppt icon skills pdf template with various stages. Focus and dispense information on two stages using this creative set, that comes with editable features. It contains large content boxes to add your information on topics like kpi metrics, kpi dashboards. You can also showcase facts, figures, and other relevant content using this PPT layout. Grab it now.

Comprehensive Analysis Of Different Data Lineage Classification Typical Use Cases Of Data Lineage Themes PDF
This slide outlines the typical use cases of data lineage that include performing root cause analysis, generating reports, deprecating columns, and setting data retention policies. Data lineage enables a broad range of information use applications for IT departments and various stakeholder groups. Make sure to capture your audiences attention in your business displays with our gratis customizable Comprehensive Analysis Of Different Data Lineage Classification Typical Use Cases Of Data Lineage Themes PDF. These are great for business strategies, office conferences, capital raising or task suggestions. If you desire to acquire more customers for your tech business and ensure they stay satisfied, create your own sales presentation with these plain slides.

