AI PPT Maker
Templates
PPT Bundles
Design Services
Business PPTs
Business Plan
Management
Strategy
Introduction PPT
Roadmap
Self Introduction
Timelines
Process
Marketing
Agenda
Technology
Medical
Startup Business Plan
Cyber Security
Dashboards
SWOT
Proposals
Education
Pitch Deck
Digital Marketing
KPIs
Project Management
Product Management
Artificial Intelligence
Target Market
Communication
Supply Chain
Google Slides
Research Services
 One Pagers
All Categories
-
Home
- Customer Favorites
- Executive Dashboard
Executive Dashboard

Innovative Technologies For Improving Economic Functions Ppt PowerPoint Presentation File Graphics Example PDF
This slide showcase key digital technologies for improving financials functions. It includes major steps such as-Make user friendly dashboards for internal customer demands, Develop predictive models for every warning etc. Persuade your audience using this innovative technologies for improving economic functions ppt powerpoint presentation file graphics example pdf. This PPT design covers four stages, thus making it a great tool to use. It also caters to a variety of topics including automation and robotics, data visualization, advanced analytics for finance. Download this PPT design now to present a convincing pitch that not only emphasizes the topic but also showcases your presentation skills.

BPM System Methodology Three Levels Of Business Processes In Organization Diagrams PDF
This slide covers different levels in an organization that involves multiple business operations. It includes levels in business processes such as aiming, directing, organizing, tracking process performance, developing dashboards and identifying improvement opportunities. If your project calls for a presentation, then Slidegeeks is your go-to partner because we have professionally designed, easy-to-edit templates that are perfect for any presentation. After downloading, you can easily edit BPM System Methodology Three Levels Of Business Processes In Organization Diagrams PDF and make the changes accordingly. You can rearrange slides or fill them with different images. Check out all the handy templates

30 60 90 Days Plan For Creating Data Stewardship Program Infographics PDF
This slide depicts the 30-60-90 days plan for creating a data stewardship program for the organization. It includes defining goals and achievement measures, analyzing the current situation and gap analysis, obtaining stakeholders approval, making and executing the plan, and maintaining and monitoring. Find a pre designed and impeccable 30 60 90 Days Plan For Creating Data Stewardship Program Infographics PDF. The templates can ace your presentation without additional effort. You can download these easy to edit presentation templates to make your presentation stand out from others. So, what are you waiting for Download the template from Slidegeeks today and give a unique touch to your presentation.

Challenges And Solutions In Consumer Loyalty Program Implementation Inspiration PDF
The following slide highlights the major issues and their solutions in executing customer loyalty program to optimize actions for future. It includes elements such as technology integration, lack of data insights, customizations problems etc. Showcasing this set of slides titled Challenges And Solutions In Consumer Loyalty Program Implementation Inspiration PDF. The topics addressed in these templates are Technology Integration, Lack Data Insights, Program Customization Issues. All the content presented in this PPT design is completely editable. Download it and make adjustments in color, background, font etc. as per your unique business setting.

Checklist For Conducting Target Market Assessment Graphics PDF
This slide covers the checklist for executing the process of target market research. It includes tasks such as creating a buyer persona, asking the audience about their interests, collecting data about the audience, leveraging social media analytics, etc. Persuade your audience using this Checklist For Conducting Target Market Assessment Graphics PDF. This PPT design covers eleven stages, thus making it a great tool to use. It also caters to a variety of topics including Social Media, Google Analytics, Purchase Behaviours. Download this PPT design now to present a convincing pitch that not only emphasizes the topic but also showcases your presentation skills.
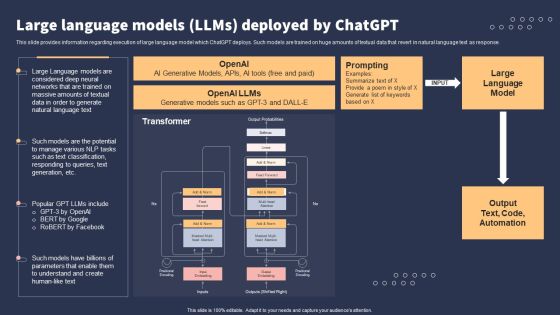
Top 10 Revolutionary Solutions For Everything Large Language Models Llms Deployed By Chatgpt Template PDF
This slide provides information regarding execution of large language model which ChatGPT deploys. Such models are trained on huge amounts of textual data that revert in natural language text as response. The best PPT templates are a great way to save time, energy, and resources. Slidegeeks have 100 percent editable powerpoint slides making them incredibly versatile. With these quality presentation templates, you can create a captivating and memorable presentation by combining visually appealing slides and effectively communicating your message. Download Top 10 Revolutionary Solutions For Everything Large Language Models Llms Deployed By Chatgpt Template PDF from Slidegeeks and deliver a wonderful presentation.

Business Reporting And Analysis Template Ppt Design
This is a business reporting and analysis template ppt design. This is a three stage process. The stages in this process are business reporting and analysis template, operations, executive, sales, value, services, analysis, reporting, decision, data, pull.

Supplier Association Management Techniques Supplier Relationship Management Roles Slides PDF
This slide covers SRM element people skills covering employees roles an responsibilities such as maintaining strategy, implement project, manage contract, operate solutions ect. This is a supplier association management techniques supplier performance management kpi dashboards guidelines pdf template with various stages. Focus and dispense information on six stages using this creative set, that comes with editable features. It contains large content boxes to add your information on topics like reduction in costs, increased efficiency, increase in profitability. You can also showcase facts, figures, and other relevant content using this PPT layout. Grab it now.
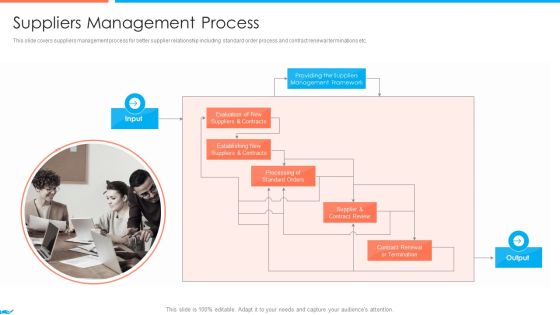
Supplier Association Management Techniques Suppliers Management Process Introduction PDF
This slide covers suppliers management process for better supplier relationship including standard order process and contract renewal terminations etc. This is a supplier association management techniques supplier performance management kpi dashboards guidelines pdf template with various stages. Focus and dispense information on two stages using this creative set, that comes with editable features. It contains large content boxes to add your information on topics like transactional level, review of performance, strategic alliance. You can also showcase facts, figures, and other relevant content using this PPT layout. Grab it now.

SAC Planning And Implementation Reporting Capabilities Of SAP Analytics Cloud Mockup PDF
The following slide illustrates the reporting capabilities of SAP Analytics Cloud such as storyboards, formatted reports, dashboards and applications. The comparison parameters for report are development time, level of detail, number of data sources and visualization used. Deliver an awe inspiring pitch with this creative SAC Planning And Implementation Reporting Capabilities Of SAP Analytics Cloud Mockup PDF bundle. Topics like Report Focus, Report Purpose, Development Time can be discussed with this completely editable template. It is available for immediate download depending on the needs and requirements of the user.

Business Intelligence And Big Key Features Of Data Analytics Software Guidelines PDF
This slide shows broad range of data analytics features that help businesses to draw data driven decision. It includes features such as collaboration, data cleaning, Data governance and many more. This is a business intelligence and big key features of data analytics software guidelines pdf template with various stages. Focus and dispense information on ten stages using this creative set, that comes with editable features. It contains large content boxes to add your information on topics like collaboration, data blends, data cleansing, data visualization, high volume processing, dashboards templates. You can also showcase facts, figures, and other relevant content using this PPT layout. Grab it now.
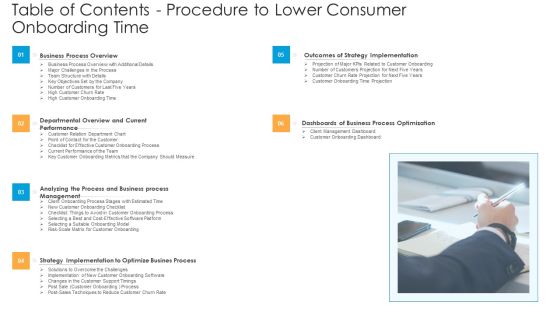
Table Of Contents Procedure To Lower Consumer Onboarding Time Ppt Infographics Example Topics PDF
Presenting table of contents procedure to lower consumer onboarding time ppt infographics example topics pdf. to provide visual cues and insights. Share and navigate important information on six stages that need your due attention. This template can be used to pitch topics like outcomes of strategy implementation, business process overview, departmental overview and current performance, analyzing the process and business process management, dashboards of business process optimization. In addtion, this PPT design contains high resolution images, graphics, etc, that are easily editable and available for immediate download.

Supplier Association Management Techniques Supplier Rating Scorecard Template Criteria Mockup PDF
This slide covers the supplier rating scorecard including criteria such as quality, service, delivery and price along with self evaluation and internal evaluation scores. This is a supplier association management techniques supplier performance management kpi dashboards guidelines pdf template with various stages. Focus and dispense information on three stages using this creative set, that comes with editable features. It contains large content boxes to add your information on topics like reduction in costs, increased efficiency, increase in profitability. You can also showcase facts, figures, and other relevant content using this PPT layout. Grab it now.
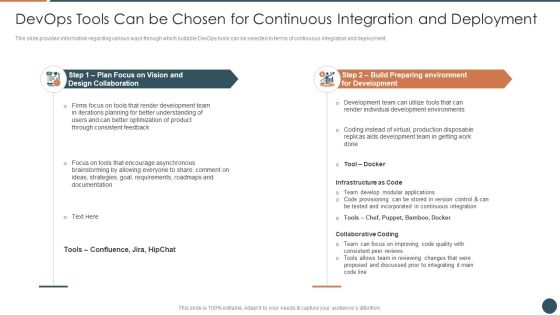
Devops Tools Can Be Chosen For Continuous Integration And Deployment Portrait PDF
This slide provides information regarding various ways through which suitable DevOps tools can be selected in terms of continuous integration and deployment. This is a devops tools can be chosen for continuous integration and deployment portrait pdf template with various stages. Focus and dispense information on two stages using this creative set, that comes with editable features. It contains large content boxes to add your information on topics like continuous integration, deployment, release dashboards . You can also showcase facts, figures, and other relevant content using this PPT layout. Grab it now.

Tools For Prioritization Table Of Contents Ppt PowerPoint Presentation Inspiration Example PDF
Presenting tools for prioritization table of contents ppt powerpoint presentation inspiration example pdf to provide visual cues and insights. Share and navigate important information on one stages that need your due attention. This template can be used to pitch topics like business performance overview, major challenges faced firm, prioritization tools, project management, deal management tools, workflow management tools, time management tools, training and budget, dashboards to measure impact. In addition, this PPT design contains high-resolution images, graphics, etc, that are easily editable and available for immediate download.

Agile Project Development Delivery Strategy With Project Status Slides PDF
This slide contains the information related to the sprints that are made for the agile software delivery plan . It also includes the work status of every sprint with due date, owner and the tasks. Pitch your topic with ease and precision using this Agile Project Development Delivery Strategy With Project Status Slides PDF. This layout presents information on Mapping Requirements, Designing Features, Dashboards Charts. It is also available for immediate download and adjustment. So, changes can be made in the color, design, graphics or any other component to create a unique layout.

Salesforce Platform Facts AND Figures Salesforce Business Profile Graphics PDF
This slide highlights the salesforce platform statistics of one day which includes the data of tableau public views, commerce orders, service and case interactions, reports and dashboards and sales opportunities created. Presenting Salesforce Platform Facts AND Figures Salesforce Business Profile Graphics PDF to provide visual cues and insights. Share and navigate important information on three stages that need your due attention. This template can be used to pitch topics like Platform Scale, Consumer Scale, Employee Scale. In addtion, this PPT design contains high resolution images, graphics, etc, that are easily editable and available for immediate download.
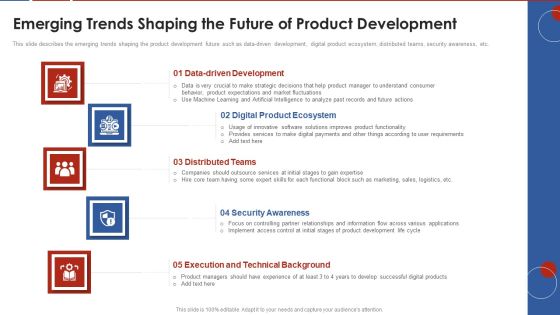
Formulating Product Development Action Plan To Enhance Client Experience Emerging Trends Shaping Infographics PDF
This slide describes the emerging trends shaping the product development future such as data-driven development, digital product ecosystem, distributed teams, security awareness, etc. This is a formulating product development action plan to enhance client experience emerging trends shaping infographics pdf template with various stages. Focus and dispense information on five stages using this creative set, that comes with editable features. It contains large content boxes to add your information on topics like data driven development, digital product ecosystem, distributed teams, security awareness, execution and technical background. You can also showcase facts, figures, and other relevant content using this PPT layout. Grab it now.

Enterprise Architecture Framework For Core IT Ppt PowerPoint Presentation Gallery Deck PDF
Following slide exhibits Busies capability model for core IT development. It includes multiple components such as- direct execution of competitive edge, data center and network management and so on. Persuade your audience using this enterprise architecture framework for core it ppt powerpoint presentation gallery deck pdf. This PPT design covers one stages, thus making it a great tool to use. It also caters to a variety of topics including strategy, management, planning. Download this PPT design now to present a convincing pitch that not only emphasizes the topic but also showcases your presentation skills.

Half Yearly Product KPI Roadmap With Various Work Flows Brochure PDF
We present our half yearly product kpi roadmap with various work flows brochure pdf. This PowerPoint layout is easy-to-edit so you can change the font size, font type, color, and shape conveniently. In addition to this, the PowerPoint layout is Google Slides compatible, so you can share it with your audience and give them access to edit it. Therefore, download and save this well-researched half yearly product kpi roadmap with various work flows brochure pdf in different formats like PDF, PNG, and JPG to smoothly execute your business plan.

Devops For Information Technology Why Is Devops Used Summary PDF
This slide covers the reasons why devOps is being used in the organization such as DevOps encourages Integrated Deployment and Continuous Execution to be applied by Agile Growth Teams etc. This is a devops for information technology why is devops used summary pdf template with various stages. Focus and dispense information on nine stages using this creative set, that comes with editable features. It contains large content boxes to add your information on topics like development, operational, infrastructure. You can also showcase facts, figures, and other relevant content using this PPT layout. Grab it now.
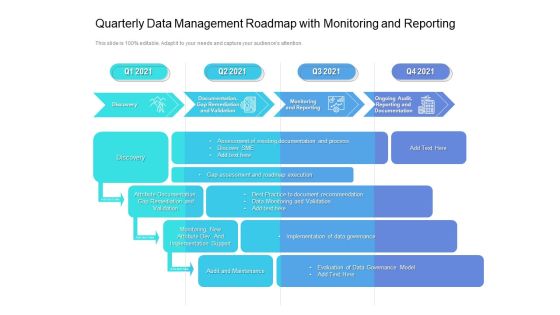
Quarterly Data Management Roadmap With Monitoring And Reporting Infographics
We present our quarterly data management roadmap with monitoring and reporting infographics. This PowerPoint layout is easy-to-edit so you can change the font size, font type, color, and shape conveniently. In addition to this, the PowerPoint layout is Google Slides compatible, so you can share it with your audience and give them access to edit it. Therefore, download and save this well-researched quarterly data management roadmap with monitoring and reporting infographics in different formats like PDF, PNG, and JPG to smoothly execute your business plan.

Toolkit For Data Science And Analytics Transition RACI Matrix For Analyzing Data In Project Diagrams PDF
The slide explains the RACI Matrix with the roles on vertical axis and tasks on horizontal axis for executing data analytics project. Explore a selection of the finest Toolkit For Data Science And Analytics Transition RACI Matrix For Analyzing Data In Project Diagrams PDF here. With a plethora of professionally designed and pre made slide templates, you can quickly and easily find the right one for your upcoming presentation. You can use our Toolkit For Data Science And Analytics Transition RACI Matrix For Analyzing Data In Project Diagrams PDF to effectively convey your message to a wider audience. Slidegeeks has done a lot of research before preparing these presentation templates. The content can be personalized and the slides are highly editable. Grab templates today from Slidegeeks.
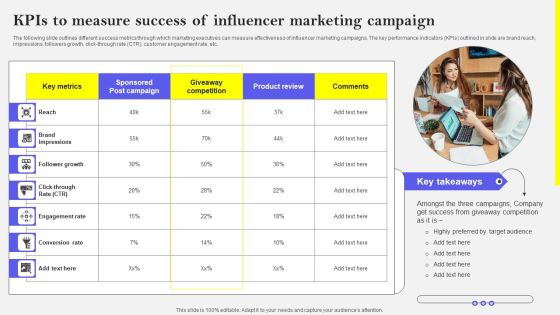
Kpis To Measure Success Of Influencer Marketing Campaign Formats PDF
The following slide outlines different success metrics through which marketing executives can measure effectiveness of influencer marketing campaigns. The key performance indicators KPIs outlined in slide are brand reach, impressions, followers growth, click-through rate CTR, customer engagement rate, etc. The best PPT templates are a great way to save time, energy, and resources. Slidegeeks have 100 percent editable powerpoint slides making them incredibly versatile. With these quality presentation templates, you can create a captivating and memorable presentation by combining visually appealing slides and effectively communicating your message. Download Kpis To Measure Success Of Influencer Marketing Campaign Formats PDF from Slidegeeks and deliver a wonderful presentation.

3 Months Business Analytics Roadmap With Data Analytics Structure
We present our 3 months business analytics roadmap with data analytics structure. This PowerPoint layout is easy-to-edit so you can change the font size, font type, color, and shape conveniently. In addition to this, the PowerPoint layout is Google Slides compatible, so you can share it with your audience and give them access to edit it. Therefore, download and save this well-researched 3 months business analytics roadmap with data analytics structure in different formats like PDF, PNG, and JPG to smoothly execute your business plan.

5 Year Business Analytics Roadmap With Data Analytics Sample
We present our 5 year business analytics roadmap with data analytics sample. This PowerPoint layout is easy-to-edit so you can change the font size, font type, color, and shape conveniently. In addition to this, the PowerPoint layout is Google Slides compatible, so you can share it with your audience and give them access to edit it. Therefore, download and save this well-researched 5 year business analytics roadmap with data analytics sample in different formats like PDF, PNG, and JPG to smoothly execute your business plan.

6 Months Business Analytics Roadmap With Data Analytics Brochure
We present our 6 months business analytics roadmap with data analytics brochure. This PowerPoint layout is easy-to-edit so you can change the font size, font type, color, and shape conveniently. In addition to this, the PowerPoint layout is Google Slides compatible, so you can share it with your audience and give them access to edit it. Therefore, download and save this well-researched 6 months business analytics roadmap with data analytics brochure in different formats like PDF, PNG, and JPG to smoothly execute your business plan.

Business Reporting And Analysis Presentation Deck
This is a business reporting and analysis presentation deck. This is a five stage process. The stages in this process are business, executive, operations, sales, finance, services.

Analytics Organization Five Years Roadmap For Big Data Implementation Portrait
We present our analytics organization five years roadmap for big data implementation portrait. This PowerPoint layout is easy to edit so you can change the font size, font type, color, and shape conveniently. In addition to this, the PowerPoint layout is Google Slides compatible, so you can share it with your audience and give them access to edit it. Therefore, download and save this well researched analytics organization five years roadmap for big data implementation portrait in different formats like PDF, PNG, and JPG to smoothly execute your business plan.
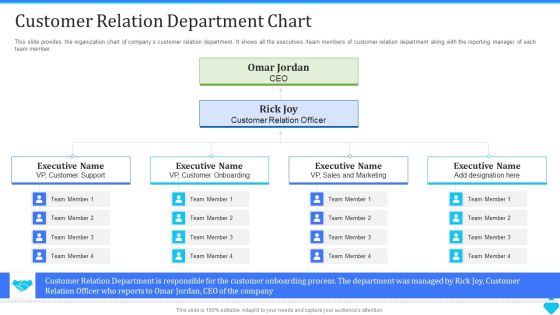
User Onboarding Process Development Customer Relation Department Chart Microsoft PDF
This slide provides the organization chart of companys customer relation department. It shows all the executives team members of customer relation department along with the reporting manager of each team member. This is a user onboarding process development customer relation department chart microsoft pdf template with various stages. Focus and dispense information on seven stages using this creative set, that comes with editable features. It contains large content boxes to add your information on topics like sales and marketing, customer onboarding, customer support. You can also showcase facts, figures, and other relevant content using this PPT layout. Grab it now.

Data Strategy Governance And Analytics Five Year Roadmap Portrait
We present our data strategy governance and analytics five year roadmap portrait. This PowerPoint layout is easy to edit so you can change the font size, font type, color, and shape conveniently. In addition to this, the PowerPoint layout is Google Slides compatible, so you can share it with your audience and give them access to edit it. Therefore, download and save this well researched data strategy governance and analytics five year roadmap portrait in different formats like PDF, PNG, and JPG to smoothly execute your business plan.
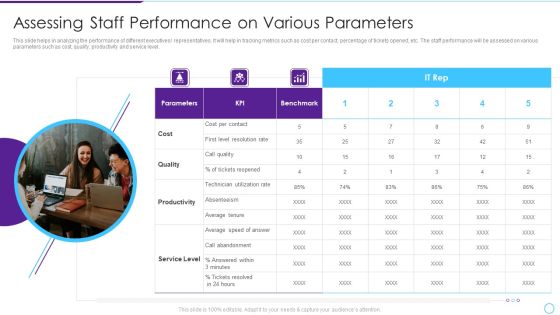
Intelligent Infrastructure Assessing Staff Performance On Various Parameters Summary PDF
This slide helps in analyzing the performance of different executives or representatives. It will help in tracking metrics such as cost per contact, percentage of tickets opened, etc. The staff performance will be assessed on various parameters such as cost, quality, productivity and service level. This is a Intelligent Infrastructure Assessing Staff Performance On Various Parameters Summary PDF template with various stages. Focus and dispense information on three stages using this creative set, that comes with editable features. It contains large content boxes to add your information on topics like Parameters, Cost, KPI, Productivity, Service Level. You can also showcase facts, figures, and other relevant content using this PPT layout. Grab it now.
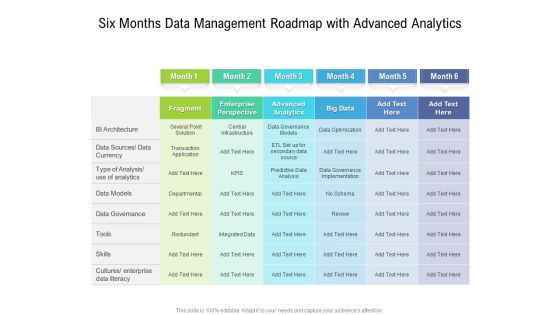
Six Months Data Management Roadmap With Advanced Analytics Information
We present our six months data management roadmap with advanced analytics information. This PowerPoint layout is easy-to-edit so you can change the font size, font type, color, and shape conveniently. In addition to this, the PowerPoint layout is Google Slides compatible, so you can share it with your audience and give them access to edit it. Therefore, download and save this well-researched six months data management roadmap with advanced analytics information in different formats like PDF, PNG, and JPG to smoothly execute your business plan.

Data Strategy And Analytics Five Years Action Plan Roadmap Graphics
We present our data strategy and analytics five years action plan roadmap graphics. This PowerPoint layout is easy to edit so you can change the font size, font type, color, and shape conveniently. In addition to this, the PowerPoint layout is Google Slides compatible, so you can share it with your audience and give them access to edit it. Therefore, download and save this well researched data strategy and analytics five years action plan roadmap graphics in different formats like PDF, PNG, and JPG to smoothly execute your business plan.

Defining Key Metrics To Analyse Current Sales Performance Background PDF
The following slide showcases some metrics to evaluate existing sales performance due to execute effective risk management strategies. It includes elements such as opportunities, win rate, average time to win, average value per win, sales velocity etc. Want to ace your presentation in front of a live audience Our Defining Key Metrics To Analyse Current Sales Performance Background PDF can help you do that by engaging all the users towards you. Slidegeeks experts have put their efforts and expertise into creating these impeccable powerpoint presentations so that you can communicate your ideas clearly. Moreover, all the templates are customizable, and easy to edit and downloadable. Use these for both personal and commercial use.
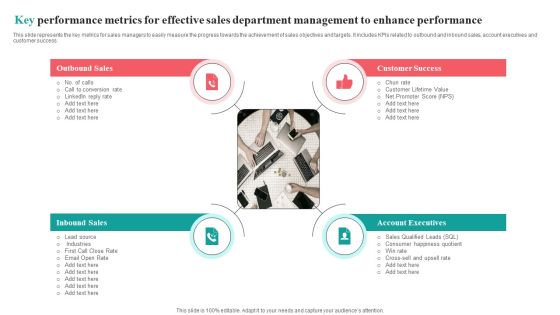
Key Performance Metrics For Effective Sales Department Management To Enhance Performance Introduction PDF
This slide represents the key metrics for sales managers to easily measure the progress towards the achievement of sales objectives and targets. It includes KPIs related to outbound and inbound sales, account executives and customer success.Presenting Key Performance Metrics For Effective Sales Department Management To Enhance Performance Introduction PDF to dispense important information. This template comprises four stages. It also presents valuable insights into the topics including Consumer Happiness, Customer Lifetime, Outbound Sales. This is a completely customizable PowerPoint theme that can be put to use immediately. So, download it and address the topic impactfully.
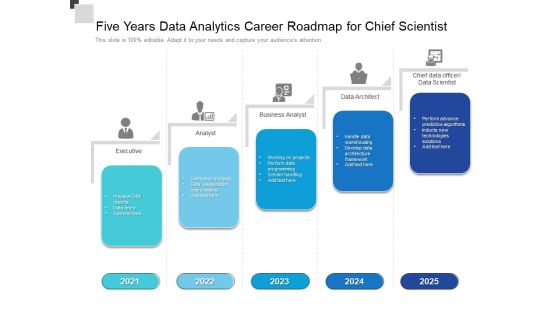
Five Years Data Analytics Career Roadmap For Chief Scientist Microsoft
We present our five years data analytics career roadmap for chief scientist microsoft. This PowerPoint layout is easy-to-edit so you can change the font size, font type, color, and shape conveniently. In addition to this, the PowerPoint layout is Google Slides compatible, so you can share it with your audience and give them access to edit it. Therefore, download and save this well-researched five years data analytics career roadmap for chief scientist microsoft in different formats like PDF, PNG, and JPG to smoothly execute your business plan.

Half Yearly Data Analytics Career Roadmap For Chief Scientist Download
We present our half yearly data analytics career roadmap for chief scientist download. This PowerPoint layout is easy-to-edit so you can change the font size, font type, color, and shape conveniently. In addition to this, the PowerPoint layout is Google Slides compatible, so you can share it with your audience and give them access to edit it. Therefore, download and save this well-researched half yearly data analytics career roadmap for chief scientist download in different formats like PDF, PNG, and JPG to smoothly execute your business plan.
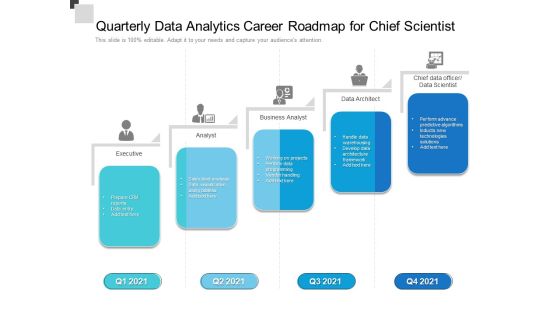
Quarterly Data Analytics Career Roadmap For Chief Scientist Infographics
We present our quarterly data analytics career roadmap for chief scientist infographics. This PowerPoint layout is easy-to-edit so you can change the font size, font type, color, and shape conveniently. In addition to this, the PowerPoint layout is Google Slides compatible, so you can share it with your audience and give them access to edit it. Therefore, download and save this well-researched quarterly data analytics career roadmap for chief scientist infographics in different formats like PDF, PNG, and JPG to smoothly execute your business plan.
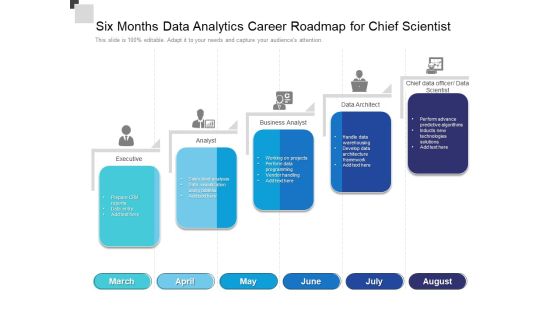
Six Months Data Analytics Career Roadmap For Chief Scientist Portrait
We present our six months data analytics career roadmap for chief scientist portrait. This PowerPoint layout is easy-to-edit so you can change the font size, font type, color, and shape conveniently. In addition to this, the PowerPoint layout is Google Slides compatible, so you can share it with your audience and give them access to edit it. Therefore, download and save this well-researched six months data analytics career roadmap for chief scientist portrait in different formats like PDF, PNG, and JPG to smoothly execute your business plan.

Three Months Data Analytics Career Roadmap For Chief Scientist Graphics
We present our three months data analytics career roadmap for chief scientist graphics. This PowerPoint layout is easy-to-edit so you can change the font size, font type, color, and shape conveniently. In addition to this, the PowerPoint layout is Google Slides compatible, so you can share it with your audience and give them access to edit it. Therefore, download and save this well-researched three months data analytics career roadmap for chief scientist graphics in different formats like PDF, PNG, and JPG to smoothly execute your business plan.
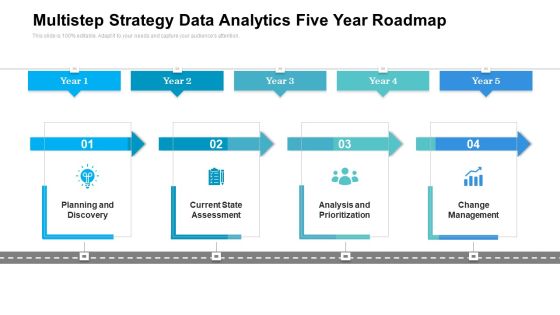
Multistep Strategy Data Analytics Five Year Roadmap Demonstration
We present our multistep strategy data analytics five year roadmap demonstration. This PowerPoint layout is easy to edit so you can change the font size, font type, color, and shape conveniently. In addition to this, the PowerPoint layout is Google Slides compatible, so you can share it with your audience and give them access to edit it. Therefore, download and save this well researched multistep strategy data analytics five year roadmap demonstration in different formats like PDF, PNG, and JPG to smoothly execute your business plan.

Aligning Strategies With Healthcare Equipment Sale Market Trends Summary PDF
This slide shows strategies that can be used in medical device sales field to cop with changes due to dynamic market trends. It include strategies such as connect with modern trends, align with healthcare industry and prepare for political changes etc. Presenting Aligning Strategies With Healthcare Equipment Sale Market Trends Summary PDF to dispense important information. This template comprises four stages. It also presents valuable insights into the topics including Execute Quality, Connect Product Recent Trends, Prepare Political Environmental. This is a completely customizable PowerPoint theme that can be put to use immediately. So, download it and address the topic impactfully.
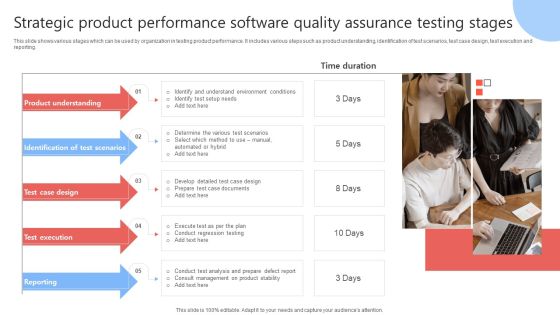
Strategic Product Performance Software Quality Assurance Testing Stages Infographics PDF
This slide shows various stages which can be used by organization in testing product performance. It includes various steps such as product understanding, identification of test scenarios, test case design, test execution and reporting. Presenting Strategic Product Performance Software Quality Assurance Testing Stages Infographics PDF to dispense important information. This template comprises five stages. It also presents valuable insights into the topics including Product Understanding, Identification Test Scenarios, Test Case Design. This is a completely customizable PowerPoint theme that can be put to use immediately. So, download it and address the topic impactfully.
Effective Email Advertising Report Monthly Summary Infographics PDF
Following slides provide a summary of the performance of several business strategies in a particular month. This report includes strategies executed this month, organizational email marketing targets, and targets achieved. Presenting Effective Email Advertising Report Monthly Summary Infographics PDF to dispense important information. This template comprises three stages. It also presents valuable insights into the topics including Marketing Targets, Organizational Email, Targets Achieved. This is a completely customizable PowerPoint theme that can be put to use immediately. So, download it and address the topic impactfully.

Data Lineage Implementation Working Process Of Data Lineage System Designs PDF
This slide talks about the working process of the data lineage system, from metadata to final reports or dashboards for non-technical end users. The components include metadata, process, database systems and reports. This Data Lineage Implementation Working Process Of Data Lineage System Designs PDF is perfect for any presentation, be it in front of clients or colleagues. It is a versatile and stylish solution for organizing your meetings. The Data Lineage Implementation Working Process Of Data Lineage System Designs PDF features a modern design for your presentation meetings. The adjustable and customizable slides provide unlimited possibilities for acing up your presentation. Slidegeeks has done all the homework before launching the product for you. So, do not wait, grab the presentation templates today

Online Marketing Strategy For Lead Generation Analyzing Impact Of Performance Marketing Campaigns Template PDF
This slide showcases impact of performance marketing campaigns which can help organization to evaluate the effectiveness of executed plan. Its key elements are website traffic and product sales. The Online Marketing Strategy For Lead Generation Analyzing Impact Of Performance Marketing Campaigns Template PDF is a compilation of the most recent design trends as a series of slides. It is suitable for any subject or industry presentation, containing attractive visuals and photo spots for businesses to clearly express their messages. This template contains a variety of slides for the user to input data, such as structures to contrast two elements, bullet points, and slides for written information. Slidegeeks is prepared to create an impression.
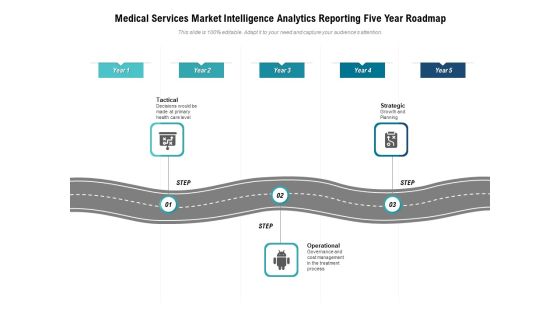
Medical Services Market Intelligence Analytics Reporting Five Year Roadmap Designs
We present our medical services market intelligence analytics reporting five year roadmap designs. This PowerPoint layout is easy to edit so you can change the font size, font type, color, and shape conveniently. In addition to this, the PowerPoint layout is Google Slides compatible, so you can share it with your audience and give them access to edit it. Therefore, download and save this well researched medical services market intelligence analytics reporting five year roadmap designs in different formats like PDF, PNG, and JPG to smoothly execute your business plan.

B2c Inbound Partnership Content Marketing Trends Ppt PowerPoint Presentation Gallery Show PDF
This slide illustrates the benefits gained by the brand partners in the B2C inbound marketing. It includes percentage change in the major quantifiers like sales cycle, lead conversion rate, sales executives achievement quota, attainment of team quota and marketing lead acceptance. Presenting b2c inbound partnership content marketing trends ppt powerpoint presentation gallery show pdf to dispense important information. This template comprises five stages. It also presents valuable insights into the topics including sales, marketing, growth. This is a completely customizable PowerPoint theme that can be put to use immediately. So, download it and address the topic impactfully.
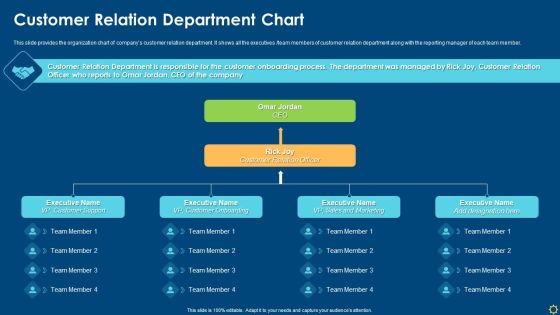
Improving Organizational Process Client Induction Procedure Customer Relation Department Chart Template PDF
This slide provides the organization chart of companys customer relation department. It shows all the executives team members of customer relation department along with the reporting manager of each team member. Presenting improving organizational process client induction procedure customer relation department chart template pdf to provide visual cues and insights. Share and navigate important information on four stages that need your due attention. This template can be used to pitch topics like customer onboarding, customer relation, sales and marketing. In addtion, this PPT design contains high resolution images, graphics, etc, that are easily editable and available for immediate download.

Medical Services Market Intelligence Reporting Model Five Year Roadmap Inspiration
We present our medical services market intelligence reporting model five year roadmap inspiration. This PowerPoint layout is easy to edit so you can change the font size, font type, color, and shape conveniently. In addition to this, the PowerPoint layout is Google Slides compatible, so you can share it with your audience and give them access to edit it. Therefore, download and save this well researched medical services market intelligence reporting model five year roadmap inspiration in different formats like PDF, PNG, and JPG to smoothly execute your business plan.

Medical Services Market Intelligence Reporting Process Five Year Roadmap Professional
We present our medical services market intelligence reporting process five year roadmap professional. This PowerPoint layout is easy to edit so you can change the font size, font type, color, and shape conveniently. In addition to this, the PowerPoint layout is Google Slides compatible, so you can share it with your audience and give them access to edit it. Therefore, download and save this well researched medical services market intelligence reporting process five year roadmap professional in different formats like PDF, PNG, and JPG to smoothly execute your business plan.

Communication Tech Adoption Action Plan With Key Channels Inspiration PDF
This slide shows sample technology execution communication plan for organization to digitally transform from traditional framework to online structure. It include sections such as timeline, action and target audience, etc. Showcasing this set of slides titled Communication Tech Adoption Action Plan With Key Channels Inspiration PDF. The topics addressed in these templates are Target Audience, Channel, Metric. All the content presented in this PPT design is completely editable. Download it and make adjustments in color, background, font etc. as per your unique business setting.
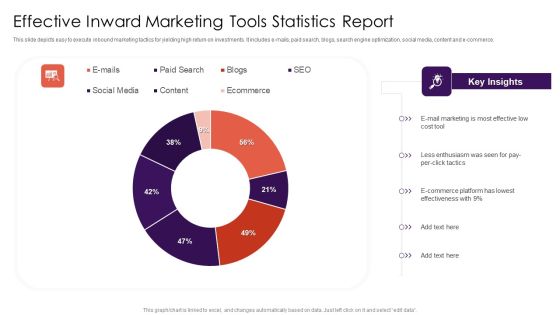
Effective Inward Marketing Tools Statistics Report Structure PDF
This slide depicts easy to execute inbound marketing tactics for yielding high return on investments. It includes e-mails, paid search, blogs, search engine optimization, social media, content and e-commerce.Showcasing this set of slides titled Effective Inward Marketing Tools Statistics Report Structure PDF. The topics addressed in these templates are E Commerce Platform, E Mail Marketing, Social Media. All the content presented in this PPT design is completely editable. Download it and make adjustments in color, background, font etc. as per your unique business setting.
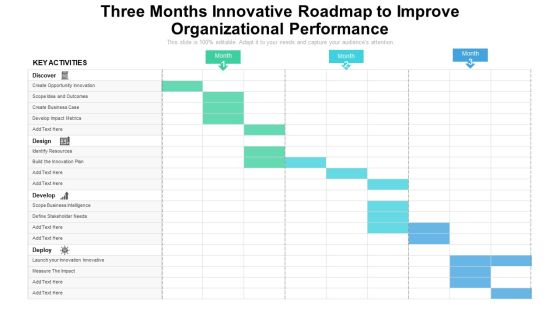
Three Months Innovative Roadmap To Improve Organizational Performance Infographics
We present our three months innovative roadmap to improve organizational performance infographics. This PowerPoint layout is easy to edit so you can change the font size, font type, color, and shape conveniently. In addition to this, the PowerPoint layout is Google Slides compatible, so you can share it with your audience and give them access to edit it. Therefore, download and save this well researched three months innovative roadmap to improve organizational performance infographics in different formats like PDF, PNG, and JPG to smoothly execute your business plan.

Human Resource Analytics Four Stages Of Business Intelligence Process Clipart PDF
This slide represents the procedure to help corporate executives and business managers to make better and informed business decisions. It includes four stages of business intelligence process such as identifying various data sources, data collection, data staging and cleansing and data visualizing. Make sure to capture your audiences attention in your business displays with our gratis customizable Human Resource Analytics Four Stages Of Business Intelligence Process Clipart PDF. These are great for business strategies, office conferences, capital raising or task suggestions. If you desire to acquire more customers for your tech business and ensure they stay satisfied, create your own sales presentation with these plain slides.

Information Technology Facilities Governance Measuring IT Staff Performance Ppt Infographic Template Graphics Download PDF
This slide helps in analyzing the performance of different IT executives representatives. It will help in tracking metrics such as cost per contact, percentage of tickets opened, etc. The staff performance will be assessed on various parameters such as cost, quality, productivity and service level. Deliver and pitch your topic in the best possible manner with this information technology facilities governance measuring IT staff performance ppt infographic template graphics download pdf. Use them to share invaluable insights on cost per contact, productivity, service level, technician, parameters and impress your audience. This template can be altered and modified as per your expectations. So, grab it now.
Email Advertising Report Quarter With Conversion Rate Designs PDF
This slide provides a quarterly report to track the performance of email marketing strategies executed every quarter. It includes key elements such as total emails sent, total emails delivered, targeted open rate, achieved open rate, conversion rate, etc. Showcasing this set of slides titled Email Advertising Report Quarter With Conversion Rate Designs PDF. The topics addressed in these templates are Email Advertising Report Quarter, Conversion Rate. All the content presented in this PPT design is completely editable. Download it and make adjustments in color, background, font etc. as per your unique business setting.

Implementing Marketing Mix Strategy To Enhance Overall Performance Identifying Key Team Members Summary PDF
The following slide helps the organization in identifying the key team members that can help the organization in successfully executing their marketing strategy, the following highlights the designation of the team members along with their names and reporting hierarchy. Deliver an awe inspiring pitch with this creative Implementing Marketing Mix Strategy To Enhance Overall Performance Identifying Key Team Members Summary PDF bundle. Topics like Web Development, Corporate Communication, Content Marketing can be discussed with this completely editable template. It is available for immediate download depending on the needs and requirements of the user.
Strategic Marketing Campaign Tracking Document Template PDF
This slide outlines report if tracking marketing campaigns aimed at coordinate planning of marketing activities to systematically execute planned strategies. It covers analysis of three campaigns based on key marketing metrics. Showcasing this set of slides titled Strategic Marketing Campaign Tracking Document Template PDF. The topics addressed in these templates are Conversion Rate, Bounce Rate, Engagement Rate . All the content presented in this PPT design is completely editable. Download it and make adjustments in color, background, font etc. as per your unique business setting.
