AI PPT Maker
Templates
PPT Bundles
Design Services
Business PPTs
Business Plan
Management
Strategy
Introduction PPT
Roadmap
Self Introduction
Timelines
Process
Marketing
Agenda
Technology
Medical
Startup Business Plan
Cyber Security
Dashboards
SWOT
Proposals
Education
Pitch Deck
Digital Marketing
KPIs
Project Management
Product Management
Artificial Intelligence
Target Market
Communication
Supply Chain
Google Slides
Research Services
 One Pagers
All Categories
-
Home
- Customer Favorites
- Executive Dashboard
Executive Dashboard

Workforce Diversity Dashboard Based On Gender And Ethnicity Distribution Sample PDF
This slide represents the diversity dashboard providing information regarding work force distribution on gender and ethnicity. It also includes details of year wise involuntary and voluntary turnover rates. Retrieve professionally designed Workforce Diversity Dashboard Based On Gender And Ethnicity Distribution Sample PDF to effectively convey your message and captivate your listeners. Save time by selecting pre made slideshows that are appropriate for various topics, from business to educational purposes. These themes come in many different styles, from creative to corporate, and all of them are easily adjustable and can be edited quickly. Access them as PowerPoint templates or as Google Slides themes. You do not have to go on a hunt for the perfect presentation because Slidegeeks got you covered from everywhere.
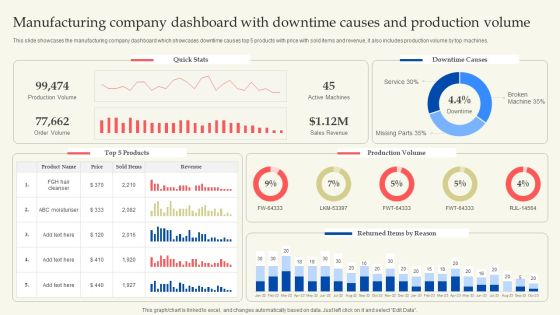
Manufacturing Company Dashboard With Downtime Causes And Production Volume Themes PDF
This slide showcases the manufacturing company dashboard which showcases downtime causes top 5 products with price with sold items and revenue, it also includes production volume by top machines. This Manufacturing Company Dashboard With Downtime Causes And Production Volume Themes PDF from Slidegeeks makes it easy to present information on your topic with precision. It provides customization options, so you can make changes to the colors, design, graphics, or any other component to create a unique layout. It is also available for immediate download, so you can begin using it right away. Slidegeeks has done good research to ensure that you have everything you need to make your presentation stand out. Make a name out there for a brilliant performance.
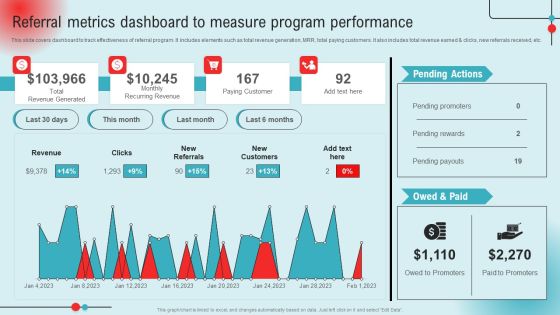
Referral Metrics Dashboard To Measure Program Performance Ppt PowerPoint Presentation Diagram Lists PDF
This slide covers dashboard to track effectiveness of referral program. It includes elements such as total revenue generation, MRR, total paying customers. It also includes total revenue earned and clicks, new referrals received, etc. This Referral Metrics Dashboard To Measure Program Performance Ppt PowerPoint Presentation Diagram Lists PDF from Slidegeeks makes it easy to present information on your topic with precision. It provides customization options, so you can make changes to the colors, design, graphics, or any other component to create a unique layout. It is also available for immediate download, so you can begin using it right away. Slidegeeks has done good research to ensure that you have everything you need to make your presentation stand out. Make a name out there for a brilliant performance.

Billing Software Dashboard To Track Company Performance Ppt PowerPoint Presentation File Professional PDF
Following slide shows billing software dashboard to track company financial performance. It includes elements such as average revenue, activity record of payments, invoice summary, income and expenditures. Slidegeeks is here to make your presentations a breeze with Billing Software Dashboard To Track Company Performance Ppt PowerPoint Presentation File Professional PDF With our easy to use and customizable templates, you can focus on delivering your ideas rather than worrying about formatting. With a variety of designs to choose from, you are sure to find one that suits your needs. And with animations and unique photos, illustrations, and fonts, you can make your presentation pop. So whether you are giving a sales pitch or presenting to the board, make sure to check out Slidegeeks first.

Deploying B2B Advertising Techniques For Lead Generation Kpi Dashboard To Assess Performance Marketing Demonstration PDF
This slide covers KPI dashboard to analyze performance of strategies for effective b2b lead generation. It involves details such as sales lead funnel, traffic sources and leads generated on monthly basis. Retrieve professionally designed Deploying B2B Advertising Techniques For Lead Generation Kpi Dashboard To Assess Performance Marketing Demonstration PDF to effectively convey your message and captivate your listeners. Save time by selecting pre made slideshows that are appropriate for various topics, from business to educational purposes. These themes come in many different styles, from creative to corporate, and all of them are easily adjustable and can be edited quickly. Access them as PowerPoint templates or as Google Slides themes. You do not have to go on a hunt for the perfect presentation because Slidegeeks got you covered from everywhere.

Deploying B2B Advertising Techniques For Lead Generation Social Media Marketing Kpi Dashboard Analyse Pictures PDF
This slide covers ecommerce marketing KPI dashboard to track performance. It involves details such as ecommerce revenue generated, number of new customers, repeat buying rate, attribute revenue and conversion rate and attributed revenue and conversion rate by marketing channel. Slidegeeks is here to make your presentations a breeze with Deploying B2B Advertising Techniques For Lead Generation Social Media Marketing Kpi Dashboard Analyse Pictures PDF With our easy to use and customizable templates, you can focus on delivering your ideas rather than worrying about formatting. With a variety of designs to choose from, you are sure to find one that suits your needs. And with animations and unique photos, illustrations, and fonts, you can make your presentation pop. So whether you are giving a sales pitch or presenting to the board, make sure to check out Slidegeeks first.

Introduction To Digital Banking Services Metric Dashboard To Track Internet Banking Activities Download PDF
This slide represents KPI dashboard showcasing metrics for internet banking enabling customer to track progress. It includes account balance, income, expenditure, loan etc. Slidegeeks is here to make your presentations a breeze with Introduction To Digital Banking Services Metric Dashboard To Track Internet Banking Activities Download PDF With our easy to use and customizable templates, you can focus on delivering your ideas rather than worrying about formatting. With a variety of designs to choose from, you are sure to find one that suits your needs. And with animations and unique photos, illustrations, and fonts, you can make your presentation pop. So whether you are giving a sales pitch or presenting to the board, make sure to check out Slidegeeks first.

Comprehensive Guide For Sales And Advertising Processes Digital Marketing Metrics Dashboard To Track Measure Clipart PDF
This slide presents a dashboard to measure and track performance of digital marketing activities using various metrics. It highlights element such as leads, users, users to leads, leads to MQLs, MQLs to SQLs, SQLs to opportunities, social events and social interactions. This Comprehensive Guide For Sales And Advertising Processes Digital Marketing Metrics Dashboard To Track Measure Clipart PDF from Slidegeeks makes it easy to present information on your topic with precision. It provides customization options, so you can make changes to the colors, design, graphics, or any other component to create a unique layout. It is also available for immediate download, so you can begin using it right away. Slidegeeks has done good research to ensure that you have everything you need to make your presentation stand out. Make a name out there for a brilliant performance.
Go Viral Campaign Strategies To Increase Engagement Dashboard For Tracking Viral Posts Across Digital Professional PDF
This slide showcases dashboard which can help marketers track viral posts across multiple platforms. It provides details about viral views, seed views, direct, searh, referrer, network, Facebook, Twitter, etc. Slidegeeks is here to make your presentations a breeze with Go Viral Campaign Strategies To Increase Engagement Dashboard For Tracking Viral Posts Across Digital Professional PDF With our easy to use and customizable templates, you can focus on delivering your ideas rather than worrying about formatting. With a variety of designs to choose from, you are sure to find one that suits your needs. And with animations and unique photos, illustrations, and fonts, you can make your presentation pop. So whether you are giving a sales pitch or presenting to the board, make sure to check out Slidegeeks first.

Advertising Campaign Optimization Process Digital Marketing Performance Evaluation Dashboard Sample PDF
This slide showcases the dashboard that helps to track and measure digital marketing campaign performance. It includes cost, clicks, impressions, STR, conversion rate, etc. This Advertising Campaign Optimization Process Digital Marketing Performance Evaluation Dashboard Sample PDF from Slidegeeks makes it easy to present information on your topic with precision. It provides customization options, so you can make changes to the colors, design, graphics, or any other component to create a unique layout. It is also available for immediate download, so you can begin using it right away. Slidegeeks has done good research to ensure that you have everything you need to make your presentation stand out. Make a name out there for a brilliant performance.

Target Customer Analysis And Segmentation Dashboard Ppt Portfolio Example Topics PDF
The following slide presents a dashboard for analyzing customer segmentation based on demographics factors. It includes key components such as appointment status value, count of payment method, total payments and age count. Slidegeeks is here to make your presentations a breeze with Target Customer Analysis And Segmentation Dashboard Ppt Portfolio Example Topics PDF With our easy to use and customizable templates, you can focus on delivering your ideas rather than worrying about formatting. With a variety of designs to choose from, you are sure to find one that suits your needs. And with animations and unique photos, illustrations, and fonts, you can make your presentation pop. So whether you are giving a sales pitch or presenting to the board, make sure to check out Slidegeeks first.

Dashboard To Track Essential Activities Associated With IT Department Microsoft PDF
This slide provides information regarding dashboard to monitor critical activities related to IT in terms of incident tracker, outage report, IT spend per employee, application trends, etc. Slidegeeks is here to make your presentations a breeze with Dashboard To Track Essential Activities Associated With IT Department Microsoft PDF With our easy-to-use and customizable templates, you can focus on delivering your ideas rather than worrying about formatting. With a variety of designs to choose from, you are sure to find one that suits your needs. And with animations and unique photos, illustrations, and fonts, you can make your presentation pop. So whether you are giving a sales pitch or presenting to the board, make sure to check out Slidegeeks first
Dashboard To Track Results Of Performance Marketing Ad Campaigns Formats PDF
This slide showcases dashboard that can help marketers to track and evaluate the outcomes of performance marketing ad campaigns. Its key elements are impressions, clicks, conversions, click through rate, cost per conversion, revenue per click etc. Retrieve professionally designed Dashboard To Track Results Of Performance Marketing Ad Campaigns Formats PDF to effectively convey your message and captivate your listeners. Save time by selecting pre-made slideshows that are appropriate for various topics, from business to educational purposes. These themes come in many different styles, from creative to corporate, and all of them are easily adjustable and can be edited quickly. Access them as PowerPoint templates or as Google Slides themes. You do not have to go on a hunt for the perfect presentation because Slidegeeks got you covered from everywhere.
Social Media Marketing Performance Tracking Dashboard Guide To Personal Branding Inspiration PDF
Following slide displays KPI dashboard that can be used to monitor the performance of social media marketing campaign. Metrics covered are related to fans number, engagement rate and page impressions.Are you searching for a Social Media Marketing Performance Tracking Dashboard Guide To Personal Branding Inspiration PDF that is uncluttered, straightforward, and original Its easy to edit, and you can change the colors to suit your personal or business branding. For a presentation that expresses how much effort you ve put in, this template is ideal With all of its features, including tables, diagrams, statistics, and lists, its perfect for a business plan presentation. Make your ideas more appealing with these professional slides. Download xxxxxxxxxxxxxxxxxxxx from Slidegeeks today.
Nps Reports And Dashboard Post It Notes Ppt Slides Influencers PDF
This is a nps reports and dashboard post it notes ppt slides influencers pdf template with various stages. Focus and dispense information on six stages using this creative set, that comes with editable features. It contains large content boxes to add your information on topics like post it notes. You can also showcase facts, figures, and other relevant content using this PPT layout. Grab it now.

Online Marketing Dashboard Showing Key Conversion Metrics Ppt PowerPoint Presentation Outline Example Topics PDF
Pitch your topic with ease and precision using this online marketing dashboard showing key conversion metrics ppt powerpoint presentation outline example topics pdf. This layout presents information on lead breakdown, leads, web user, top social media channels, key conversion metrics, trial leads by region. It is also available for immediate download and adjustment. So, changes can be made in the color, design, graphics or any other component to create a unique layout.

Incorporating Real Time Marketing For Improved Consumer Real Time Content Marketing Result Dashboard Mockup PDF
The following slide depicts real time content marketing KPI dashboard to monitor traffic flow and manage promotional efforts. It includes elements such as visitors by channel, conversion rate, search, direct, sessions, average time engaged etc. This modern and well arranged Incorporating Real Time Marketing For Improved Consumer Real Time Content Marketing Result Dashboard Mockup PDF provides lots of creative possibilities. It is very simple to customize and edit with the Powerpoint Software. Just drag and drop your pictures into the shapes. All facets of this template can be edited with Powerpoint no extra software is necessary. Add your own material, put your images in the places assigned for them, adjust the colors, and then you can show your slides to the world, with an animated slide included.

Product Marketing Leadership Product Marketing Dashboard For Pay Per Microsoft PDF
This graph or chart is linked to excel, and changes automatically based on data. Just left click on it and select Edit Data. Find a pre-designed and impeccable Product Marketing Leadership Product Marketing Dashboard For Pay Per Microsoft PDF. The templates can ace your presentation without additional effort. You can download these easy-to-edit presentation templates to make your presentation stand out from others. So, what are you waiting for Download the template from Slidegeeks today and give a unique touch to your presentation.

Client Life Cycle Dashboard With Marketing Metrics Ppt File Format PDF
This slide shows the key marketing KPIs such as conversion rate, impressions, etc. in customer journey cycle Showcasing this set of slides titled client life cycle dashboard with marketing metrics ppt file format pdf. The topics addressed in these templates are average customer rating, conversion rate, purchases. All the content presented in this PPT design is completely editable. Download it and make adjustments in color, background, font etc. as per your unique business setting.

Dashboard For Information Technology Incident Risk Assessment SLA Warnings Sample PDF
This slide highlights detailed assessment of open incident and service requests by team and management for ensuring smooth operations of IT department.Showcasing this set of slides titled Dashboard For Information Technology Incident Risk Assessment SLA Warnings Sample PDF The topics addressed in these templates are Open Incidents, Requests By Service, Open Incidents All the content presented in this PPT design is completely editable. Download it and make adjustments in color, background, font etc. as per your unique business setting.

SHRM Dashboard Of Employee Satisfaction Ppt PowerPoint Presentation Styles Example File PDF
This slide showcases the advanced statistics of employees satisfaction. It offers information about employee turnover, project employment, and working format that makes management convenient.Pitch your topic with ease and precision using this SHRM Dashboard Of Employee Satisfaction Ppt PowerPoint Presentation Styles Example File PDF. This layout presents information on Total Employees, Happiness Rate, Project Employment. It is also available for immediate download and adjustment. So, changes can be made in the color, design, graphics or any other component to create a unique layout.

Alternative Distribution Advertising Platform Online Multichannel Marketing Campaign Dashboard Elements PDF
This slide covers the RACE planning model which will be used by our company for prioritizing and managing digital marketing activities. Deliver an awe inspiring pitch with this creative alternative distribution advertising platform online multichannel marketing campaign dashboard elements pdf bundle. Topics like source, campaign, traffic, enquiries, rate can be discussed with this completely editable template. It is available for immediate download depending on the needs and requirements of the user.

Amalgamation Marketing Pitch Deck Online Multichannel Marketing Campaign Dashboard Themes PDF
This slide covers the RACE planning model which will be used by our company for prioritizing and managing digital marketing activities. Deliver an awe inspiring pitch with this creative amalgamation marketing pitch deck online multichannel marketing campaign dashboard themes pdf bundle. Topics like source, campaign, traffic, enquiries, rate can be discussed with this completely editable template. It is available for immediate download depending on the needs and requirements of the user.
Performance Tracking Kpi Dashboard For Digital Marketing Strategy Ppt Styles Templates PDF
Mentioned slide provides information about the key performance indicators that can be used by managers to measure the success of digital marketing strategy, KPIs covered are status, progress, priority and timeline. There are so many reasons you need a Performance Tracking Kpi Dashboard For Digital Marketing Strategy Ppt Styles Templates PDF. The first reason is you can not spend time making everything from scratch, Thus, Slidegeeks has made presentation templates for you too. You can easily download these templates from our website easily.

International Coronavirus Disease 19 Data Dashboard Showing Impact Ppt PowerPoint Presentation Portfolio Samples PDF
Pitch your topic with ease and precision using this international coronavirus disease 19 data dashboard showing impact ppt powerpoint presentation portfolio samples pdf. This layout presents information on population, households, avg size household, median age, confirmed, total employees, total businesses, population and businesses. It is also available for immediate download and adjustment. So, changes can be made in the color, design, graphics or any other component to create a unique layout.
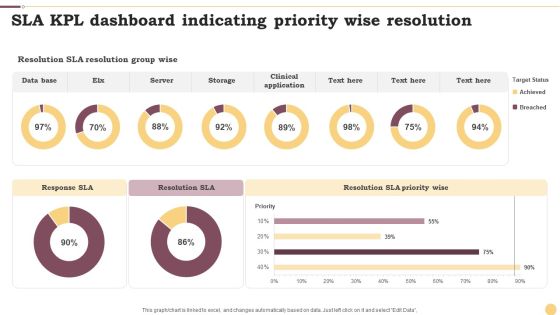
SLA KPL Dashboard Indicating Priority Wise Resolution Ppt Infographics Example File PDF
This graph or chart is linked to excel, and changes automatically based on data. Just left click on it and select Edit Data. Pitch your topic with ease and precision using this SLA KPL Dashboard Indicating Priority Wise Resolution Ppt Infographics Example File PDF. This layout presents information on Data Base, Server, Storage. It is also available for immediate download and adjustment. So, changes can be made in the color, design, graphics or any other component to create a unique layout.
Finance Metrics Dashboard Illustrating Gross And Operating Profit Margin Icons PDF
This graph or chart is linked to excel, and changes automatically based on data. Just left click on it and select edit data. Showcasing this set of slides titled Finance Metrics Dashboard Illustrating Gross And Operating Profit Margin Icons PDF. The topics addressed in these templates are Gross Profit Margin, Operating Profit Margin, Net Profit Margin. All the content presented in this PPT design is completely editable. Download it and make adjustments in color, background, font etc. as per your unique business setting.

Client Helpline Dashboard Average Time To Solve Issue Ppt Portfolio Visuals PDF
This graph or chart is linked to excel, and changes automatically based on data. Just left click on it and select Edit Data. Showcasing this set of slides titled Client Helpline Dashboard Average Time To Solve Issue Ppt Portfolio Visuals PDF. The topics addressed in these templates are Cost Per Support, Customer Satisfaction, Costs To Revenue. All the content presented in this PPT design is completely editable. Download it and make adjustments in color, background, font etc. as per your unique business setting.

Client Helpline Dashboard With Average Talk Time Distribution Ppt Gallery Backgrounds PDF
This graph or chart is linked to excel, and changes automatically based on data. Just left click on it and select Edit Data. Showcasing this set of slides titled Client Helpline Dashboard With Average Talk Time Distribution Ppt Gallery Backgrounds PDF. The topics addressed in these templates are External Incoming Call, Occupancy, Break Time, Sales. All the content presented in this PPT design is completely editable. Download it and make adjustments in color, background, font etc. as per your unique business setting.

Client Helpline Dashboard With Product Customer Satisfaction Ppt Slides Graphics Template PDF
This graph or chart is linked to excel, and changes automatically based on data. Just left click on it and select Edit Data. Pitch your topic with ease and precision using this Client Helpline Dashboard With Product Customer Satisfaction Ppt Slides Graphics Template PDF. This layout presents information on Customer Satisfaction, Product, Compare. It is also available for immediate download and adjustment. So, changes can be made in the color, design, graphics or any other component to create a unique layout.

Client Helpline Dashboard With Resolution And Response Rate Ppt File Example Topics PDF
This graph or chart is linked to excel, and changes automatically based on data. Just left click on it and select Edit Data. Showcasing this set of slides titled Client Helpline Dashboard With Resolution And Response Rate Ppt File Example Topics PDF. The topics addressed in these templates are Resolutions, Response Time, Response Time Weekday. All the content presented in this PPT design is completely editable. Download it and make adjustments in color, background, font etc. as per your unique business setting.

Help Desk Call Centre Service Level Agreement KPI Dashboard Pictures PDF
This graph or chart is linked to excel, and changes automatically based on data. Just left click on it and select Edit Data. Showcasing this set of slides titled Help Desk Call Centre Service Level Agreement KPI Dashboard Pictures PDF. The topics addressed in these templates are Call Type Today, Occupancy Today, Call Summary Today. All the content presented in this PPT design is completely editable. Download it and make adjustments in color, background, font etc. as per your unique business setting.
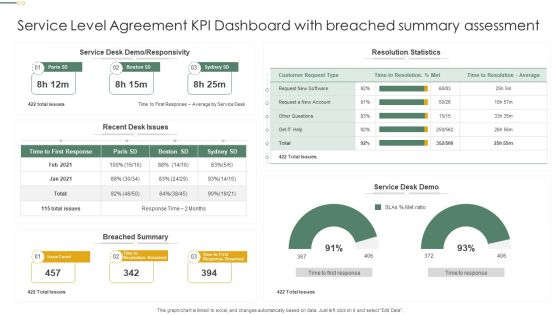
Service Level Agreement KPI Dashboard With Breached Summary Assessment Professional PDF
This graph or chart is linked to excel, and changes automatically based on data. Just left click on it and select Edit Data. Pitch your topic with ease and precision using this Service Level Agreement KPI Dashboard With Breached Summary Assessment Professional PDF. This layout presents information on Resolution Statistics, Service Desk Demo, Breached Summary. It is also available for immediate download and adjustment. So, changes can be made in the color, design, graphics or any other component to create a unique layout.
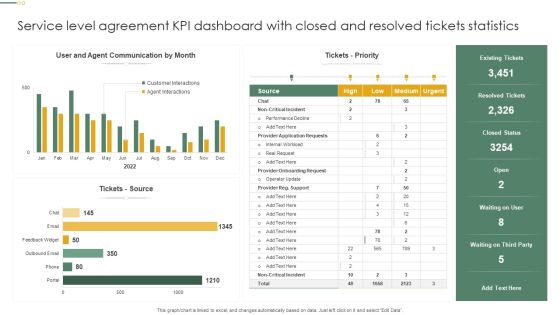
Service Level Agreement KPI Dashboard With Closed And Resolved Tickets Statistics Inspiration PDF
This graph or chart is linked to excel, and changes automatically based on data. Just left click on it and select Edit Data. Showcasing this set of slides titled Service Level Agreement KPI Dashboard With Closed And Resolved Tickets Statistics Inspiration PDF. The topics addressed in these templates are Tickets Priority, Tickets Source, Resolved Tickets. All the content presented in this PPT design is completely editable. Download it and make adjustments in color, background, font etc. as per your unique business setting.
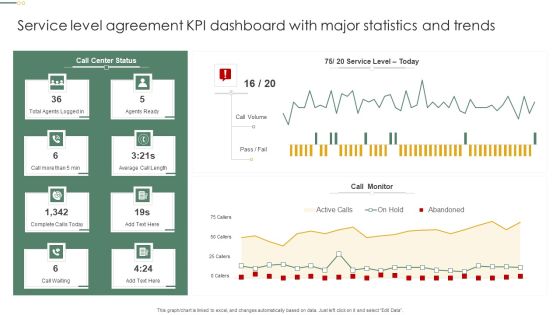
Service Level Agreement KPI Dashboard With Major Statistics And Trends Pictures PDF
This graph or chart is linked to excel, and changes automatically based on data. Just left click on it and select Edit Data. Pitch your topic with ease and precision using this Service Level Agreement KPI Dashboard With Major Statistics And Trends Pictures PDF. This layout presents information on Call Monitor, Call Volume, Agents Ready. It is also available for immediate download and adjustment. So, changes can be made in the color, design, graphics or any other component to create a unique layout.
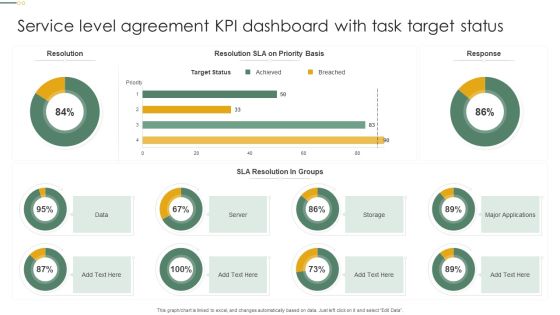
Service Level Agreement KPI Dashboard With Task Target Status Microsoft PDF
This graph or chart is linked to excel, and changes automatically based on data. Just left click on it and select Edit Data. Pitch your topic with ease and precision using this Service Level Agreement KPI Dashboard With Task Target Status Microsoft PDF. This layout presents information on Target Status, Sla Resolution, Groups, Server. It is also available for immediate download and adjustment. So, changes can be made in the color, design, graphics or any other component to create a unique layout.

Helpdesk SLA KPL Dashboard Illustrating Calls Details Ppt Slides Show PDF
This graph or chart is linked to excel, and changes automatically based on data. Just left click on it and select Edit Data. Showcasing this set of slides titled Helpdesk SLA KPL Dashboard Illustrating Calls Details Ppt Slides Show PDF. The topics addressed in these templates are Call Type Today, Trunk Utilization Today, Call Summery Today. All the content presented in this PPT design is completely editable. Download it and make adjustments in color, background, font etc. as per your unique business setting.

Service SLA KPL Changes And Incidents Dashboard Ppt Inspiration Infographics PDF
This graph or chart is linked to excel, and changes automatically based on data. Just left click on it and select Edit Data. Pitch your topic with ease and precision using this Service SLA KPL Changes And Incidents Dashboard Ppt Inspiration Infographics PDF. This layout presents information on Time Spent Department, Incidents Closed, Operator Group. It is also available for immediate download and adjustment. So, changes can be made in the color, design, graphics or any other component to create a unique layout.

SLA KPL Dashboard Indicating Compliance Priority With KPI Ppt File Format PDF
This graph or chart is linked to excel, and changes automatically based on data. Just left click on it and select Edit Data. Showcasing this set of slides titled SLA KPL Dashboard Indicating Compliance Priority With KPI Ppt File Format PDF. The topics addressed in these templates are KPI Graph, Insights Here, SLA Compliance Priority. All the content presented in this PPT design is completely editable. Download it and make adjustments in color, background, font etc. as per your unique business setting.

SLA KPL Overview Dashboard Depicting Service Targets Ppt Slides Maker PDF
This graph or chart is linked to excel, and changes automatically based on data. Just left click on it and select Edit Data. Pitch your topic with ease and precision using this SLA KPL Overview Dashboard Depicting Service Targets Ppt Slides Maker PDF. This layout presents information on Monthly Trend, Service Target, Quarterly Trend. It is also available for immediate download and adjustment. So, changes can be made in the color, design, graphics or any other component to create a unique layout.
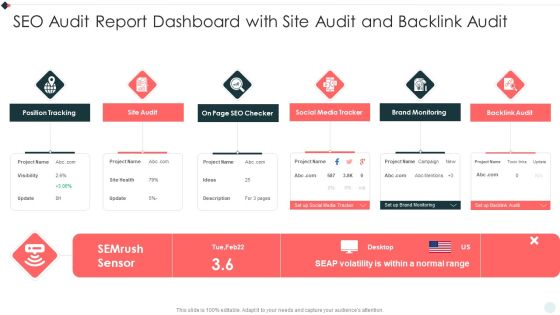
SEO Audit Summary To Increase Seo Audit Report Dashboard With Site Audit And Backlink Slides PDF
Presenting SEO Audit Summary To Increase Seo Audit Report Dashboard With Site Audit And Backlink Slides PDF to provide visual cues and insights. Share and navigate important information on six stages that need your due attention. This template can be used to pitch topics like Position Tracking, Social Media, Brand Monitoring. In addtion, this PPT design contains high resolution images, graphics, etc, that are easily editable and available for immediate download.
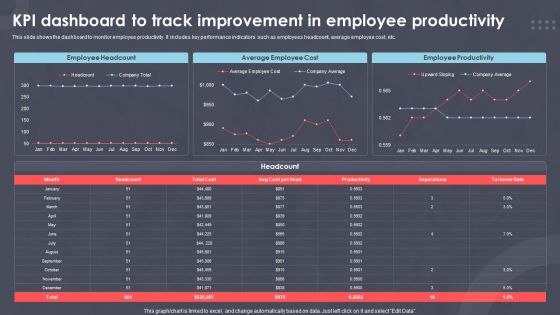
Kpi Dashboard To Track Improvement In Employee Productivity Ppt PowerPoint Presentation Outline Samples PDF
This slide shows the dashboard to monitor employee productivity. It includes key performance indicators such as employees headcount, average employee cost, etc.Showcasing this set of slides titled XXXXXXXXX. The topics addressed in these templates are Employee Headcount, Average Employee, Employee Productivity. All the content presented in this PPT design is completely editable. Download it and make adjustments in color, background, font etc. as per your unique business setting.

Dashboard Of India Country Profile Statistics Ppt Ideas Format Ideas PDF
Persuade your audience using this Dashboard Of India Country Profile Statistics Ppt Ideas Format Ideas PDF. This PPT design covers one stages, thus making it a great tool to use. It also caters to a variety of topics including Human Development Index, Global Ghg Emissions, GDP Per Capita. Download this PPT design now to present a convincing pitch that not only emphasizes the topic but also showcases your presentation skills.

Brazil Country Profile Statistics Dashboard With GDP Per Capita Mockup PDF
Persuade your audience using this Brazil Country Profile Statistics Dashboard With GDP Per Capita Mockup PDF. This PPT design covers one stages, thus making it a great tool to use. It also caters to a variety of topics including Global Ghg Emissions, Human Development Index, GDP Per Capita. Download this PPT design now to present a convincing pitch that not only emphasizes the topic but also showcases your presentation skills.
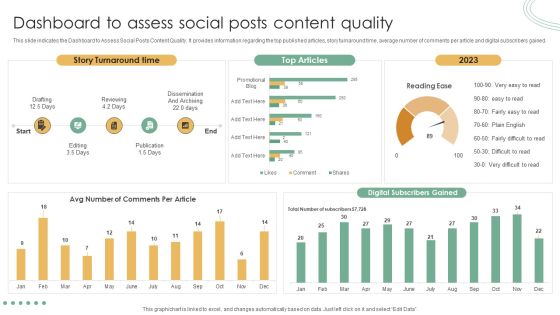
Online Marketing Techniques Assessment Approach Dashboard To Assess Social Posts Content Quality Information PDF
Take your projects to the next level with our ultimate collection of Online Marketing Techniques Assessment Approach Dashboard To Assess Social Posts Content Quality Information PDF. Slidegeeks has designed a range of layouts that are perfect for representing task or activity duration, keeping track of all your deadlines at a glance. Tailor these designs to your exact needs and give them a truly corporate look with your own brand colors they will make your projects stand out from the rest.
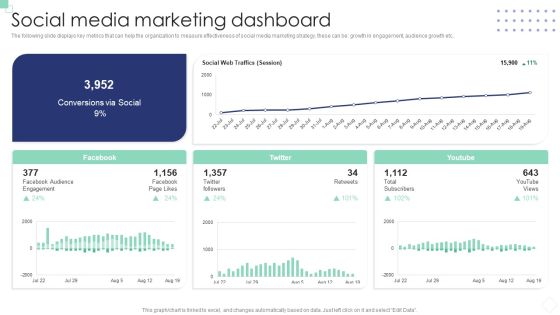
Implementing B2B And B2C Marketing Social Media Marketing Dashboard Designs PDF
The following slide displays key metrics that can help the organization to measure effectiveness of social media marketing strategy, these can be growth in engagement, audience growth etc. The best PPT templates are a great way to save time, energy, and resources. Slidegeeks have 100 percent editable powerpoint slides making them incredibly versatile. With these quality presentation templates, you can create a captivating and memorable presentation by combining visually appealing slides and effectively communicating your message. Download Implementing B2B And B2C Marketing Social Media Marketing Dashboard Designs PDF from Slidegeeks and deliver a wonderful presentation.
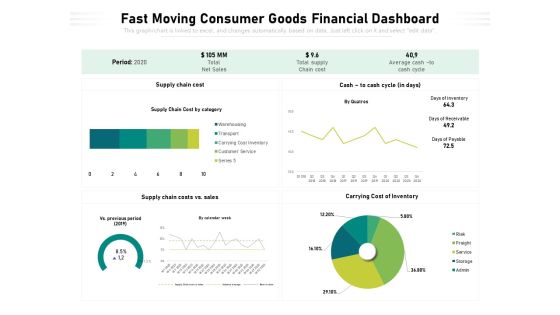
Fast Moving Consumer Goods Financial Dashboard Ppt PowerPoint Presentation Infographic Template Guide PDF
Showcasing this set of slides titled fast moving consumer goods financial dashboard ppt powerpoint presentation infographic template guide pdf. The topics addressed in these templates are supply chain cost, cash to cash cycle in days, supply chain costs vs sales. All the content presented in this PPT design is completely editable. Download it and make adjustments in color, background, font etc. as per your unique business setting.
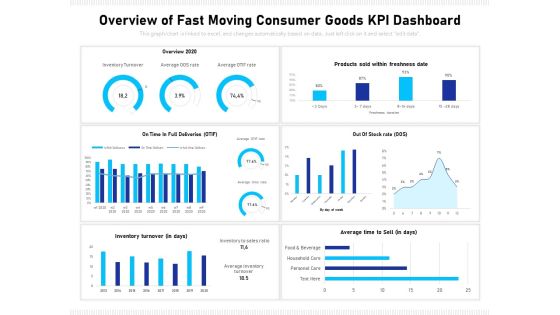
Overview Of Fast Moving Consumer Goods Kpi Dashboard Ppt PowerPoint Presentation Show Visual Aids PDF
Showcasing this set of slides titled overview of fast moving consumer goods kpi dashboard ppt powerpoint presentation show visual aids pdf. The topics addressed in these templates are overview 2020, on time in full deliveries otif, out of stock rate oos, inventory turnover in days, average time to sell in days. All the content presented in this PPT design is completely editable. Download it and make adjustments in color, background, font etc. as per your unique business setting.

Business Opportunity Assessment Dashboard With Various Ppt PowerPoint Presentation Professional Graphics Download PDF
Pitch your topic with ease and precision using this business opportunity assessment dashboard with various ppt powerpoint presentation professional graphics download pdf. This layout presents information on opportunity size, individual opportunity count by sales stages, opportunity count by region, opportunity count by sales stage. It is also available for immediate download and adjustment. So, changes can be made in the color, design, graphics or any other component to create a unique layout.

CRM System Competitive Dashboard With Sales Pipeline Ppt PowerPoint Presentation Icon Outfit PDF
Showcasing this set of slides titled crm system competitive dashboard with sales pipeline ppt powerpoint presentation icon outfit pdf. The topics addressed in these templates are sales forecast by competitor, win loss report, open opportunity revenue by competitor, sales pipeline by sales rep, competitor. All the content presented in this PPT design is completely editable. Download it and make adjustments in color, background, font etc. as per your unique business setting.

CRM System Dashboard With Sales Pipeline Ppt PowerPoint Presentation Gallery Icons PDF
Pitch your topic with ease and precision using this crm system dashboard with sales pipeline ppt powerpoint presentation gallery icons pdf. This layout presents information on margin by sale rep, deal size vs discount, sale activity by sales rep, margin by sale rep, sales pipeline by sales rep, neglected accounts. It is also available for immediate download and adjustment. So, changes can be made in the color, design, graphics or any other component to create a unique layout.

Dashboard Showing Procurement Cycle Time Ppt PowerPoint Presentation Icon Example Topics PDF
Pitch your topic with ease and precision using this dashboard showing procurement cycle time ppt powerpoint presentation icon example topics pdf. This layout presents information on top suppliers by partner status, rate of contract compliance by supplier category, avg procurement cycle supplier classification. It is also available for immediate download and adjustment. So, changes can be made in the color, design, graphics or any other component to create a unique layout.
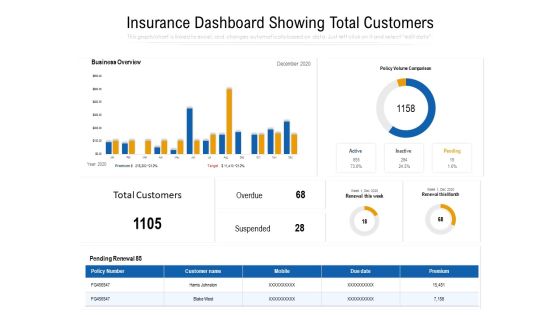
Insurance Dashboard Showing Total Customers Ppt PowerPoint Presentation Pictures Model PDF
Showcasing this set of slides titled insurance dashboard showing total customers ppt powerpoint presentation slides graphics tutorials pdf. The topics addressed in these templates are business overview, policy volume comparison, suspended, renewal this week, renewal this month, premium. All the content presented in this PPT design is completely editable. Download it and make adjustments in color, background, font etc. as per your unique business setting.

Economic Facts And Insights Analysis Dashboard Ppt PowerPoint Presentation Inspiration Slide Download PDF
Showcasing this set of slides titled economic facts and insights analysis dashboard ppt powerpoint presentation inspiration slide download pdf. The topics addressed in these templates are current working capital, cash conversion cycle in days last, current quick stats, vendor payment error rate last, 12 months currnet budget variance. All the content presented in this PPT design is completely editable. Download it and make adjustments in color, background, font etc. as per your unique business setting.
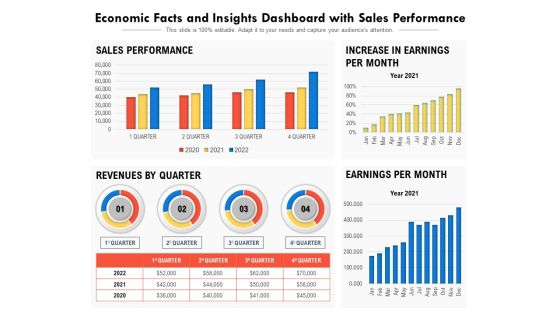
Economic Facts And Insights Dashboard With Sales Performance Ppt PowerPoint Presentation Show Gallery PDF
Showcasing this set of slides titled economic facts and insights dashboard with sales performance ppt powerpoint presentation show gallery pdf. The topics addressed in these templates are sales performance, increase in earnings per month, revenues by quarter, earnings per month. All the content presented in this PPT design is completely editable. Download it and make adjustments in color, background, font etc. as per your unique business setting.

Health IT System Business Performance Dashboard Ppt Summary File Formats PDF
This Slide provides a detailed overview of health information system market analysis. It covers region wise annual growth insights. Showcasing this set of slides titled health it system business performance dashboard ppt summary file formats pdf. The topics addressed in these templates are market contributes, cloud segment, revenue contributing. All the content presented in this PPT design is completely editable. Download it and make adjustments in color, background, font etc. as per your unique business setting.

Project Analytics Dashboard With Conversion Rate Ppt PowerPoint Presentation File Deck PDF
Pitch your topic with ease and precision using this project analytics dashboard with conversion rate ppt powerpoint presentation gallery graphics template pdf. This layout presents information on cost per conversion, supercharger network, advertisement conversion, conversion by campaign. It is also available for immediate download and adjustment. So, changes can be made in the color, design, graphics or any other component to create a unique layout.
SEO Audit Report Dashboard With Site Audit And Backlink Audit Ppt Icon Sample PDF
Presenting seo audit report dashboard with site audit and backlink audit ppt icon sample pdf to provide visual cues and insights. Share and navigate important information on six stages that need your due attention. This template can be used to pitch topics like social media tracker, brand monitoring, backlink audit, site audit, position tracking. In addtion, this PPT design contains high resolution images, graphics, etc, that are easily editable and available for immediate download.

Clinical Risk Assessment Dashboard For Improving Quality And Safety In Healthcare Brochure PDF
This slide illustrates key initiatives taken by HR department for resolving global team conflicts. Pitch your topic with ease and precision using this Clinical Risk Assessment Dashboard For Improving Quality And Safety In Healthcare Brochure PDF This layout presents information on Ward Administration, Patient Experience, Risk Assessment It is also available for immediate download and adjustment. So, changes can be made in the color, design, graphics or any other component to create a unique layout.
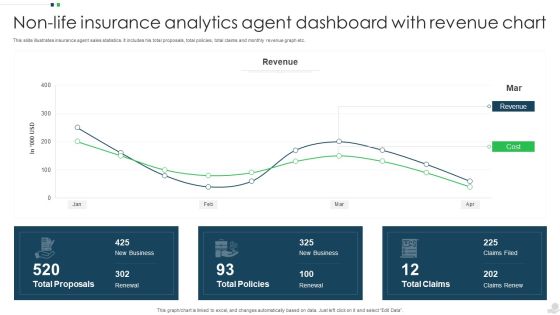
Non Life Insurance Analytics Agent Dashboard With Revenue Chart Infographics PDF
This slide illustrates insurance agent sales statistics. It includes his total proposals, total policies, total claims and monthly revenue graph etc. Showcasing this set of slides titled Non Life Insurance Analytics Agent Dashboard With Revenue Chart Infographics PDF. The topics addressed in these templates are Revenue, Cost, Total Proposals. All the content presented in this PPT design is completely editable. Download it and make adjustments in color, background, font etc. as per your unique business setting.
