AI PPT Maker
Templates
PPT Bundles
Design Services
Business PPTs
Business Plan
Management
Strategy
Introduction PPT
Roadmap
Self Introduction
Timelines
Process
Marketing
Agenda
Technology
Medical
Startup Business Plan
Cyber Security
Dashboards
SWOT
Proposals
Education
Pitch Deck
Digital Marketing
KPIs
Project Management
Product Management
Artificial Intelligence
Target Market
Communication
Supply Chain
Google Slides
Research Services
 One Pagers
All Categories
-
Home
- Customer Favorites
- Executive Dashboard
Executive Dashboard

Interoperability Software Testing Dashboard For Interoperability Testing Information PDF
This slide depicts the interoperability testing dashboard, based on features like test case analysis, tests linked to requirements, test case breakdown, and tests per requirement, among others. Do you have an important presentation coming up Are you looking for something that will make your presentation stand out from the rest Look no further than Interoperability Software Testing Dashboard For Interoperability Testing Information PDF. With our professional designs, you can trust that your presentation will pop and make delivering it a smooth process. And with Slidegeeks, you can trust that your presentation will be unique and memorable. So why wait Grab Interoperability Software Testing Dashboard For Interoperability Testing Information PDF today and make your presentation stand out from the rest.

Dashboard To Track Several Projects Performance By Firm Template PDF
This slide provides information regarding the dashboard which will help team in tracking different activities associated to multiple projects by monitoring resources, tasks status, bugs and features closed, etc. Do you have an important presentation coming up Are you looking for something that will make your presentation stand out from the rest Look no further than Dashboard To Track Several Projects Performance By Firm Template PDF. With our professional designs, you can trust that your presentation will pop and make delivering it a smooth process. And with Slidegeeks, you can trust that your presentation will be unique and memorable. So why wait Grab Dashboard To Track Several Projects Performance By Firm Template PDF today and make your presentation stand out from the rest.
Product And Customer Performance Tracking Dashboard Portrait PDF
This slide provides information regarding dashboard utilized by firm to monitor performance of products offered and customer associated. The performance is tracked through revenues generated, new customer acquired, customer satisfaction, sales comparison, etc. Do you have an important presentation coming up Are you looking for something that will make your presentation stand out from the rest Look no further than Product And Customer Performance Tracking Dashboard Portrait PDF. With our professional designs, you can trust that your presentation will pop and make delivering it a smooth process. And with Slidegeeks, you can trust that your presentation will be unique and memorable. So why wait Grab Product And Customer Performance Tracking Dashboard Portrait PDF today and make your presentation stand out from the rest.
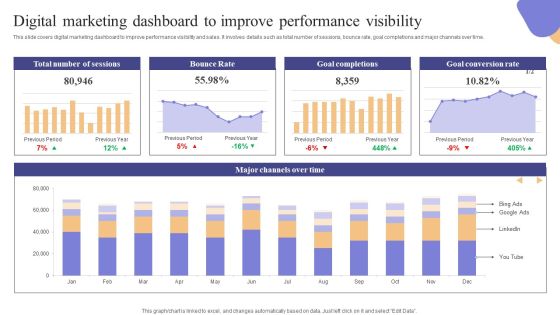
Digital Marketing Dashboard To Improve Performance Visibility Brochure PDF
This slide covers digital marketing dashboard to improve performance visibility and sales. It involves details such as total number of sessions, bounce rate, goal completions and major channels over time. If you are looking for a format to display your unique thoughts, then the professionally designed Digital Marketing Dashboard To Improve Performance Visibility Brochure PDF is the one for you. You can use it as a Google Slides template or a PowerPoint template. Incorporate impressive visuals, symbols, images, and other charts. Modify or reorganize the text boxes as you desire. Experiment with shade schemes and font pairings. Alter, share or cooperate with other people on your work. Download Digital Marketing Dashboard To Improve Performance Visibility Brochure PDF and find out how to give a successful presentation. Present a perfect display to your team and make your presentation unforgettable.
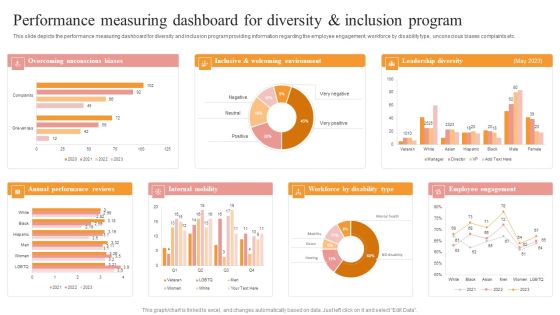
Performance Measuring Dashboard For Diversity And Inclusion Program Summary PDF
This slide depicts the performance measuring dashboard for diversity and inclusion program providing information regarding the employee engagement, workforce by disability type, unconscious biases complaints etc. Explore a selection of the finest Performance Measuring Dashboard For Diversity And Inclusion Program Summary PDF here. With a plethora of professionally designed and pre made slide templates, you can quickly and easily find the right one for your upcoming presentation. You can use our Performance Measuring Dashboard For Diversity And Inclusion Program Summary PDF to effectively convey your message to a wider audience. Slidegeeks has done a lot of research before preparing these presentation templates. The content can be personalized and the slides are highly editable. Grab templates today from Slidegeeks.

Cost And Purchase Order Procurement Dashboard Icons PDF
This slide provides an overview of the cost and purchase order-related performance indicators to improve efficiency and optimize processes. The dashboard includes the cost of the purchase order, cost reduction, savings, procurement ROI and top 5 suppliers. If you are looking for a format to display your unique thoughts, then the professionally designed Cost And Purchase Order Procurement Dashboard Icons PDF is the one for you. You can use it as a Google Slides template or a PowerPoint template. Incorporate impressive visuals, symbols, images, and other charts. Modify or reorganize the text boxes as you desire. Experiment with shade schemes and font pairings. Alter, share or cooperate with other people on your work. Download Cost And Purchase Order Procurement Dashboard Icons PDF and find out how to give a successful presentation. Present a perfect display to your team and make your presentation unforgettable.
Product And Customer Performance Tracking Dashboard Summary PDF
This slide provides information regarding dashboard utilized by firm to monitor performance of products offered and customer associated. The performance is tracked through revenues generated, new customer acquired, customer satisfaction, sales comparison, etc. If you are looking for a format to display your unique thoughts, then the professionally designed Product And Customer Performance Tracking Dashboard Summary PDF is the one for you. You can use it as a Google Slides template or a PowerPoint template. Incorporate impressive visuals, symbols, images, and other charts. Modify or reorganize the text boxes as you desire. Experiment with shade schemes and font pairings. Alter, share or cooperate with other people on your work. Download Product And Customer Performance Tracking Dashboard Summary PDF and find out how to give a successful presentation. Present a perfect display to your team and make your presentation unforgettable.

Cobots Global Statistics Dashboard To Track Cobot Performance Mockup PDF
This slide represents the cobots performance dashboard by covering details of battery level, performance, total hours, average time, time to return, energy consumption, and so on. If you are looking for a format to display your unique thoughts, then the professionally designed Cobots Global Statistics Dashboard To Track Cobot Performance Mockup PDF is the one for you. You can use it as a Google Slides template or a PowerPoint template. Incorporate impressive visuals, symbols, images, and other charts. Modify or reorganize the text boxes as you desire. Experiment with shade schemes and font pairings. Alter, share or cooperate with other people on your work. Download Cobots Global Statistics Dashboard To Track Cobot Performance Mockup PDF and find out how to give a successful presentation. Present a perfect display to your team and make your presentation unforgettable.

Dashboard To Measure Workflow Performance Post RPA Implementation Demonstration PDF
This slide presents a dashboard to measure the overall operation performance after RPA implementation. It includes return on investment, bot numbers, saved hours, capital, bots runtime, time saved by bots, and workflow processes. If you are looking for a format to display your unique thoughts, then the professionally designed Dashboard To Measure Workflow Performance Post RPA Implementation Demonstration PDF is the one for you. You can use it as a Google Slides template or a PowerPoint template. Incorporate impressive visuals, symbols, images, and other charts. Modify or reorganize the text boxes as you desire. Experiment with shade schemes and font pairings. Alter, share or cooperate with other people on your work. Download Dashboard To Measure Workflow Performance Post RPA Implementation Demonstration PDF and find out how to give a successful presentation. Present a perfect display to your team and make your presentation unforgettable.

Dashboard For Education Institutes With Student Retention Metrics Slides PDF
This slide covers dashboard for tracking student and faculty members details. It include metrics such as faculty to student ratio, student attendance rate, faculty retention rate, student enrollment details, examination results overview, etc. Showcasing this set of slides titled Dashboard For Education Institutes With Student Retention Metrics Slides PDF. The topics addressed in these templates are Student Enrollment Details, Examination Results Overview, Faculty Student Ratio. All the content presented in this PPT design is completely editable. Download it and make adjustments in color, background, font etc. as per your unique business setting.

Dashboard To Measure Business Financial Performance Summary PDF
This slide shows the dashboard to measure business financial performance which focuses on revenues, debt to equity, net profit margin, gross profit margin and return on equity. Are you searching for a Dashboard To Measure Business Financial Performance Summary PDF that is uncluttered, straightforward, and original Its easy to edit, and you can change the colors to suit your personal or business branding. For a presentation that expresses how much effort youve put in, this template is ideal With all of its features, including tables, diagrams, statistics, and lists, its perfect for a business plan presentation. Make your ideas more appealing with these professional slides. Download Dashboard To Measure Business Financial Performance Summary PDF from Slidegeeks today.

SEM Campaign Performance Evaluation Dashboard Ppt Icon Graphics Tutorials PDF
The following slide showcases the search engine marketing performance through KPI dashboard to evaluate return on investments ROI and promote visibility. It includes KPAs such as targets, unique purchases, cost per click, conversion rate, campaign reach, profile views etc. Are you searching for a SEM Campaign Performance Evaluation Dashboard Ppt Icon Graphics Tutorials PDF that is uncluttered, straightforward, and original Its easy to edit, and you can change the colors to suit your personal or business branding. For a presentation that expresses how much effort you have put in, this template is ideal With all of its features, including tables, diagrams, statistics, and lists, its perfect for a business plan presentation. Make your ideas more appealing with these professional slides. Download SEM Campaign Performance Evaluation Dashboard Ppt Icon Graphics Tutorials PDF from Slidegeeks today.
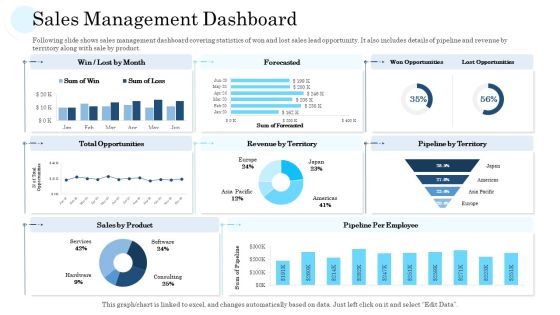
Sales Management Dashboard Ppt PowerPoint Presentation Portfolio Gallery PDF
Following slide shows sales management dashboard covering statistics of won and lost sales lead opportunity. It also includes details of pipeline and revenue by territory along with sale by product.Deliver and pitch your topic in the best possible manner with this sales management dashboard ppt powerpoint presentation portfolio gallery pdf. Use them to share invaluable insights on total opportunities, sales by product, revenue by territory, pipeline per employee and impress your audience. This template can be altered and modified as per your expectations. So, grab it now.

Dashboard For Talent Management And Engagement Retention Microsoft PDF
This slide shows the dashboard related to talent management and engagement which includes retention by department, salaries by department, age by race, marital status, etc.Deliver and pitch your topic in the best possible manner with this dashboard for talent management and engagement retention microsoft pdf. Use them to share invaluable insights on salaries by department, salary and age by race or ethnicity, retention by department and impress your audience. This template can be altered and modified as per your expectations. So, grab it now.
Salesman Principles Playbook Sales Management Activities Tracking Dashboard Ideas PDF
This slide provides information regarding various metrics catered to track sales team performance in terms of average revenue per account, win rate, NPS, along with sales representative performance tracking through number of opportunities created, lead response time, etc. Deliver and pitch your topic in the best possible manner with this salesman principles playbook sales management activities tracking dashboard ideas pdf Use them to share invaluable insights on sales management activities tracking dashboard and impress your audience. This template can be altered and modified as per your expectations. So, grab it now.

Dashboard To Evaluate Talent Management Metrics Topics PDF
This slide represents talent management dashboards. It includes average time to hire, cost per hire, training cost, talent turnover rate, talent satisfaction etc. Boost your pitch with our creative Dashboard To Evaluate Talent Management Metrics Topics PDF. Deliver an awe inspiring pitch that will mesmerize everyone. Using these presentation templates you will surely catch everyones attention. You can browse the ppts collection on our website. We have researchers who are experts at creating the right content for the templates. So you do not have to invest time in any additional work. Just grab the template now and use them.

Customer Lead Development Management Strategies Lead Distribution Dashboard Elements PDF
Crafting an eye catching presentation has never been more straightforward. Let your presentation shine with this tasteful yet straightforward Customer Lead Development Management Strategies Lead Distribution Dashboard Elements PDF template. It offers a minimalistic and classy look that is great for making a statement. The colors have been employed intelligently to add a bit of playfulness while still remaining professional. Construct the ideal Customer Lead Development Management Strategies Lead Distribution Dashboard Elements PDF that effortlessly grabs the attention of your audience Begin now and be certain to wow your customers.

Competitive Procurement Pricing Benchmarks Analysis Dashboard Graphics PDF
This slide shows the dashboard representing the procurement price benchmarking comparative analysis report. It shows information related to quality KPIs, return cost analysis, supplier quality range and project analysis. Showcasing this set of slides titled Competitive Procurement Pricing Benchmarks Analysis Dashboard Graphics PDF. The topics addressed in these templates are Return Cost Analysis, Project Analysis, Supplier Quality Rating. All the content presented in this PPT design is completely editable. Download it and make adjustments in color, background, font etc. as per your unique business setting.
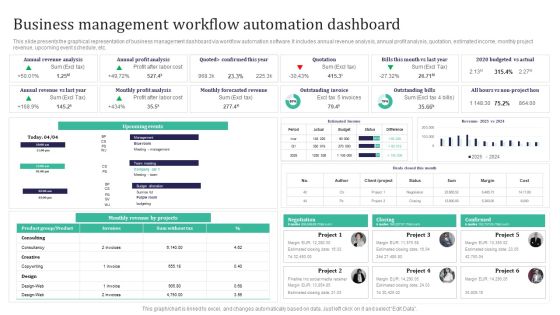
Integration Automation Business Management Workflow Automation Dashboard Summary PDF
This slide presents the graphical representation of business management dashboard via workflow automation software. It includes annual revenue analysis, annual profit analysis, quotation, estimated income, monthly project revenue, upcoming event schedule, etc. Slidegeeks is one of the best resources for PowerPoint templates. You can download easily and regulate Integration Automation Business Management Workflow Automation Dashboard Summary PDF for your personal presentations from our wonderful collection. A few clicks is all it takes to discover and get the most relevant and appropriate templates. Use our Templates to add a unique zing and appeal to your presentation and meetings. All the slides are easy to edit and you can use them even for advertisement purposes.
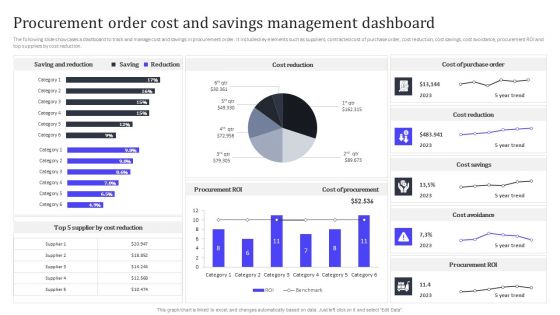
Procurement Order Cost And Savings Management Dashboard Ideas PDF
The following slide showcases a dashboard to track and manage cost and savings in procurement order. It includes key elements such as suppliers, contracted cost of purchase order, cost reduction, cost savings, cost avoidance, procurement ROI and top suppliers by cost reduction. There are so many reasons you need a Procurement Order Cost And Savings Management Dashboard Ideas PDF. The first reason is you can not spend time making everything from scratch, Thus, Slidegeeks has made presentation templates for you too. You can easily download these templates from our website easily.

Automated Supplier Relationship Management Risk Assessment Dashboard Showing Template PDF
This slide delineates risk assessment dashboard which can help vendor managers in assessing procurement contract status. It includes information about suppliers, renewals, actions, assessment status, concentration, etc. Slidegeeks is one of the best resources for PowerPoint templates. You can download easily and regulate Automated Supplier Relationship Management Risk Assessment Dashboard Showing Template PDF for your personal presentations from our wonderful collection. A few clicks is all it takes to discover and get the most relevant and appropriate templates. Use our Templates to add a unique zing and appeal to your presentation and meetings. All the slides are easy to edit and you can use them even for advertisement purposes.

Cybersecurity Threat Management Activities Tracking Dashboard Pictures PDF
This slide provides details regarding cybersecurity threat management activities tracking dashboard in terms of breach risk trends, risk issues by owner, breach likelihood, etc. Want to ace your presentation in front of a live audience Our Cybersecurity Threat Management Activities Tracking Dashboard Pictures PDF can help you do that by engaging all the users towards you.. Slidegeeks experts have put their efforts and expertise into creating these impeccable powerpoint presentations so that you can communicate your ideas clearly. Moreover, all the templates are customizable, and easy-to-edit and downloadable. Use these for both personal and commercial use.

ITSM Ticketing Tool Dashboard With Activity Status Guidelines PDF
This slide depicts information technology service management ITSM ticketing tool dashboard with activity status. It provides information about open tickets, closed tickets, requests, desktop support, alert level, completed tickets, etc. Crafting an eye catching presentation has never been more straightforward. Let your presentation shine with this tasteful yet straightforward ITSM Ticketing Tool Dashboard With Activity Status Guidelines PDF template. It offers a minimalistic and classy look that is great for making a statement. The colors have been employed intelligently to add a bit of playfulness while still remaining professional. Construct the ideal ITSM Ticketing Tool Dashboard With Activity Status Guidelines PDF that effortlessly grabs the attention of your audience Begin now and be certain to wow your customers.

Supplier Performance And Order Cycle Time Monitoring Dashboard Introduction PDF
The following slide showcases a dashboard to supervise and manage procurement order cycle time an supplier performance. It includes key elements such as defect rate, on time supplies, supplier availability, lead time, supplier defect rate, defect type and delivery time. Do you have to make sure that everyone on your team knows about any specific topic I yes, then you should give Supplier Performance And Order Cycle Time Monitoring Dashboard Introduction PDF a try. Our experts have put a lot of knowledge and effort into creating this impeccable Supplier Performance And Order Cycle Time Monitoring Dashboard Introduction PDF. You can use this template for your upcoming presentations, as the slides are perfect to represent even the tiniest detail. You can download these templates from the Slidegeeks website and these are easy to edit. So grab these today.

Cyber Security Key Performance Indicators Metrics Dashboard Mockup PDF
This slide covers cyber security health status dashboard . It also includes audit and compliance, controls health, project status, incident response process, vulnerability patching schedule, investigation process and training compliance. Pitch your topic with ease and precision using this Cyber Security Key Performance Indicators Metrics Dashboard Mockup PDF. This layout presents information on Cyber Security, Vulnerability Patching Schedule, Compliance Investigation Process. It is also available for immediate download and adjustment. So, changes can be made in the color, design, graphics or any other component to create a unique layout.

Optimizing And Managing Retail Dashboard For Measuring Customer Formats PDF
Mentioned slide illustrates customer satisfaction dashboard. It includes information about net promoter score, customer retention rate and customer effort score.. From laying roadmaps to briefing everything in detail, our templates are perfect for you. You can set the stage with your presentation slides. All you have to do is download these easy-to-edit and customizable templates. Optimizing And Managing Retail Dashboard For Measuring Customer Formats PDF will help you deliver an outstanding performance that everyone would remember and praise you for. Do download this presentation today.

Centralized Repository Data Lake Reporting Dashboard Icons PDF
This slide represents the data lake reporting dashboard by covering the total number of users, total lake size, trusted zone size, conversion rate, and retention. Find a pre designed and impeccable Centralized Repository Data Lake Reporting Dashboard Icons PDF. The templates can ace your presentation without additional effort. You can download these easy to edit presentation templates to make your presentation stand out from others. So, what are you waiting for Download the template from Slidegeeks today and give a unique touch to your presentation.

Customer Project Expense Dashboard With Manager Task Workload Microsoft PDF
Showcasing this set of slides titled Customer Project Expense Dashboard With Manager Task Workload Microsoft PDF. The topics addressed in these templates are Customer Project Revenue, Costs, Project Manager Workload. All the content presented in this PPT design is completely editable. Download it and make adjustments in color, background, font etc. as per your unique business setting.

ADC Cosmetics Company Dashboard With Variables Summary PDF
This slide shows a cosmetics and skin care sales dashboard with KPIs such as Profit Margin in 2021, Cross Selling Rate , Market Size , Stock Turnover Rate , Social Media Usage, Revenue etc. Presenting adc cosmetics company dashboard with variables summary pdf to provide visual cues and insights. Share and navigate important information on eight stages that need your due attention. This template can be used to pitch topics like profit margin, cross selling rate, market size, revenue, stock turnover rate. In addtion, this PPT design contains high resolution images, graphics, etc, that are easily editable and available for immediate download.

Project Expenses Spend Under Management Dashboard Summary PDF
Showcasing this set of slides titled Project Expenses Spend Under Management Dashboard Summary PDF. The topics addressed in these templates are Top Suppliers, Top Buyers, Spend Under Management . All the content presented in this PPT design is completely editable. Download it and make adjustments in color, background, font etc. as per your unique business setting.
Project Management Risk Tracking KPI Dashboard Pictures PDF
Showcasing this set of slides titled Project Management Risk Tracking KPI Dashboard Pictures PDF. The topics addressed in these templates are Overdue Risk, Average Age, Number Of Risk. All the content presented in this PPT design is completely editable. Download it and make adjustments in color, background, font etc. as per your unique business setting.

Project Metrics Dashboard With Overall Progress Brochure PDF
This slide covers the project management dashboard which includes risks, overdue tasks, employees over budget, workloads, planning, designing, development and testing with current target amount, launch date, usage of targeted amount, etc. Pitch your topic with ease and precision using this Project Metrics Dashboard With Overall Progress Brochure PDF. This layout presents information on Design, Planning, Development. It is also available for immediate download and adjustment. So, changes can be made in the color, design, graphics or any other component to create a unique layout.

Building Quality Inspection Dashboard With Customer Satisfaction Ratio Icons PDF
The following slide showcases dashboard of construction company exhibiting quality KPIs regarding safety, workmanship and customer satisfaction. Key indicators covered are site inspection success level, CSR, defect count, net promoter score, promotors, passives, defectors, total rework cost, safety meetings and average time taken to fix defects. Showcasing this set of slides titled Building Quality Inspection Dashboard With Customer Satisfaction Ratio Icons PDF. The topics addressed in these templates are Construction Project, Customer Satisfaction Ratio, Promoters. All the content presented in this PPT design is completely editable. Download it and make adjustments in color, background, font etc. as per your unique business setting.
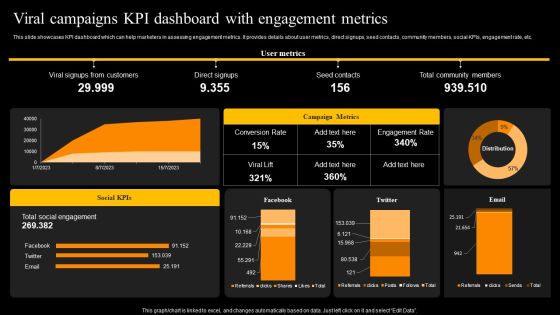
Viral Campaigns Kpi Dashboard With Engagement Metrics Template PDF
This slide showcases KPI dashboard which can help marketers in assessing engagement metrics. It provides details about user metrics, direct signups, seed contacts, community members, social KPIs, engagement rate, etc. Want to ace your presentation in front of a live audience Our Viral Campaigns Kpi Dashboard With Engagement Metrics Template PDF can help you do that by engaging all the users towards you. Slidegeeks experts have put their efforts and expertise into creating these impeccable powerpoint presentations so that you can communicate your ideas clearly. Moreover, all the templates are customizable, and easy to edit and downloadable. Use these for both personal and commercial use.
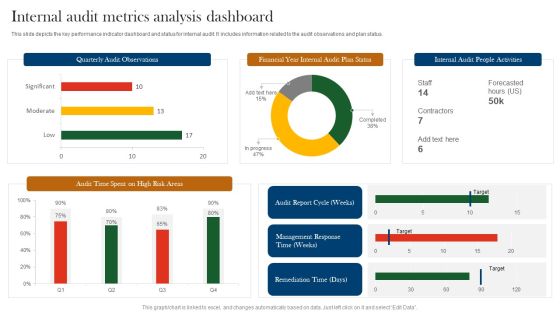
Internal Audit Metrics Analysis Dashboard Ppt Ideas Clipart Images PDF
This slide depicts the key performance indicator dashboard and status for internal audit. It includes information related to the audit observations and plan status. Pitch your topic with ease and precision using this Internal Audit Metrics Analysis Dashboard Ppt Ideas Clipart Images PDF. This layout presents information on Quarterly Audit Observations, Financial Year Internal, Audit Plan Status. It is also available for immediate download and adjustment. So, changes can be made in the color, design, graphics or any other component to create a unique layout.

Enterprise Workforce Performance Dashboard With Sprint Review Themes PDF
This slide illustrates project extended team KPI dashboard with sprints evaluation. It provides information about average cycle time, velocity history, sprint variance, capacity variance, committed variance, etc. Showcasing this set of slides titled Enterprise Workforce Performance Dashboard With Sprint Review Themes PDF. The topics addressed in these templates are Velocity History, Sprint Variance, Average Cycle, Time Per State. All the content presented in this PPT design is completely editable. Download it and make adjustments in color, background, font etc. as per your unique business setting.

Annual Revenue And Cost Budget Deficit KPI Dashboard Ideas PDF
The following slide depicts the yearly budget variance to compare projected and actual results. It includes elements such as net income, service revenues, profit margin, payroll cost, cost of goods sold etc. Showcasing this set of slides titled Annual Revenue And Cost Budget Deficit KPI Dashboard Ideas PDF. The topics addressed in these templates are Cost Budget, Deficit KPI Dashboard. All the content presented in this PPT design is completely editable. Download it and make adjustments in color, background, font etc. as per your unique business setting.
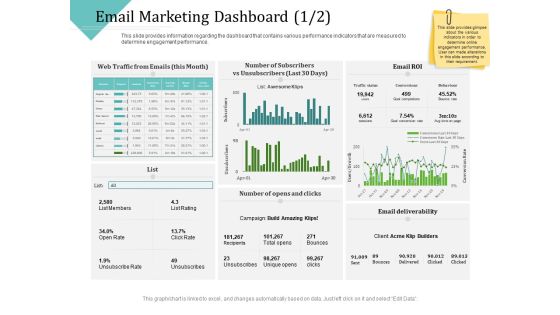
Improving Client Experience Email Marketing Dashboard Click Demonstration PDF
Deliver and pitch your topic in the best possible manner with this improving client experience email marketing dashboard click demonstration pdf. Use them to share invaluable insights on campaign, traffic status, social, organic, paid search and impress your audience. This template can be altered and modified as per your expectations. So, grab it now.

Enterprise Sustainability Performance Metrics Employee Billable Hours Dashboard Information PDF
Following slide shows employee billable hours dashboard covering total hours capacity, allocated hours billable, total hours worked, and total billable hours worked for the assignment. It also includes details of each team member indulged for same assignment.Deliver an awe inspiring pitch with this creative Enterprise Sustainability Performance Metrics Employee Billable Hours Dashboard Information PDF bundle. Topics like Billable Worked, Allocated Billable, Total Capacity can be discussed with this completely editable template. It is available for immediate download depending on the needs and requirements of the user.
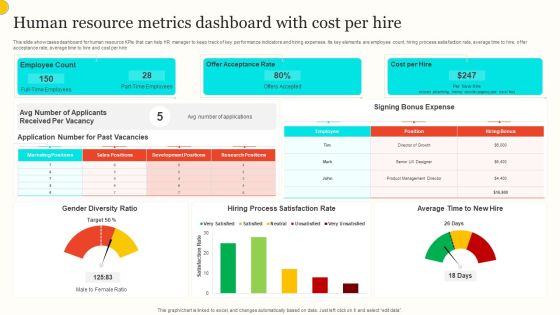
Human Resource Metrics Dashboard With Cost Per Hire Portrait PDF
This slide showcases dashboard for human resource KPIs that can help HR manager to keep track of key performance indicators and hiring expenses. Its key elements are employee count, hiring process satisfaction rate, average time to hire, offer acceptance rate, average time to hire and cost per hire. Showcasing this set of slides titled Human Resource Metrics Dashboard With Cost Per Hire Portrait PDF. The topics addressed in these templates are Employee Count, Offer Acceptance Rate, Cost Per Hire. All the content presented in this PPT design is completely editable. Download it and make adjustments in color, background, font etc. as per your unique business setting.

Advertising And Marketing Campaign Strategy Success Communication Dashboard Inspiration PDF
This slide depicts a multi channel dashboard for tracking advertising and marketing campaign plan success which provides real time data to track the performance of marketing efforts. The various key performing indicators are cost, conversions and channel performance Showcasing this set of slides titled Advertising And Marketing Campaign Strategy Success Communication Dashboard Inspiration PDF. The topics addressed in these templates are Conversions, Spend, Channel. All the content presented in this PPT design is completely editable. Download it and make adjustments in color, background, font etc. as per your unique business setting.

Annual Financial Data With KPI Insights Dashboard Structure PDF
The following slides highlights the financial kpas in summarized form to evaluate companys annual operating performance. It includes metrics such as gross, operating and net profit margin, income statement, target versus actual EBIT etc. Pitch your topic with ease and precision using this Annual Financial Data With KPI Insights Dashboard Structure PDF. This layout presents information on Gross Profit Margin, Operating Profit Margin, Net Profit Margin. It is also available for immediate download and adjustment. So, changes can be made in the color, design, graphics or any other component to create a unique layout.

Dashboard For Big Healthcare Data Analytics Graphics PDF
This slide showcase the dashboard for big data analytics in healthcare. It includes elements such as bed occupancy rate, patient turnover rate, efficiency and costs, missed and cancelled appointment rate. Showcasing this set of slides titled Dashboard For Big Healthcare Data Analytics Graphics PDF. The topics addressed in these templates are Satisfaction Service Indicators, Occupancy, Forecasted Patient Turnover. All the content presented in this PPT design is completely editable. Download it and make adjustments in color, background, font etc. as per your unique business setting.
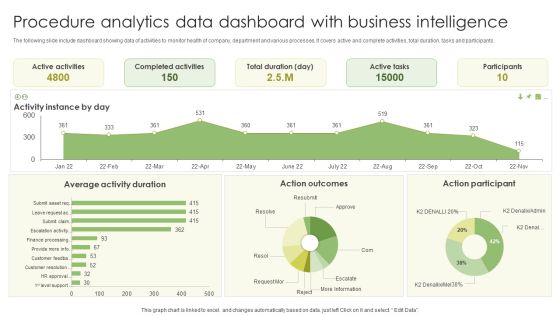
Procedure Analytics Data Dashboard With Business Intelligence Slides PDF
The following slide include dashboard showing data of activities to monitor health of company, department and various processes. It covers active and complete activities, total duration, tasks and participants. Pitch your topic with ease and precision using this Procedure Analytics Data Dashboard With Business Intelligence Slides PDF. This layout presents information on Active Activities, Completed Activities, Active Tasks . It is also available for immediate download and adjustment. So, changes can be made in the color, design, graphics or any other component to create a unique layout.

Business Key Performance Metrics Review Dashboard Portrait PDF
The following slide shows a dashboard of sales strategy review of firm that can be used by marketing, product, finance managers for reviewing the business. It further includes KPI that are revenue, new customer, gross profit purchaser satisfaction, income comparison, sales categories and profitability. Showcasing this set of slides titled Business Key Performance Metrics Review Dashboard Portrait PDF. The topics addressed in these templates are Sales, Revenue Comparison, Profitability. All the content presented in this PPT design is completely editable. Download it and make adjustments in color, background, font etc. as per your unique business setting.

Startup Business Financial Dashboard With Key Metrics Sample PDF
This slide represents the financial dashboard for startup company with key performance indicators. It includes details related to current working capital, cash conversion cycle in days and vendor payment error rate. Pitch your topic with ease and precision using this Startup Business Financial Dashboard With Key Metrics Sample PDF. This layout presents information on Cash Conversion Cycle, Current Working Capital, Current Liabilities Debt. It is also available for immediate download and adjustment. So, changes can be made in the color, design, graphics or any other component to create a unique layout.

Kpi Dashboard To Track Owned Media Metrics Rules PDF
This slide brings forth a dashboard to track the performance of earned media channels which can be used by brand managers to get a brief idea about the effectiveness of the marketing strategy. Key performing indicators include number of conversions, conversion rate, backlinks published etc. Pitch your topic with ease and precision using this Kpi Dashboard To Track Owned Media Metrics Rules PDF. This layout presents information on Conversions, Backlinks Published, Metrics. It is also available for immediate download and adjustment. So, changes can be made in the color, design, graphics or any other component to create a unique layout.
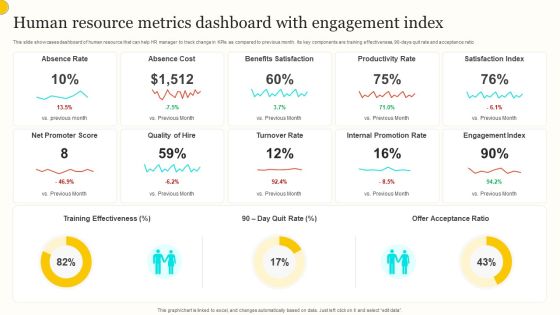
Human Resource Metrics Dashboard With Engagement Index Guidelines PDF
This slide showcases dashboard of human resource that can help HR manager to track change in KPIs as compared to previous month. Its key components are training effectiveness, 90 days quit rate and acceptance ratio. Pitch your topic with ease and precision using this Human Resource Metrics Dashboard With Engagement Index Guidelines PDF. This layout presents information on Absence Rate, Absence Cost, Benefits Satisfaction. It is also available for immediate download and adjustment. So, changes can be made in the color, design, graphics or any other component to create a unique layout.

Dashboard For Email Communication Kpis Metrics Topics PDF
This slide showcases email communication KPIs and dashboard that can help to keep track of performance of email marketing campaign. Its key elements are number of campaign, total recipients, average open percent and average click percent. Showcasing this set of slides titled Dashboard For Email Communication Kpis Metrics Topics PDF. The topics addressed in these templates are Number Campaigns, Total Recipients, Engagement Distribution. All the content presented in this PPT design is completely editable. Download it and make adjustments in color, background, font etc. as per your unique business setting.

Staff Turnover Key Performance Indicators Dashboard Sample PDF
The following slide highlights the staff turnover key performance Indicators dashboard illustrating employee turn over, turn over rate, average tenure, turnover per quarter, turnover per department, turnover type, turnover time period, turnover per position and turnover reasons Deliver and pitch your topic in the best possible manner with this Staff Turnover Key Performance Indicators Dashboard Sample PDF Use them to share invaluable insights on Management Goals, Subjective Appraisal, Product Defects and impress your audience. This template can be altered and modified as per your expectations. So, grab it now.
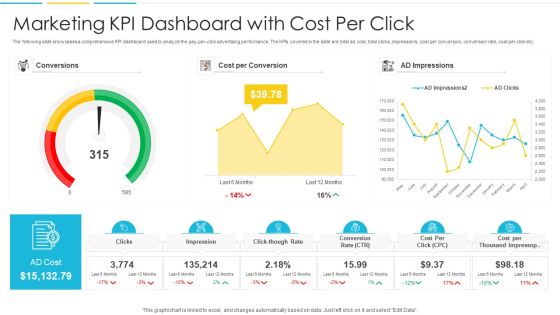
Marketing KPI Dashboard With Cost Per Click Infographics PDF
The following slide showcases a comprehensive KPI dashboard used to analyze the pay-per-click advertising performance. The KPIs covered in the slide are total ad cost, total clicks, impressions, cost per conversion, conversion rate, cost per click etc. Pitch your topic with ease and precision using this Marketing KPI Dashboard With Cost Per Click Infographics PDF. This layout presents information on Conversions, Cost, Impressions. It is also available for immediate download and adjustment. So, changes can be made in the color, design, graphics or any other component to create a unique layout.
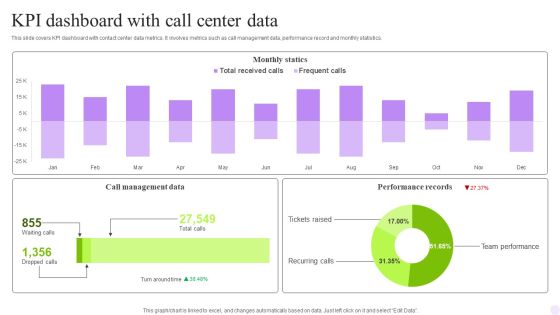
KPI Dashboard With Call Center Data Rules PDF
This slide covers contact center performance metrics KPI dashboard. It involves details such as number of total calls, average answer speed, abandon rate, data of agents performance and call abandon rate by departments. Pitch your topic with ease and precision using this KPI Dashboard With Call Center Data Rules PDF. This layout presents information on Monthly Statics, Management Data, Performance Records. It is also available for immediate download and adjustment. So, changes can be made in the color, design, graphics or any other component to create a unique layout.

Company Payout Dashboard Representing Accounts Payable Data Introduction PDF
The slide demonstrates a payment dashboard to measure and manage accounts payable. Various elements included are payable account, overdue, cash on hand, accounts payable funnel, invoice status, etc. Pitch your topic with ease and precision using this Company Payout Dashboard Representing Accounts Payable Data Introduction PDF. This layout presents information on Payable Accounts, Overdue, Invoices By Status, Account Payable Age. It is also available for immediate download and adjustment. So, changes can be made in the color, design, graphics or any other component to create a unique layout.

Call Center Metrics Dashboard With Key Metrics Information PDF
Mentioned slide outlines various call center KPIs dashboard. Call resolution in the current and previous month, agents schedule adherence today, currently active and waiting calls are some of the key metrics mentioned in the slide. Showcasing this set of slides titled Call Center Metrics Dashboard With Key Metrics Information PDF. The topics addressed in these templates are Currently Active, Call Resolution, Key Metrics. All the content presented in this PPT design is completely editable. Download it and make adjustments in color, background, font etc. as per your unique business setting.
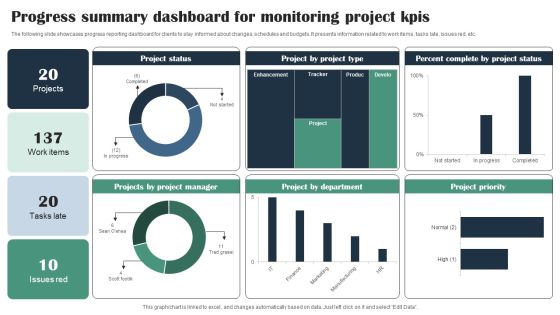
Progress Summary Dashboard For Monitoring Project Kpis Infographics PDF
The following slide showcases progress reporting dashboard for clients to stay informed about changes, schedules and budgets. It presents information related to work items, tasks late, issues red, etc. Pitch your topic with ease and precision using this Progress Summary Dashboard For Monitoring Project Kpis Infographics PDF. This layout presents information on Project Status, Project Manager, Project Type, Percent Complete. It is also available for immediate download and adjustment. So, changes can be made in the color, design, graphics or any other component to create a unique layout.

Project Metrics Dashboard With Due Tasks Microsoft PDF
This slide shows the project management dashboard which includes hours taken by client, account manager, service, actual working hours, description of services such as web programming, search engine optimization, graphic designing, etc. Pitch your topic with ease and precision using this Project Metrics Dashboard With Due Tasks Microsoft PDF. This layout presents information on Service, Optimization, Graphic Design. It is also available for immediate download and adjustment. So, changes can be made in the color, design, graphics or any other component to create a unique layout.

Quarterly Cost Variance Analysis With Maintenance Metrics Dashboard Information PDF
The following slide depicts a maintenance KPI dashboard to have useful insights for effective decision making. It includes key performance areas such as quarterly cost variance, scrap, quarterly run time variance analysis etc. Pitch your topic with ease and precision using this Quarterly Cost Variance Analysis With Maintenance Metrics Dashboard Information PDF. This layout presents information on Production, Budgeted Cost, Planned Run Time, Actual Run Time. It is also available for immediate download and adjustment. So, changes can be made in the color, design, graphics or any other component to create a unique layout.

KPI Dashboard For Modernizing Hospitality Business Inspiration PDF
The following slide showcases dashboard to track data and perform analytics for managing staff, ordering supplies and to maintain customer satisfaction. It presents information related to expenses, sales, etc. Pitch your topic with ease and precision using this KPI Dashboard For Modernizing Hospitality Business Inspiration PDF. This layout presents information on Fiscal Year, Labor, Modernizing Hospitality. It is also available for immediate download and adjustment. So, changes can be made in the color, design, graphics or any other component to create a unique layout.
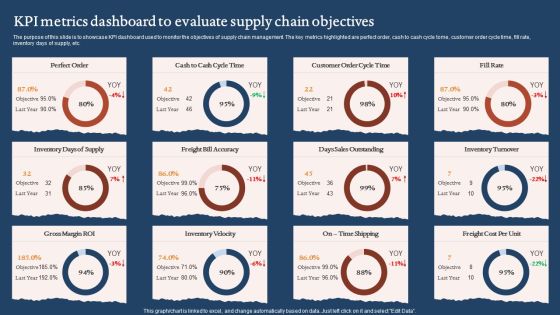
KPI Metrics Dashboard To Evaluate Supply Chain Objectives Graphics PDF
The purpose of this slide is to showcase KPI dashboard used to monitor the objectives of supply chain management. The key metrics highlighted are perfect order, cash to cash cycle tome, customer order cycle time, fill rate, inventory days of supply, etc. Pitch your topic with ease and precision using this KPI Metrics Dashboard To Evaluate Supply Chain Objectives Graphics PDF. This layout presents information on Days Sales Outstanding, Inventory Velocity, Gross Margin Roi. It is also available for immediate download and adjustment. So, changes can be made in the color, design, graphics or any other component to create a unique layout.
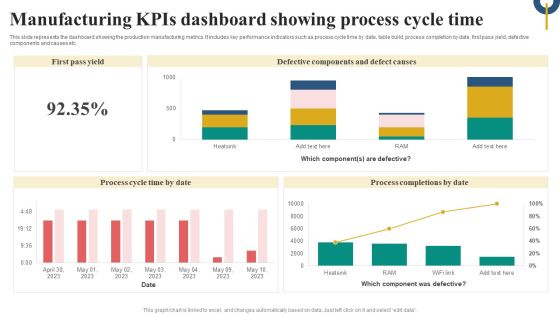
Manufacturing Kpis Dashboard Showing Process Cycle Time Microsoft PDF
This slide represents the dashboard showing the production manufacturing metrics. It includes key performance indicators such as process cycle time by date, table build, process completion by date, first pass yield, defective components and causes etc. Pitch your topic with ease and precision using this Manufacturing Kpis Dashboard Showing Process Cycle Time Microsoft PDF. This layout presents information on Defective Components Defect Causes, Process Cycle, Time By Date, Process Completions By Date. It is also available for immediate download and adjustment. So, changes can be made in the color, design, graphics or any other component to create a unique layout.
