AI PPT Maker
Templates
PPT Bundles
Design Services
Business PPTs
Business Plan
Management
Strategy
Introduction PPT
Roadmap
Self Introduction
Timelines
Process
Marketing
Agenda
Technology
Medical
Startup Business Plan
Cyber Security
Dashboards
SWOT
Proposals
Education
Pitch Deck
Digital Marketing
KPIs
Project Management
Product Management
Artificial Intelligence
Target Market
Communication
Supply Chain
Google Slides
Research Services
 One Pagers
All Categories
-
Home
- Customer Favorites
- Ethics
Ethics

Business Framework Threat Matrix PowerPoint Presentation
A four dimensional matrix has been used to design this power point diagram template. This PPT diagram contains the threat matrix. Display multiple values in your business presentation by using this PPT.
Business Diagram Four Stages Process With Percentage Presentation Template
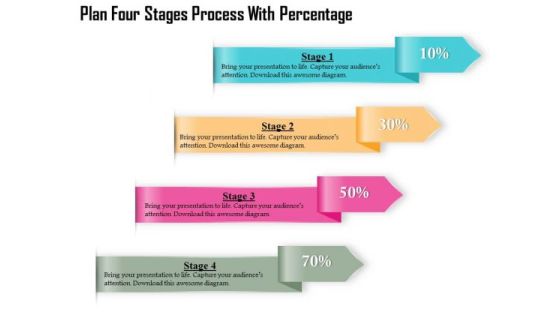
Four multicolored tags in vertical order has been used to decorate this business diagram. This diagram contains the concept of financial data display with percent values. This diagram can be used for management and finance related presentations.

Business Diagram Three Stages Process Percentage Presentation Template
Three multicolored tags in vertical order has been used to decorate this business diagram. This diagram contains the concept of financial data display with percent values. This diagram can be used for management and finance related presentations.

Business Diagram Business Progress Report Design Presentation Template
Come forth with the plans you have so carefully laid out. Use this business consulting diagram to inject values into your group and see them bond to achieve success. Excite your audience with the brilliance of your thoughts

Stock Photo Globe On Dollars And Key PowerPoint Slide
This amazing image has been designed with globe on dollar bills with silver key. This conceptual image slide may be used to display value of dollar around the world. Accelerate the impact of your ideas using this image.

Stock Photo Globe On Dollars With Key PowerPoint Slide
This professional image slide has been designed with globe on dollar bills with golden key. This conceptual image may be used to display value of dollar around the world. Accelerate the impact of your ideas using this image.

Business Diagram Mobile Applications Vector Illustration Concept Presentation Template
As mobile have become an indispensible part of our daily lives. This amazing mobile application icons will also add great value to your ideas and presentations in the fields of telecommunications, travelling, banks and financial institutions, e-Learning etc.
Business Framework Editable Thermometer Graphic PowerPoint Presentation
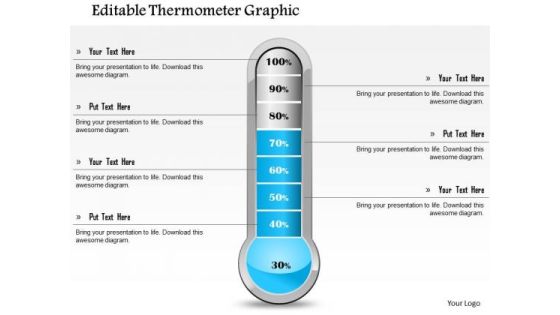
This Power Point template slide has been crafted with graphic of meter. This meter contains the max and min value. Use this PPt for your technical presentation and display your technical specifications in a graphical way.
Business Diagram Dollar For Business And Finance Processes Presentation Template
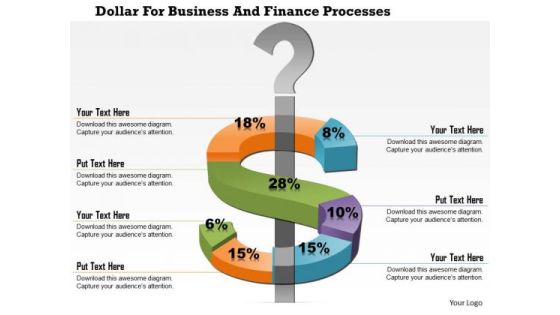
This business diagram displays dollar symbol around a question mark. This diagram depicts change in dollar currency value. Use this slide to make financial and business reports and presentations.
Stock Photo Bar Graph With Percentage For Finance PowerPoint Slide
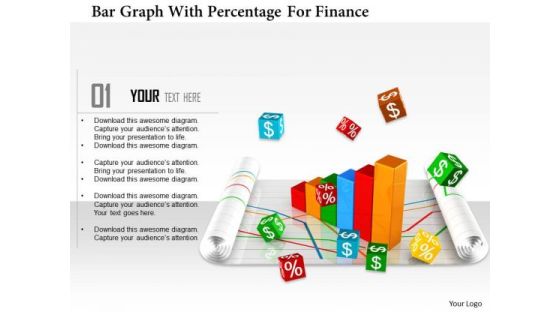
This Power Point template has been designed with graphic of bar graph and percentage value. This image slide contains the concept of finance and accounting. Use this editable diagram for your business and finance related presentations.

Stock Photo Hundred Percentage Inside Lock Safety PowerPoint Slide
Concept of financial safety has been displayed in this image slide with suitable graphics. This slide has been designed with graphic of hundred percentage value and lock. Use this professional slide to make build innovative presentation on safety related topics.

Business Framework 10 Percent To 90 Percent PowerPoint Presentation
This business diagram has been designed with graphic of multiple pie graphs. This diagram slide contains the concept of result analysis with percentage values. Use this diagram to present and compare data in an impressive manner
Business Diagram Human Icons With Bubbles And Different Icons Inside PowerPoint Slide
This diagram displays graph with percentage value growth. This business slide is suitable to present and compare business data. Use this diagram to build professional presentations for your viewers.

Business Diagram Diagram For Visual Data Display Presentation Template
Four colored cylindrical bars with percentage values are used to design this power point template. This diagram slide helps to display financial data analysis. Use this diagram for your business and finance related presentations.
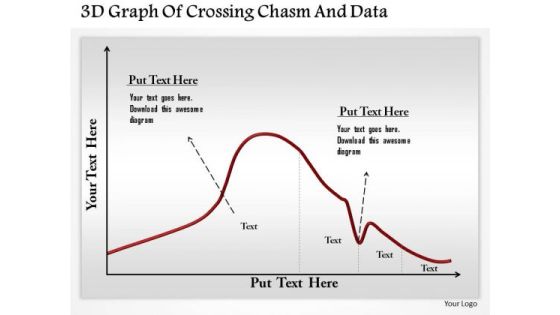
Business Diagram 3d Graph Of Crossing Chasm And Data Presentation Template
This business diagram has been designed with graphic of 3d graph. This slide contains the concept of chasm and data calculation. Use this slide to display chasm crossing condition. This business diagram adds value to your ideas.
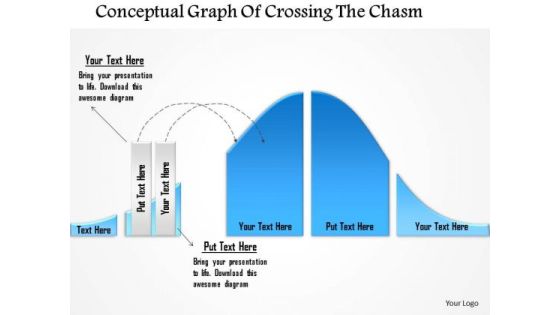
Business Diagram Conceptual Graph Of Crossing The Chasm Presentation Template
This business diagram has been designed with graphic of 3d graph. This slide contains the concept of chasm and data calculation. Use this slide to display chasm crossing condition. This business diagram adds value to your ideas.
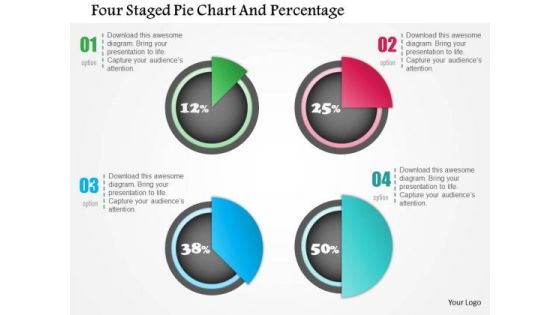
Business Diagram Four Staged Pie Chart And Percentage Presentation Template
Four staged pie chart and percentage values has been used to design this power point template. This PPT contains the concept of financial result analysis. Use this PPT for business and marketing related presentations.

Stock Photo Dollar Notes With Percent Symbols PowerPoint Slide
Our above image displays graphics of percent symbol on dollars. This image slide is designed to depict money value. This image will help to express your views in your presentations.

Stock Photo Percent Symbol On Stack Of Dollars PowerPoint Slide
Our above image displays graphics of percent symbol on dollars. This image slide is designed to depict money value. This image will help to express your views in your presentations.
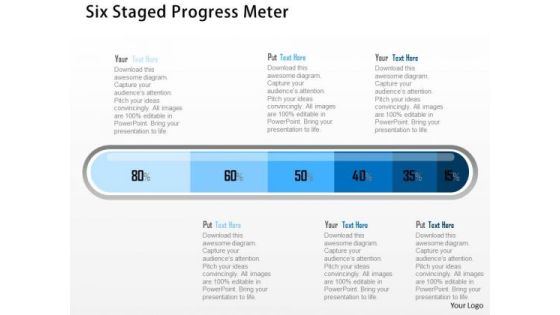
Business Diagram Six Staged Progress Meter Presentation Template
Our above business slide displays graphics of progress meter. This slide can be used as value chain example. This diagram provides an effective way of displaying information you can edit text, color, shade and style as per you need.

Business Diagram Circles For Accounting Equation PowerPoint Templates
Graphic of Venn diagram with percentage value has been used to design this business diagram. These circles may also be used to depict accounting equations. Use this diagram to illustrate your thoughts and experiences to your staff.

Bottles Displaying Growth Levels PowerPoint Template
The above template displays a diagram of bottles. This diagram has been professionally designed to emphasize on concept of value stream mapping. Grab centre stage with this slide. Capture the attention of your audience.
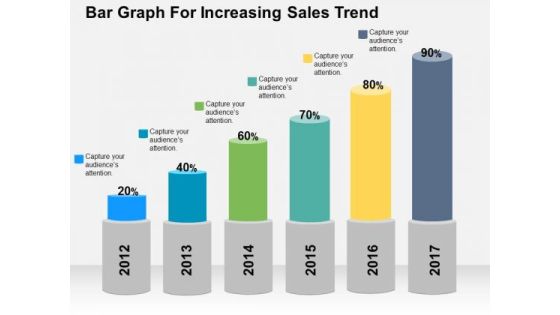
Bar Graph For Increasing Sales Trend PowerPoint Template
Deliver amazing presentations with our above template showing bar graph with percentage values. You may download this slide to depict increase in sales trends. Capture the attention of your audience using this diagram.
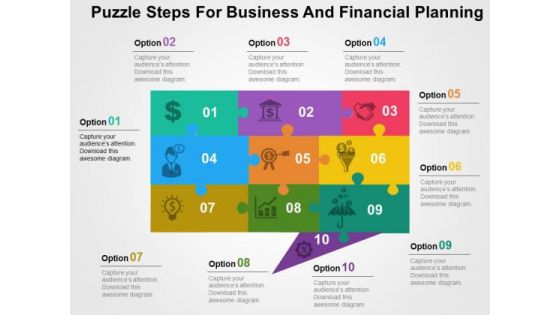
Puzzle Steps For Business And Financial Planning PowerPoint Templates
This creative slide has been designed with graphics of puzzle steps. Use this unique slide in presentations related to business and financial planning. This template adds value to your idea.

People Thoughts For Business Planning PowerPoint Templates
This creative slide has been designed with graphics of team icons. Use this unique slide in presentations related to business and financial planning. This template adds value to your idea.

Business Team Standing In Rings PowerPoint Templates
This slide contains graphics of business team standing in rings. This slide helps to portray concepts like team planning and business strategies. This PowerPoint template adds value to your presentation
Test Tubes With Financial Data In Percentage Ratio Powerpoint Slides
This PowerPoint template contains graphics of test tubes with percentage values. You may download this PPT slide design to display financial ratio analysis. You can easily customize this template to make it more unique as per your need.
Five Mountain Chart With Icons For Financial Analysis Powerpoint Slides
Our above PPT slide contains five mountains with icons and financial values. This PowerPoint template helps to exhibit financial analysis for business growth. Use this diagram to impart more clarity to subject and to create more sound impact on viewers.

Bar Graph For Statistical Analysis Powerpoint Slides
This PowerPoint template has been designed with bar chart and percentage values. You may download this PPT slide to depict statistical analysis. Add this slide to your presentation and impress your superiors.

Percentage Chart For Good Marketing Strategy Powerpoint Slides
This PowerPoint template has been designed with pie chart and percentage values. The PowerPoint template has a high quality design. You can download this PowerPoint slide to make good marketing strategy and business plans.

Four Business Option Banner Diagram Powerpoint Template
This business slide contains four option banners with business icons. This PPT diagram is suitable to present concept of profit growth value analysis. Visual effect of this diagram provides more clarity to the subject.

Four Text Tags For Process Flow Powerpoint Template
This PPT slide contains four text tags with business icons. This PPT diagram is suitable to present concept of profit growth value analysis. Enlighten others on the process with this innovative PowerPoint template.

Seven Steps Semicircular Infographic Chart Powerpoint Template
This business slide contains four option banners with business icons. This PPT diagram is suitable to present concept of profit growth value analysis. Visual effect of this diagram provides more clarity to the subject.

Four Tags For Financial Review And Analysis Powerpoint Slides
This PowerPoint template has been designed with four tags and financial values. This PowerPoint template helps to exhibit financial review and analysis. Use this diagram slide to build an exclusive presentation.

Four Steps For Financial Data Analysis Powerpoint Slides
This PowerPoint contains four circles with percentage values. Download this diagram slide to display financial data analysis. This template is editable, You can edit text, color, shade and style of this diagram as per you need.
Four Overlapping Steps With Icons Powerpoint Template
This PPT slide contains four overlapping steps with business icons. This PPT diagram is suitable to present concept of profit growth value analysis. Enlighten others on the process with this innovative PowerPoint template.
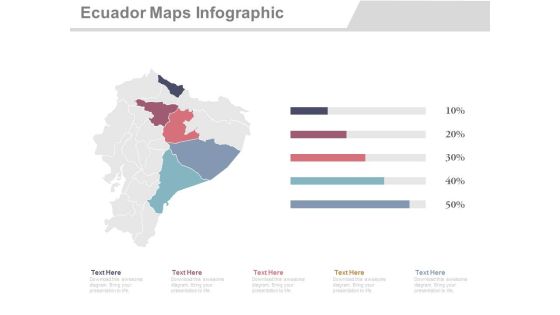
Ecuador Map With States Economic Analysis Powerpoint Slides
This PowerPoint template displays graphics of Ecuador map with different locations and percentage values. This Map template can be used in business presentations to depict economic analysis. This slide can also be used by school students for educational projects.
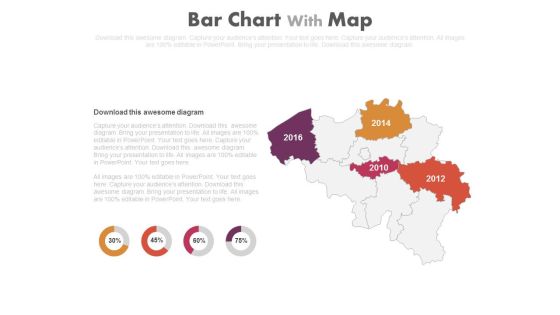
Map With Years And Percentage Charts Powerpoint Slides
This PowerPoint template displays map with years and percentage values. Our professionally designed map diagram is as an effective tool to display economic progress survey of particular areas. Above slide provide ideal backdrop to make business presentations.

Four Months Sales Statistics Chart Powerpoint Slides
This PowerPoint template has been designed with four shopping bags with percentage values. Download this PPT slide to display four months sales statistics. Add this slide to your presentation and impress your superiors.

Arrows Matrix For Business Vision Analysis Powerpoint Slides
This PowerPoint template has been designed with arrow matrix diagram. You may download this diagram slide to depict company?s vision, mission, goal and values. Add this slide to your presentation and impress your superiors.
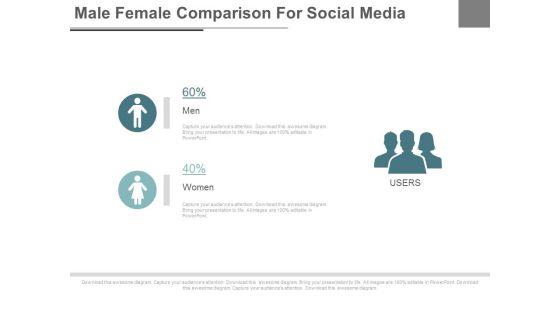
Male Female Social Media Users Powerpoint Slides
This PPT slide displays graphics of male female icons with percentage values. Use this PPT design to display male female ratios of social media users. This PowerPoint template can be customized as per requirements of business presentation.

Percentage Charts For Statistical Comparison Powerpoint Slides
This PowerPoint template has been chart of percentage values. You may download this diagram for statistical comparison and analysis. Add this PPT slide to your presentation and impress your superiors.

Bar Graph For Profit Growth Analysis Powerpoint Slides
This PowerPoint template has been designed with bar graph with percentage values. This diagram is useful to exhibit profit growth analysis. This diagram slide can be used to make impressive presentations.
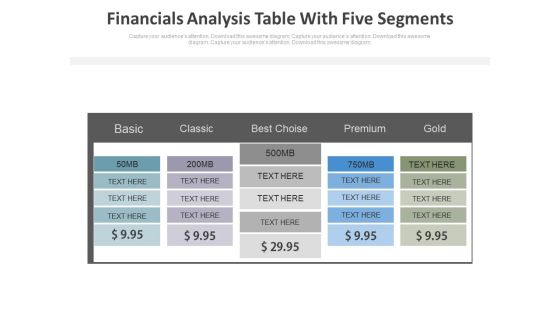
Five Steps Financial Analysis Table Powerpoint Slides
This PowerPoint template has been designed with dollar value pricing table chart. This PPT slide may be used for sample marketing proposal. Download this slide to build unique presentation.
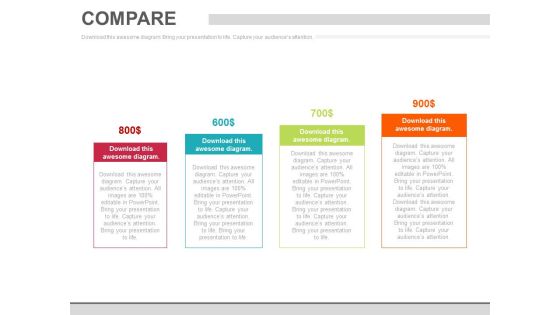
Four Steps Pricing Option Chart Powerpoint Slides
This PowerPoint template has been designed with dollar value pricing table chart. This PPT slide may be used for sample marketing proposal. Download this slide to build unique presentation.
Four Steps Pricing Table With Icons Powerpoint Slides
This PowerPoint template has been designed with dollar value pricing table chart. This PPT slide may be used for sample marketing proposal. Download this slide to build unique presentation.
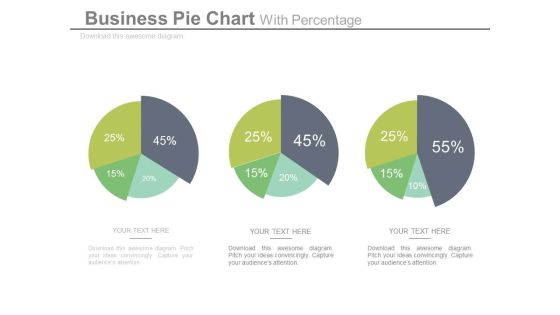
Pie Charts For Relative Comparison Study Powerpoint Slides
This power point template illustrates diagram of three pie charts with percentage values. This business slide can be used for relative comparison study. Present your views and ideas with this impressive slide.
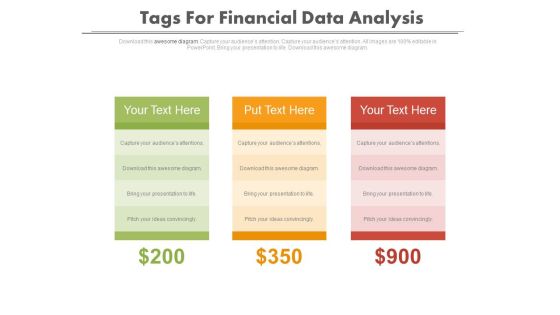
Tags For Financial Data Comparison Powerpoint Slides
Graphic of three text tag with dollar values has been used to design this power point template. This diagram may be used for financial data comparison. Use this diagram to build a professional presentation.

Map Diagram With Four Locations Powerpoint Slides
This PowerPoint template displays graphics of map diagram with four locations and percentage values. This Map template can be used in business presentations to depict economic analysis. This slide can also be used by school students for educational projects.
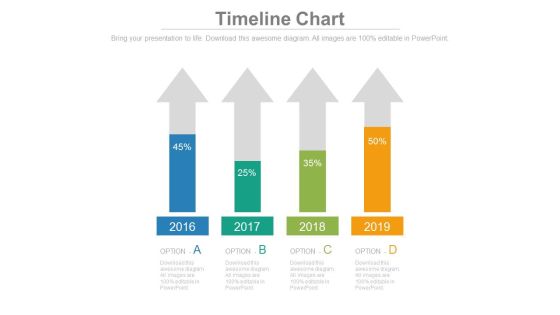
Four Arrows With Percentage Data Analysis Powerpoint Slides
This timeline template can be used for multiple purposes including financial planning, new milestones and tasks. It contains four upward arrows with percentage values. Download this PowerPoint timeline template to make impressive presentations.

Bar Graph With Increasing Percentage Flow Powerpoint Slides
This PowerPoint slide has been designed with bar graph and increasing percentage values. This diagram slide may be used to display profit growth. Prove the viability of your ideas with this professional slide.

Chart For Financial Percentage Analysis Powerpoint Slides
This PowerPoint template has been designed with financial chart with dollar icon. This PPT slide may be used to display dollar value analysis chart. Download this slide to build unique presentation.
Market Trends Chart With Percentage And Icons Powerpoint Slides
This PowerPoint template has been designed with graphics of chart with percentage values and icons. This PowerPoint template may be used to market trends and financial analysis. Prove the viability of your ideas using this impressive slide.

Skill Assessment Chart For Employee Performance Powerpoint Slides
Sliders with percentage values have been displayed in this business slide. This business diagram may be used as skill assessment chart. Download this PowerPoint template to build an exclusive presentation.

Three Person Tags With Skill Percentage Charts Powerpoint Slides
This PowerPoint template has been designed with three person?s tags with percentage values. This Info graphic diagram may be used to display team skill analysis. Download this impressive diagram to build unique presentations.

Column Chart For Financial Analysis Powerpoint Slides
This PowerPoint template has been designed with graphics of column chart with percentage values. You may use this business slide design for topics like financial analysis and planning. This PPT slide is powerful tool to describe your ideas.

Two Teams Performance Analysis Chart Powerpoint Slides
This PowerPoint template has been designed with icons of two teams with percentage values. Download this PPT slide to depict team?s performance analysis. Deliver amazing presentations to mesmerize your audience by using this PPT slide design.

Water Drop Diagram With Percentage Chart Powerpoint Template
This PPT slide has been designed with graphics of water drop with percentage values. Download this PowerPoint template to depict business investments and savings. Imprint your concepts with this professional slide in your presentations.?
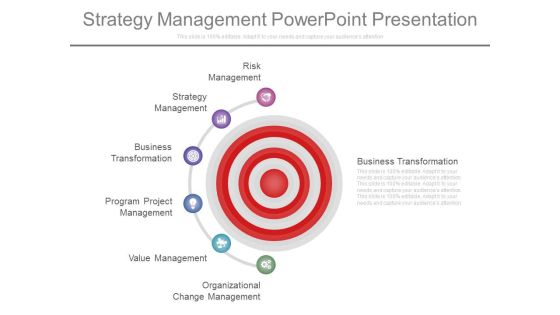
Strategy Management Power Point Presentation
This is a strategy management power point presentation. This is a six stage process. The stages in this process are risk management, strategy management, business transformation, program project management, value management, organizational change management.

Business Strategic Execution Powepoint Slide Presentation Examples
This is a business strategic execution powepoint slide presentation examples. This is a five stage process. The stages in this process are client satisfaction, business strategic execution, strategic finance, enterprise value, strategy clarity.
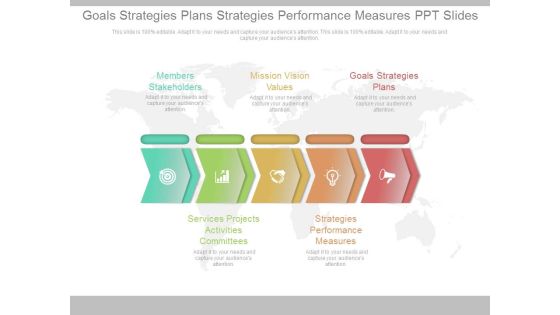
Goals Strategies Plans Strategies Performance Measures Ppt Slides
This is a goals strategies plans strategies performance measures ppt slides. This is a five stage process. The stages in this process are members stakeholders, mission vision values, goals strategies plans, services projects activities committees, strategies performance measures.
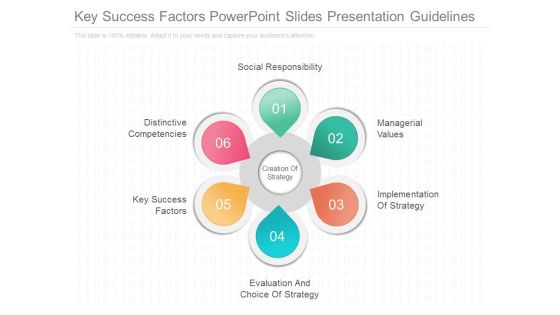
Key Success Factors Powerpoint Slides Presentation Guidelines
This is a key success factors powerpoint slides presentation guidelines. This is a six stage process. The stages in this process are social responsibility, distinctive competencies, managerial values, key success factors, evaluation and choice of strategy, implementation of strategy.

Organizational Structure Presentation Powerpoint Example
This is an organizational structure presentation powerpoint example. This is a six stage process. The stages in this process are organizational structure, roles and responsibilities, leadership team roles, work flow analysis, productivity measures, valuing diverse contributions.
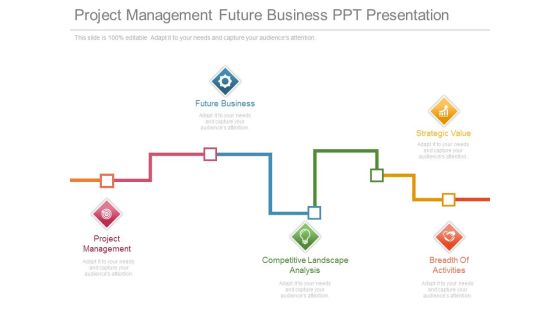
Project Management Future Business Ppt Presentation
This is a project management future business ppt presentation. This is a five stage process. The stages in this process are future business, strategic value, project management, competitive landscape analysis, breadth of activities.
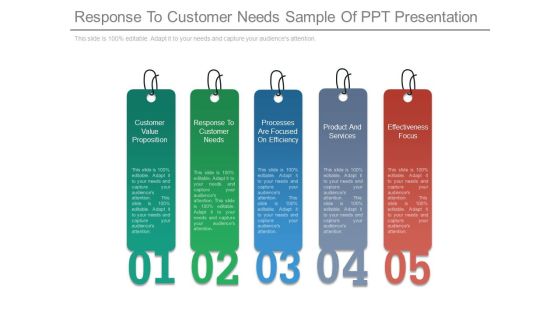
Response To Customer Needs Sample Of Ppt Presentation
This is a response to customer needs sample of ppt presentation. This is a five stage process. The stages in this process are customer value proposition, response to customer needs, processes are focused on efficiency, product and services, effectiveness focus.
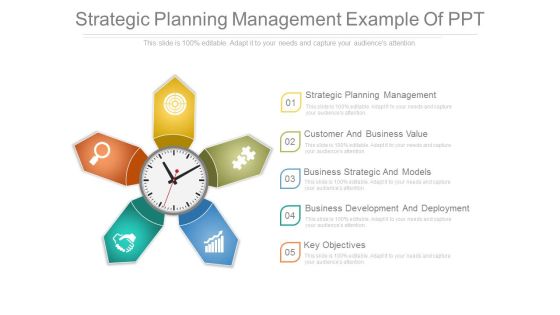
Strategic Planning Management Example Of Ppt
This is a strategic planning management example of ppt. This is a five stage process. The stages in this process are strategic planning management, customer and business value, business strategic and models, business development and deployment, key objectives.

Feature And Function Presentation Powerpoint Example
This is a feature and function presentation powerpoint example. This is a five stage process. The stages in this process are feature and function, interface to existing, ease of installation, value to customer, ease of use.

Account Fact Finding Powerpoint Slides Design Templates
This is a account fact finding powerpoint slides design templates. This is a one stage process. The stages in this process are proof of market value, account fact finding, account targeting, business development, target market focus.

Benefits And Attractiveness Powerpoint Graphics
This is a benefits and attractiveness powerpoint graphics. This is a four stage process. The stages in this process are sustainable advantage, across value chain, benefits and attractiveness, team domains.

Core Component Of Successful Online Marketing Strategy Ppt Slides
This is a core component of successful online marketing strategy ppt slides. This is a three stage process. The stages in this process are core component of successful, online marketing strategy, successful brand value.
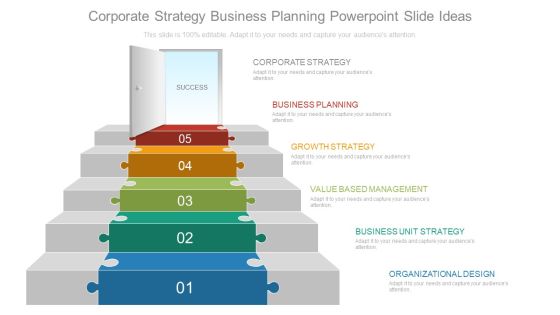
Corporate Strategy Business Planning Powerpoint Slide Ideas

Customer Evaluation Powerpoint Slide Designs Download
This is a customer evaluation powerpoint slide designs download. This is a seven stage process. The stages in this process are customer evaluation, sales channels, incentive comp and quotas, sales process, sales roles and structure, value proposition.
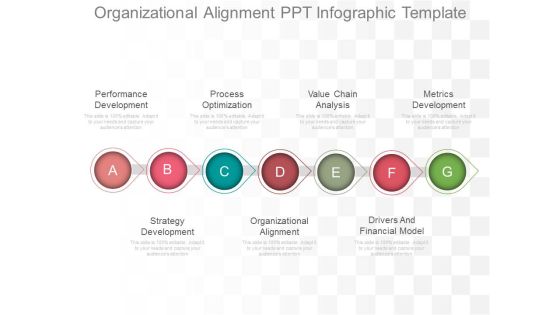
Organizational Alignment Ppt Infographic Template
This is a organizational alignment ppt infographic template. This is a seven stage process. The stages in this process are performance development, process optimization, value chain analysis, metrics development, strategy development, organizational alignment, drivers and financial model.
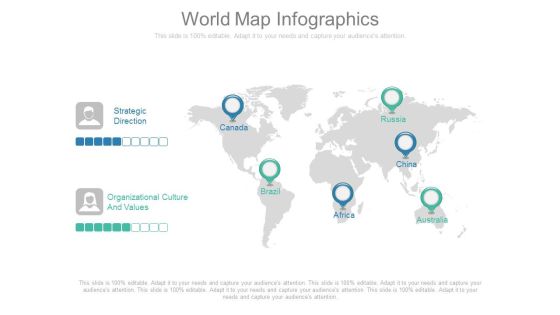
World Map Infographics Sample
This is a world map infographics sample. This is a two stage process. The stages in this process are strategic direction, organizational culture and values, canada, brazil, russia, china, africa, australia.

Targeted Customer Cost Structure Ppt Sample File
This is a targeted customer cost structure ppt sample file. This is a seven stage process. The stages in this process are life time value, customer segments, targeted customer, key metrics, key activity, cost structure, gross margin.

The Business Model Powerpoint Slides Presentation Guidelines
This is a the business model powerpoint slides presentation guidelines. This is a four stage process. The stages in this process are the value proposition, the business model, market entry strategy, quantity purchased by customer.

Understand Your Target Audience Powerpoint Presentation
This is an understand your target audience powerpoint presentation. This is a three stage process. The stages in this process are understand your target audience, value proposition, marketing strategy.

Deliverables Project Management Presentation Examples
This is a deliverables project management presentation examples. This is a five stage process. The stages in this process are feasibility study, project knowledge base, earned value analysis, project portfolio analysis, project management plan.
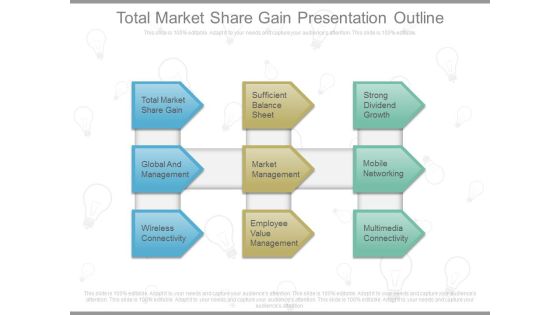
Total Market Share Gain Presentation Outline
This is a total market share gain presentation outline. This is a nine stage process. The stages in this process are total market share gain, global and management, wireless connectivity, sufficient balance sheet, market management, employee value management, mobile networking.

Competency Model Presentation Background Images
This is a competency model presentation background images. This is a six stage process. The stages in this process are competency model, strategic alignment, business outcomes, senior leadership, valuing people, knowing the business.
Integrated Service Management Ppt Slide
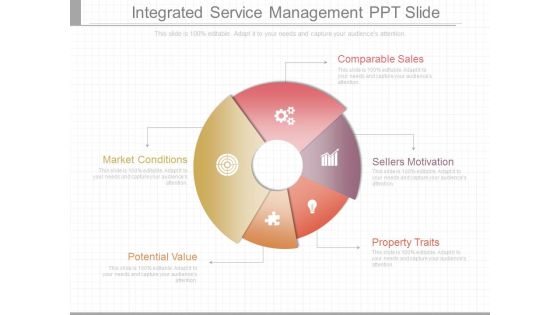
This is a integrated service management ppt slide. This is a five stage process. The stages in this process are comparable sales, sellers motivation, property traits, potential value, market conditions.
Strategic Business Model Timeline Example Ppt Presentation
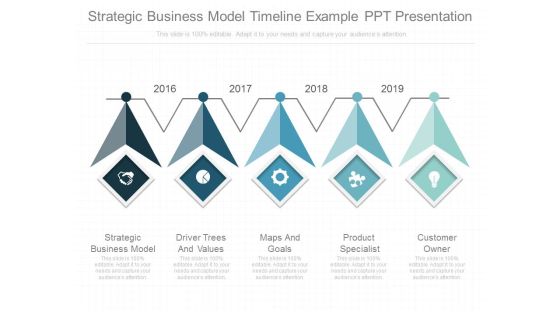
This is a strategic business model timeline example ppt presentation. This is a five stage process. The stages in this process are strategic business model, driver trees and values, maps and goals, product specialist, customer owner.
Opportunity Assessment Powerpoint Show
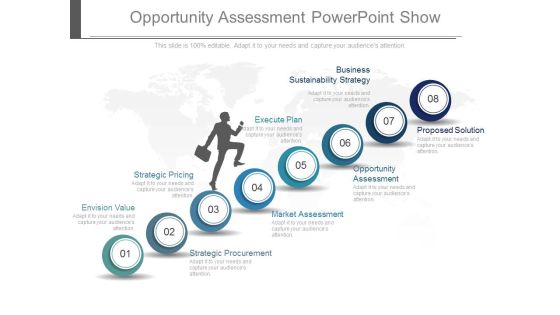
This is a opportunity assessment powerpoint show. This is a eight stage process. The stages in this process are business sustainability strategy, execute plan, strategic pricing, envision value, proposed solution, opportunity assessment, market assessment, strategic procurement.
Strategic Procurement Powerpoint Show
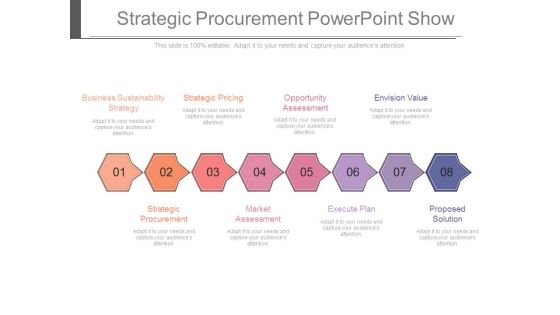
This is a strategic procurement powerpoint show. This is a eight stage process. The stages in this process are business sustainability strategy, strategic pricing, opportunity assessment, envision value, strategic procurement, market assessment, execute plan, proposed solution.

Objectives Of Corporate Governance Ppt Diagrams
This is a objectives of corporate governance ppt diagrams. This is a five stage process. The stages in this process are legal and financial discipline, delivering values, accountability, transparency, stakeholder analysis.

Operation Management Strategy Example Ppt Samples
This is a operation management strategy example ppt samples. This is a five stage process. The stages in this process are low cost product, technical superiority, research development, product innovation, high value offerings.

Real Estate Market Analysis Presentation Design
This is a real estate market analysis presentation design. This is a five stage process. The stages in this process are comparable sales, sellers motivation, property traits, potential value, market conditions.
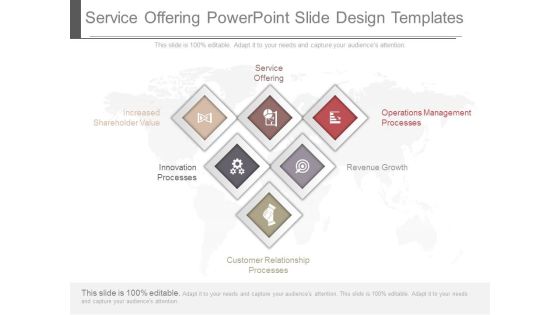
Service Offering Powerpoint Slides Design Templates
This is a service offering powerpoint slides design templates. This is a six stage process. The stages in this process are service offering, increased shareholder value, innovation processes, customer relationship processes, revenue growth, operations management processes.
Business Emerging Markets Powerpoint Ideas
This is a business emerging markets powerpoint ideas. This is a four stage process. The stages in this process are key resources, customer value proposition, profit formula, key processes.

Evolves Solution Powerpoint Slide Backgrounds
This is a evolves solution powerpoint slide backgrounds. This is a four stage process. The stages in this process are evolves solution, delivery value continuously, make safety prerequisite, test and refactor.

Build The Franchise Presentation Outline
This is a build the franchise presentation outline. This is a six stage process. The stages in this process are build the franchise, increase value to customer, improve cost structure, improve use of assets, product leadership, customer intimacy.

Customer Segmentation Powerpoint Slides
This is a customer segmentation powerpoint slides. This is a four stage process. The stages in this process are customer segmentation, price value maps, deal price optimization, price dispersion.
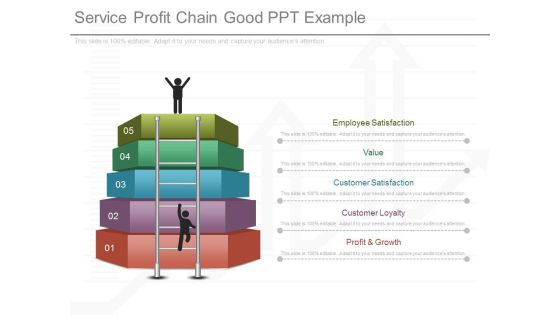
Service Profit Chain Good Ppt Example
This is a service profit chain good ppt example. This is a five stage process. The stages in this process are employee satisfaction, value, customer satisfaction, customer loyalty, profit and growth.

Strategic Business Model Powerpoint Presentation Examples
This is a strategic business model powerpoint presentation examples. This is a five stage process. The stages in this process are strategic business model, driver trees and values, maps and goals, product specialist, customer owner.
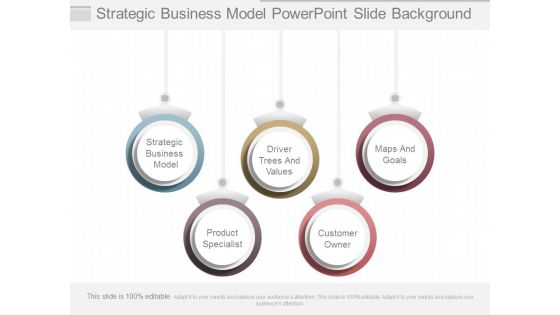
Strategic Business Model Powerpoint Slide Background
This is a strategic business model powerpoint slide background. This is a five stage process. The stages in this process are strategic business model, driver trees and values, maps and goals, product specialist, customer owner.

Performance Smartphone Comparison Presentation Visuals
This is a performance smartphone comparison presentation visuals. This is a seven stage process. The stages in this process are performance smartphone, higher performance, smartphone platform roadmap, highly integrated capabilities, future platforms, value smartphone, lower cost.
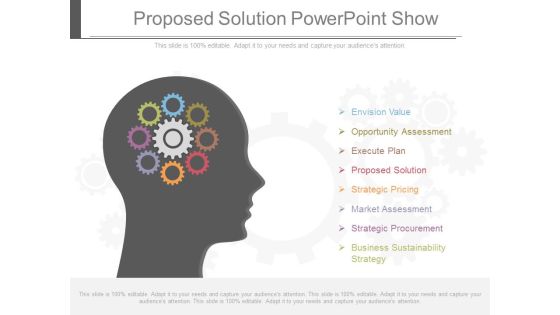
Proposed Solution Powerpoint Show
This is a project management process pricing ppt slide design. This is a eight stage process. The stages in this process are envision value, opportunity assessment, execute plan, proposed solution, strategic pricing, market assessment, strategic procurement, business sustainability strategy.
Provide The Technology Example Ppt Presentation
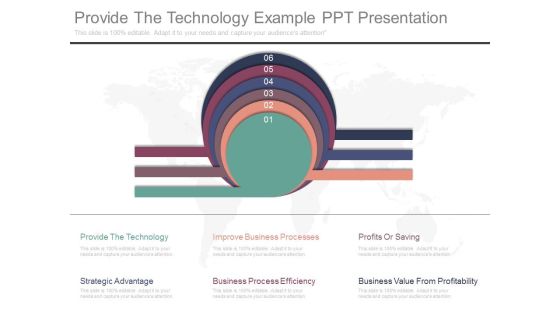
This is a provide the technology example ppt presentation. This is a six stage process. The stages in this process are provide the technology, improve business processes, profits or saving, strategic advantage, business process efficiency, business value from profitability.

Company And Products Ppt Slides
This is a company and products ppt slides. This is a five stage process. The stages in this process are delivery mechanisms, reputation management, competitive opportunity, company and products, value proposition.

Business Process Efficiency Example Ppt Presentation
This is a business process efficiency example ppt presentation. This is a six stage process. The stages in this process are business process efficiency, profits or saving, business value from profitability, provide the technology, strategic advantage, improve business processes.

Business Sustainability Strategy Powerpoint Show
This is a business sustainability strategy powerpoint show. This is a eight stage process. The stages in this process are opportunity assessment, envision value, proposed solution, execute plan, market assessment, strategic procurement, strategic pricing, business sustainability strategy.

Customer Relationship Processes Powerpoint Slide Design Templates
This is a customer relationship processes powerpoint slide design templates. This is a six stage process. The stages in this process are customer relationship processes, increased shareholder value, revenue growth, innovation processes, service offering, operations management processes.

Highly Integrated Capabilities Powerpoint Slides
This is a highly integrated capabilities powerpoint slides. This is a seven stage process. The stages in this process are smartphone platform roadmap, higher performance, performance smartphone, lower cost, highly integrated capabilities, future platforms, value smartphone.
Revenue Growth Powerpoint Slide Design Templates
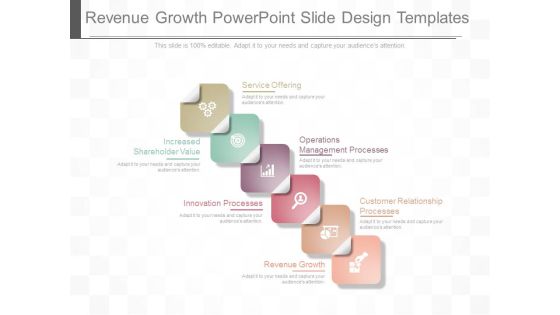
This is a revenue growth powerpoint slide design templates. This is a six stage process. The stages in this process are service offering, operations management processes, customer relationship processes, increased shareholder value, innovation processes, revenue growth.
Share Of Audience Shares By Users Example Of Ppt
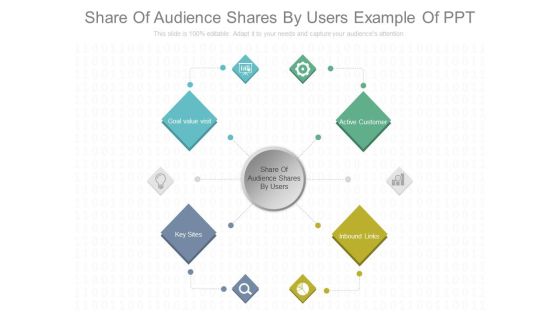
This is a share of audience shares by users example of ppt. This is a one stage process. The stages in this process are goal value visit, active customer, inbound links, key sites, share of audience shares by users.

Conversion Rates Powerpoint Slides Presentation Guidelines
This is a conversion rates powerpoint slides presentation guidelines. This is a five stage process. The stages in this process are conversion rates, sales vs target, repeat business loyalty, values and revenues, product holding.
Performance Driver Metrics Diagram Powerpoint Show
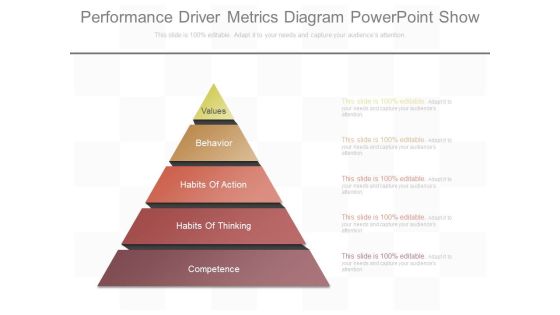
This is a performance driver metrics diagram powerpoint show. This is a five stage process. The stages in this process are values, behavior, habits of action, habits of thinking, competence.

Example Of Sales Pipeline Ppt Presentation Slides
This is a example of sales pipeline ppt presentation slides. This is a five stage process. The stages in this process are sales qualified leads, value proposition, proposal price quote, negotiation review, closed won.

Career Development Model Diagram Ppt Example
This is a career development model diagram ppt example. This is a four stage process. The stages in this process are create your future, know your value, plan your actions, explore your options.

Business Relationship Management Model Ppt Templates
This is a business relationship management model ppt templates. This is a four stage process. The stages in this process are brm competencies, servicing, exploring, demand shaping, value harvesting.

Basic Core Marketing Concepts Ppt Sample
This is a basic core marketing concepts ppt sample. This is a five stage process. The stages in this process are needs wants and demands, products and services, value satisfaction and quality, markets, exchange transactions and relationships.

Customer Retention Template Powerpoint Guide
This is a customer retention template powerpoint guide. This is a five stage process. The stages in this process are perceived value for money, overall satisfaction, brand strength, future intentions, advocacy, customer retention.

Smartphone Platform Roadmap Ppt Slide Themes
This is a smartphone platform roadmap ppt slide themes. This is a seven stage process. The stages in this process are smartphone platform roadmap, value smartphone, future platforms, highly integrated capabilities, higher performance, lower cost, performance smartphone.

Leadership Strategy Implementation Powerpoint Ideas
This is a leadership strategy implementation powerpoint ideas. This is a six stage process. The stages in this process are business success performance, culture and communication, information systems, core values, organizational capabilities.

Investments Delivering Result Powerpoint Templates
This is a investments delivering result powerpoint templates. This is a four stage process. The stages in this process are shareholder value creation, gaining market share, investments delivering result, strong earnings growth.

Customer Retention Ppt Diagram Powerpoint Topics
This is a customer retention ppt diagram powerpoint topics. This is a five stage process. The stages in this process are intention to recommend, intention to re purchase, overall satisfaction, perceived value for money, emotional commitment to brand.
Supply Chain Innovation Ppt Sample Download
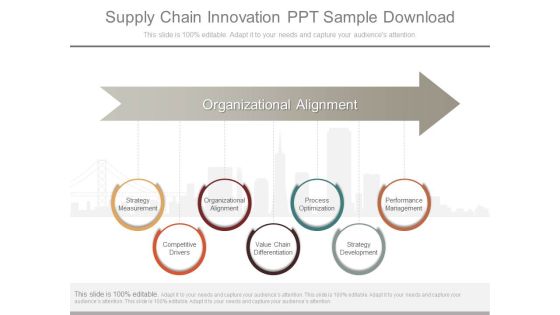
This is a supply chain innovation ppt sample download. This is a seven stage process. The stages in this process are strategy measurement, competitive drivers, organizational alignment, value chain differentiation, process optimization, strategy development, performance management.
Executive Information System Ppt Design
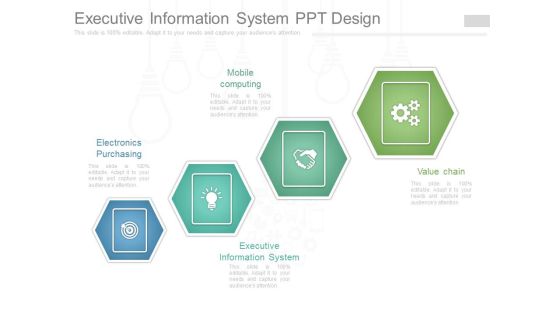
This is an executive information system ppt design. This is a four stage process. The stages in this process are electronics purchasing, mobile computing, value chain, executive information system.
Kpi Management Template Ppt Slides
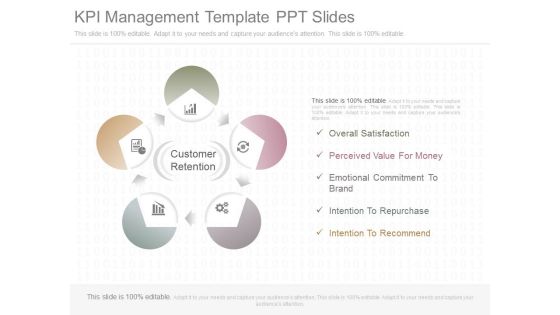
This is a kpi management template ppt slides. This is a five stage process. The stages in this process are overall satisfaction, perceived value for money, emotional commitment to brand, intention to repurchase, intention to recommend, customer retention.
Sample Industrial Control Concepts Ppt Presentation
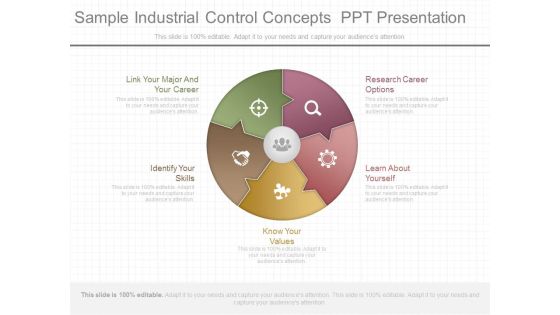
This is a sample industrial control concepts ppt presentation. This is a five stage process. The stages in this process are link your major and your career, identify your skills, know your values, research career options, learn about yourself.
