AI PPT Maker
Templates
PPT Bundles
Design Services
Business PPTs
Business Plan
Management
Strategy
Introduction PPT
Roadmap
Self Introduction
Timelines
Process
Marketing
Agenda
Technology
Medical
Startup Business Plan
Cyber Security
Dashboards
SWOT
Proposals
Education
Pitch Deck
Digital Marketing
KPIs
Project Management
Product Management
Artificial Intelligence
Target Market
Communication
Supply Chain
Google Slides
Research Services
 One Pagers
All Categories
-
Home
- Customer Favorites
- Enhancement
Enhancement

Cross Channel Marketing Benefits Key Benefits Of Using Omnichannel Marketing Infographics PDF
This slide shows key benefits of Omnichannel Marketing to the users such as Channel optimization, improved experience, high channel accessibility, audience segmentation, high brand loyalty, easy accessibility etc. This is a cross channel marketing benefits key benefits of using omnichannel marketing infographics pdf template with various stages. Focus and dispense information on five stages using this creative set, that comes with editable features. It contains large content boxes to add your information on topics like channel optimization, improve customer experience, improved loyalty, diversify audience, interact with the business. You can also showcase facts, figures, and other relevant content using this PPT layout. Grab it now.

Marketing Strategies For Auto Companies To Strongly Recover Post Covid 19 Ppt Infographic Template Pictures PDF
Mentioned slide displays information about marketing strategies like improve, website visibility, improve processes that will help auto companies to strongly recover post coronavirus. This is a marketing strategies for auto companies to strongly recover post covid 19 ppt infographic template pictures pdf template with various stages. Focus and dispense information on three stages using this creative set, that comes with editable features. It contains large content boxes to add your information on topics like services, improve, processes, customers, team. You can also showcase facts, figures, and other relevant content using this PPT layout. Grab it now.
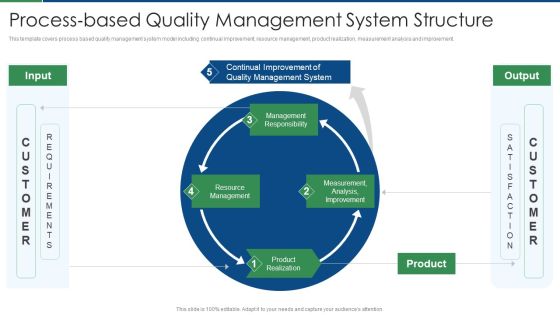
International Standard For Quality Management System Process Based Quality Management System Structure Background PDF
This template covers process based quality management system model including continual improvement, resource management, product realization, measurement analysis and improvement. This is a international standard for quality management system process based quality management system structure background pdf template with various stages. Focus and dispense information on four stages using this creative set, that comes with editable features. It contains large content boxes to add your information on topics like management responsibility, resource management, product realization, measurement, analysis, improvement. You can also showcase facts, figures, and other relevant content using this PPT layout. Grab it now.

Benefits Of Patient Feedback System To The Medical Facility Portrait PDF
This slide shows the benefits of implementing patient feedback system to the medical facility such as helps in monitoring service quality, improves patient engagement and responses, retain loyal patients, help to gain better insights on healthcare practices, helps to measure medical facilitys performance etc. Presenting benefits of patient feedback system to the medical facility portrait pdf to provide visual cues and insights. Share and navigate important information on nine stages that need your due attention. This template can be used to pitch topics like determine patient preferences, improves support, improves patient engagement. In addtion, this PPT design contains high resolution images, graphics, etc, that are easily editable and available for immediate download.

Advantages Of Outsourcing Logistics Functions Mockup PDF
This slide shows the advantages of outsourcing logistics activities such as reduction in indirect expenses, improving flexibility and performance, customs assistance, etc. that helps business to focus on core activities and operations. Presenting advantages of outsourcing logistics functions mockup pdf to dispense important information. This template comprises four stages. It also presents valuable insights into the topics including reduces indirect costs, improves flexibility, performance improvement, customs assistance. This is a completely customizable PowerPoint theme that can be put to use immediately. So, download it and address the topic impactfully.

Quality Assurance Templates Set 1 Five Phase Dmaic Process Ppt Model Graphics Template PDF
This slide displays five phases of DMAIC process that can be used by an organization to improve the effectiveness and efficiency of their processes. Here DMAIC stands for define, measure, analyze, improve and control. This is a quality assurance templates set 1 five phase dmaic process ppt model graphics template pdf template with various stages. Focus and dispense information on five stages using this creative set, that comes with editable features. It contains large content boxes to add your information on topics like improve, control, analyze, measure, define. You can also showcase facts, figures, and other relevant content using this PPT layout. Grab it now.

New Product Development Process Optimization Effect Of Product Development Diagrams PDF
This slide represents the effect of product development strategy on business such as manages and measures success, improves business performance, reputation, reduces costs and identifies risks. This is a new product development process optimization effect of product development diagrams pdf template with various stages. Focus and dispense information on five stages using this creative set, that comes with editable features. It contains large content boxes to add your information on topics like manages and measures success, improves business performance, improves reputation, reduces costs, identifies risks. You can also showcase facts, figures, and other relevant content using this PPT layout. Grab it now.

Utilizing Agile Methodology In Data Transformation Project IT Benefits Of Introducing Agile Designs PDF
This slide provides information on the benefits that organization will get after adopting agile methodology. Benefits covered are effective communication, transparency, improved quality and customer satisfaction. This is a utilizing agile methodology in data transformation project it benefits of introducing agile designs pdf template with various stages. Focus and dispense information on six stages using this creative set, that comes with editable features. It contains large content boxes to add your information on topics like improved quality, improved project predictability, understanding of customer needs, customer satisfaction, transparency. You can also showcase facts, figures, and other relevant content using this PPT layout. Grab it now.
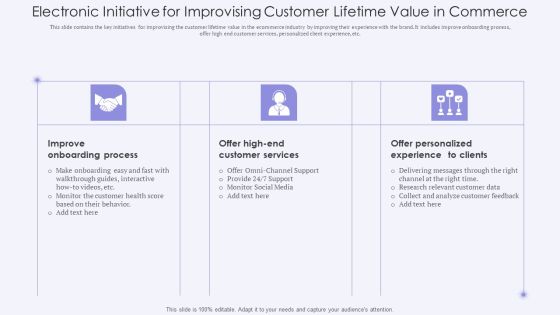
Electronic Initiative For Improvising Customer Lifetime Value In Commerce Designs PDF
This slide contains the key initiatives for improvising the customer lifetime value in the ecommerce industry by improving their experience with the brand. It includes improve onboarding process, offer high end customer services, personalized client experience, etc. Presenting Electronic Initiative For Improvising Customer Lifetime Value In Commerce Designs PDF to dispense important information. This template comprises three stages. It also presents valuable insights into the topics including Improve Onboarding Process, Customer Services, Analyze Customer. This is a completely customizable PowerPoint theme that can be put to use immediately. So, download it and address the topic impactfully.

Machine Learning Healthcare Technology For Treatment Optimization Demonstration PDF
The following slide illustrates the use of machine learning technology in medical industry which helps to improve the quality of patient care by using complex hidden patterns. Areas of development include improved diagnosis, drug discovery, personalized care and radiotherapy.Presenting Machine Learning Healthcare Technology For Treatment Optimization Demonstration PDF to dispense important information. This template comprises four stages. It also presents valuable insights into the topics including Improved Diagnosis, Drug Discovery, Personalized Care . This is a completely customizable PowerPoint theme that can be put to use immediately. So, download it and address the topic impactfully.

Business Operating Model ORMF Ppt PowerPoint Presentation Summary Graphics Design PDF
This slide covers risk management framework for business operating model. It includes components such as capital improvements, process efficiencies, control and quantification, alignment of goals, transparent communication, improved resource allocation, model risk appetite, risk reduction. Presenting Business Operating Model ORMF Ppt PowerPoint Presentation Summary Graphics Design PDF to dispense important information. This template comprises eight stages. It also presents valuable insights into the topics including Capital Improvement, Process Efficiencies, Alignment Goals. This is a completely customizable PowerPoint theme that can be put to use immediately. So, download it and address the topic impactfully.

Strategies To Reduce New Workforce Turnover Graphics PDF
This slide showcase various strategies to minimize employees turnover by improving hiring and onboarding process. It includes tactics such as improve job posting, manage expectations right from start, assess relevant skill and competencies, look for cultural fit etc. Presenting Strategies To Reduce New Workforce Turnover Graphics PDF to dispense important information. This template comprises Ten stages. It also presents valuable insights into the topics including Improve Job Posting, Establish Healthy Workplace, Be Transparent. This is a completely customizable PowerPoint theme that can be put to use immediately. So, download it and address the topic impactfully.

Corporate Development Plan Implementation Steps Elements PDF
Following slide illustrates corporate development procedures which assist organizations to systematically change company values and encourage overall improvement. The stages included in this slide are improvement area determination, problem investigation, action plan creation, etc. Persuade your audience using this Corporate Development Plan Implementation Steps Elements PDF. This PPT design covers Seven stages, thus making it a great tool to use. It also caters to a variety of topics including Identify Improvement Area, Investigate Problems, Draft Action Plan. Download this PPT design now to present a convincing pitch that not only emphasizes the topic but also showcases your presentation skills.
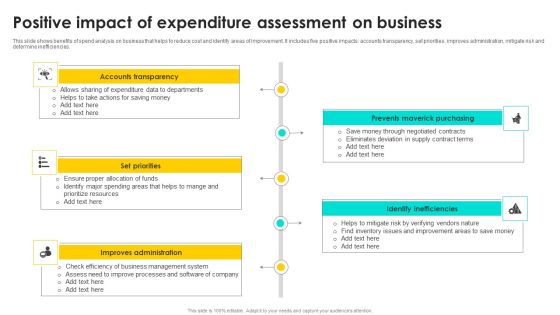
Positive Impact Of Expenditure Assessment On Business Clipart PDF
This slide shows benefits of spend analysis on business that helps to reduce cost and identify areas of improvement. It includes five positive impacts accounts transparency, set priorities, improves administration, mitigate risk and determine inefficiencies. Persuade your audience using this Positive Impact Of Expenditure Assessment On Business Clipart PDF. This PPT design covers Five stages, thus making it a great tool to use. It also caters to a variety of topics including Accounts Transparency, Set Priorities, Improves Administration. Download this PPT design now to present a convincing pitch that not only emphasizes the topic but also showcases your presentation skills.

Strategic Distributor Sourcing And Management Process Template PDF
This slide showcases strategic vendor sourcing process which helps professionals to source and renegotiate contracts. It provides information regarding product specification, joint process improvement, relationship restricting, global sourcing, price evaluation and volume concentration.Persuade your audience using this Strategic Distributor Sourcing And Management Process Template PDF. This PPT design covers six stages, thus making it a great tool to use. It also caters to a variety of topics including Volume Concentration, Specification Improvement, Process Improvement. Download this PPT design now to present a convincing pitch that not only emphasizes the topic but also showcases your presentation skills.

Change Management Flowchart For Retail Transformation Background PDF
This slide provides information about change management process flow for retail transformation to improve customer experience and delight. The steps relate to develop digital strategy, make investment in technologies, data driven operations, improve customer experience. Presenting Change Management Flowchart For Retail Transformation Background PDF to dispense important information. This template comprises Four stages. It also presents valuable insights into the topics including Develop Digital Strategy, Improve Customer Experience, Make Investment Technologies, Data Driven Operations. This is a completely customizable PowerPoint theme that can be put to use immediately. So, download it and address the topic impactfully.

Total Quality Management Elements System Infographics PDF
This slide shows components of total quality management that should be considered for better quality of output. It include elements such as commitment and understanding, quality improvement culture, continuous improving areas etc. Persuade your audience using this Total Quality Management Elements System Infographics PDF. This PPT design covers five stages, thus making it a great tool to use. It also caters to a variety of topics including Continuous Improving Areas, Customer Satisfaction Advantages, Effective Control Measures. Download this PPT design now to present a convincing pitch that not only emphasizes the topic but also showcases your presentation skills.

Latest Fleet Information Management Trends Download PDF
This slide showcases trends evolved in fleet management industry. This template aims on embracing new digital shifts to improve efficiency and control costs in organizations. It covers aspects such as improving overall safety, using 5G network, etc. Presenting Latest Fleet Information Management Trends Download PDF to dispense important information. This template comprises four stages. It also presents valuable insights into the topics including Boosts Operational Efficiency, Improves Fleet Productivity, Faster Data Transfer Better. This is a completely customizable PowerPoint theme that can be put to use immediately. So, download it and address the topic impactfully.

Importance Of Data Management Tools In Manufacturing Industry Clipart PDF
This slide mentions importance of data stewardship tools in manufacturing industry to improve information utilization while maintaining compliance. It includes having Centralized Data, Improving Customer Experience and Mitigating Risk. Presenting Importance Of Data Management Tools In Manufacturing Industry Clipart PDF to dispense important information. This template comprises four stages. It also presents valuable insights into the topics including Centralized Data, Improving Customer Experience, Mitigate Risk. This is a completely customizable PowerPoint theme that can be put to use immediately. So, download it and address the topic impactfully.

Lean Operational Excellence Strategy Dmaic Methodology For Project Management Template PDF
This slide showcases project management based on DMAIC methodology of define, measure, analyze, improve and control. It is quality improvement and problem-solving method which is used to improve employees and customer satisfaction. Presenting Lean Operational Excellence Strategy Dmaic Methodology For Project Management Template PDF to dispense important information. This template comprises five stages. It also presents valuable insights into the topics including Define, Measure, Analyze. This is a completely customizable PowerPoint theme that can be put to use immediately. So, download it and address the topic impactfully.
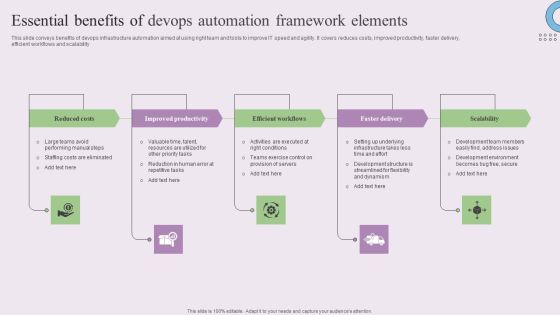
Essential Benefits Of Devops Automation Framework Elements Formats PDF
This slide conveys benefits of devops infrastructure automation aimed at using right team and tools to improve IT speed and agility. It covers reduces costs, improved productivity, faster delivery, efficient workflows and scalability. Presenting Essential Benefits Of Devops Automation Framework Elements Formats PDF to dispense important information. This template comprises five stages. It also presents valuable insights into the topics including Reduced Costs, Improved Productivity, Efficient Workflows, Faster Delivery . This is a completely customizable PowerPoint theme that can be put to use immediately. So, download it and address the topic impactfully.
Income Enablement Process Using Retail Analytics Template PDF
The following slide outlines revenue enablement process aimed at reaping benefits of in store retail analytics to understand customer preferences and patterns. It covers customer insights, improve visual merchandising and inventory management, data driven promoter management and cost optimization. Presenting Income Enablement Process Using Retail Analytics Template PDF to dispense important information. This template comprises five stages. It also presents valuable insights into the topics including Improve Visual Merchandising, Understand Customer Insights, Improve Inventory Management. This is a completely customizable PowerPoint theme that can be put to use immediately. So, download it and address the topic impactfully.
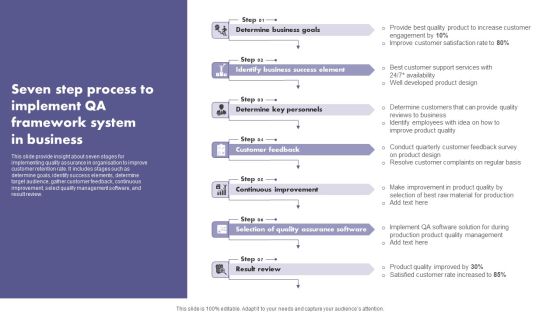
Seven Step Process To Implement QA Framework System In Business Demonstration PDF
This slide provide insight about seven stages for implementing quality assurance in organisation to improve customer retention rate. It includes stages such as determine goals, identify success elements, determine target audience, gather customer feedback, continuous improvement, select quality management software, and result review. Presenting Seven Step Process To Implement QA Framework System In Business Demonstration PDF to dispense important information. This template comprises seven stages. It also presents valuable insights into the topics including Customer Feedback, Continuous Improvement, Quality Assurance Software. This is a completely customizable PowerPoint theme that can be put to use immediately. So, download it and address the topic impactfully.
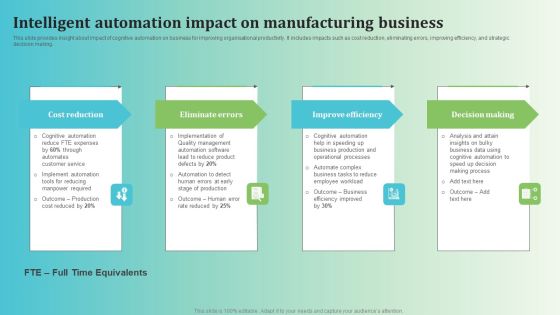
Intelligent Automation Impact On Manufacturing Business Summary PDF
This slide provides insight about impact of cognitive automation on business for improving organisational productivity. It includes impacts such as cost reduction, eliminating errors, improving efficiency, and strategic decision making. Presenting Intelligent Automation Impact On Manufacturing Business Summary PDF to dispense important information. This template comprises four stages. It also presents valuable insights into the topics including Cost Reduction, Eliminate Errors, Improve Efficiency. This is a completely customizable PowerPoint theme that can be put to use immediately. So, download it and address the topic impactfully.
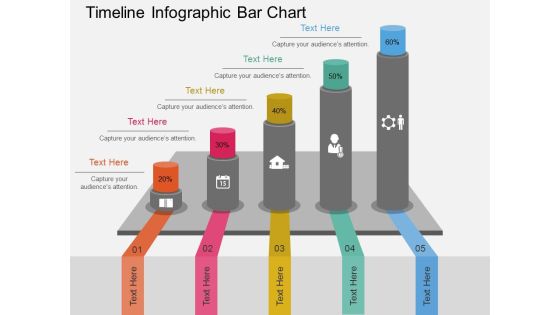
Timeline Infographic Bar Chart Powerpoint Template
This business diagram has been designed with timeline infographic bar chart. You may use this slide to display success and growth concepts. Make your mark with this unique slide and create an impression that will endure.

Air Balloon Graphic With Text Space Powerpoint Templates
This business slide has been designed with graphics of air balloon. Download this diagram to portray concepts like growth, finance, marketing, and communication. This slide is innovatively designed to highlight your worthy view.

Air Balloon With Eight Options Powerpoint Templates
This business slide has been designed with graphics of air balloon. Download this diagram to portray concepts like growth, finance, marketing, and communication. This slide is innovatively designed to highlight your worthy view.

Go To Market Strategy Channels Powerpoint Graphics
This is a go to market strategy channels powerpoint graphics. This is a one stage process. The stages in this process are growth, social network, quality, our business, idea.

Component Of A Stocks Return Example Powerpoint Show
This is a component of a stocks return example powerpoint show. This is a three stage process. The stages in this process are price earnings ratio, dividend yield, earnings growth.
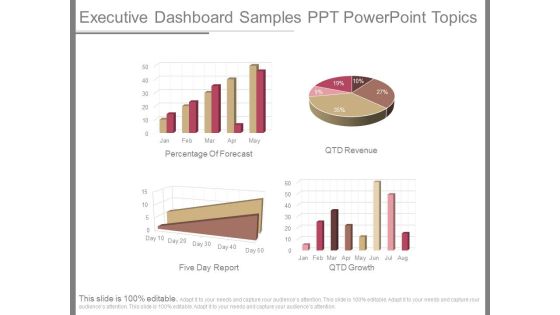
Executive Dashboard Samples Ppt Powerpoint Topics
This is a executive dashboard samples ppt powerpoint topics. This is a four stage process. The stages in this process are percentage of forecast, qtd revenue, five day report, qtd growth
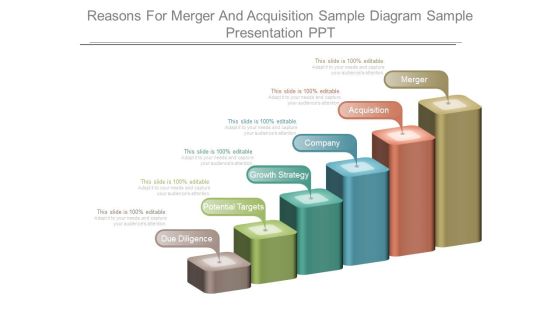
Reasons For Merger And Aquisition Sample Diagram Sample Presentation Ppt
This is a reasons for merger and aquisition sample diagram sample presentation ppt. This is a six stage process. The stages in this process are merger, acquisition, company, growth strategy, potential targets, due diligence.

Company Vision Timeline With Launch Strategy Sample Of Ppt Presentation
This is a company vision timeline with launch strategy sample of ppt presentation. This is a five stage process. The stages in this process are business, marketing, growth, management.

Curve Chart For Product Life Cycle Presentation Outline
This is a curve chart for product life cycle presentation outline. This is a five stage process. The stages in this process are sales over time, product extension, introduction, growth, maturity, decline, time.

Annual Hiring Plan Bar Chart Example Of Ppt
This is a annual hiring plan bar chart example of ppt. This is a five stage process. The stages in this process are bar graph, business, marketing, growth, success.

Bar Graph With Total Profit Analysis Ppt Images
This is a bar graph with total profit analysis ppt images. This is a nine stage process. The stages in this process are bar graph, business, marketing, growth, success.

Gross Margin Analysis Bar Chart Powerpoint Slide Backgrounds
This is a gross margin analysis bar chart powerpoint slide backgrounds. This is a two stage process. The stages in this process are bar graph, business, marketing, growth, success.

Dividend Per Share Bar Chart Powerpoint Slide Background Designs
This is a dividend per share bar chart powerpoint slide background designs. This is a five stage process. The stages in this process are business, marketing, success, growth, bar graph.

Ansoff Matrix For Product Development Ppt Infographics
This is a ansoff matrix for product development ppt infographics. This is a four stage process. The stages in this process are current, market penetration strategy, product development strategy, market development strategy, diversification strategy, growth strategies.

Business Intelligence And Analytics Timeline Ppt PowerPoint Presentation Shapes
This is a business intelligence and analytics timeline ppt powerpoint presentation shapes. This is a five stage process. The stages in this process are year, business, growth, success, timeline.

Business Leaders Silhouette Ppt PowerPoint Presentation Deck
This is a business leaders silhouette ppt powerpoint presentation deck. This is a four stage process. The stages in this process are business, strategy, marketing, silhouette, growth, success, management.

Decline Stage In Marketing Ppt PowerPoint Presentation Slide
This is a decline stage in marketing ppt powerpoint presentation slide. This is a four stage process. The stages in this process are introduction, growth, maturity, decline, services sales, time.

Bar Graph To Show Company Sales Budget Ppt PowerPoint Presentation Sample
This is a bar graph to show company sales budget ppt powerpoint presentation sample. This is a four stage process. The stages in this process are business, finance, growth, success, marketing, arrow.
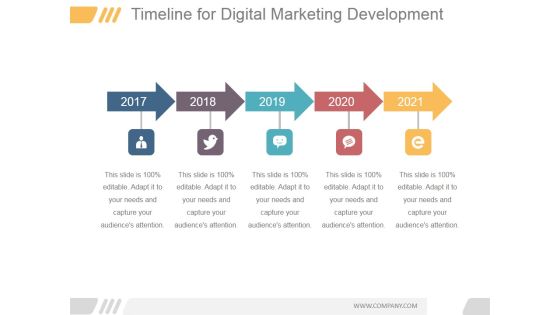
Timeline For Digital Marketing Development Ppt PowerPoint Presentation Visuals
This is a timeline for digital marketing development ppt powerpoint presentation visuals. This is a five stage process. The stages in this process are year, success, arrows, time planning, growth.

Bar Graph For Sales Revenue Over The Years Ppt PowerPoint Presentation Professional
This is a bar graph for sales revenue over the years ppt powerpoint presentation professional. This is a nine stage process. The stages in this process are business, marketing, growth, bar, years.

Crm Dashboard Deals By Expected Close Date Ppt PowerPoint Presentation Background Images
This is a crm dashboard deals by expected close date ppt powerpoint presentation background images. This is a five stage process. The stages in this process are bar graph, aug, sep, oct, growth.

Data Collection Scatter Diagram Ppt PowerPoint Presentation Shapes
This is a data collection scatter diagram ppt powerpoint presentation shapes. This is a three stage process. The stages in this process are business, strategy, growth strategy, marketing, histogram, finance.
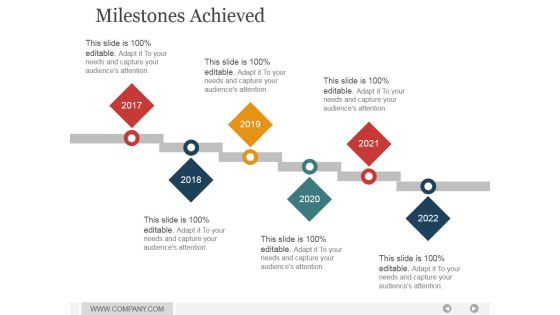
Milestones Achieved Ppt PowerPoint Presentation Ideas
This is a milestones achieved ppt powerpoint presentation ideas. This is a six stage process. The stages in this process are timeline, years, planning, management, success, business, growth strategy.

Quarterly Sales Revenue By Product Ppt PowerPoint Presentation Background Designs
This is a quarterly sales revenue by product ppt powerpoint presentation background designs. This is a four stage process. The stages in this process are business, strategy, marketing, analysis, growth strategy.

Major Roadblocks Or Obstacles To Success Ppt PowerPoint Presentation Good
This is a major roadblocks or obstacles to success ppt powerpoint presentation good. This is a four stage process. The stages in this process are business, process, management, winner, growth, success.

Current Quarter Portfolio Ppt PowerPoint Presentation Visual Aids
This is a current quarter portfolio ppt powerpoint presentation visual aids. This is a two stage process. The stages in this process are business, strategy, marketing, finance, growth strategy, bar graph.

Portfolio Return And Performance Ppt PowerPoint Presentation Styles
This is a portfolio return and performance ppt powerpoint presentation stylest. This is a five stage process. The stages in this process are business, strategy, marketing, analysis, success, growth.

Why A Sound Well Communicated Strategic Vision Matters Ppt PowerPoint Presentation Diagrams
This is a why a sound well communicated strategic vision matters ppt powerpoint presentation diagrams. This is a five stage process. The stages in this process are communication, success, business, marketing, growth.
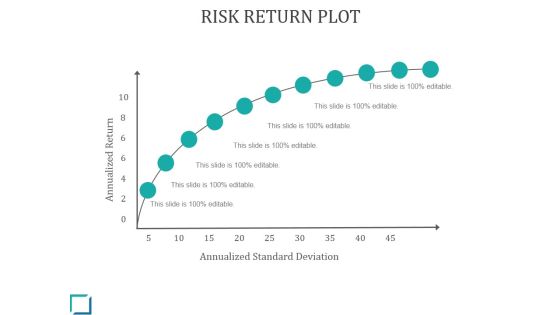
Risk Return Plot Ppt PowerPoint Presentation Microsoft
This is a risk return plot ppt powerpoint presentation microsoft. This is a eleven stage process. The stages in this process are annualized return, annualized standard deviation, growth, success.

CSR Monitoring And Measurement Strategy Ppt PowerPoint Presentation Complete Deck With Slides
This is a csr monitoring and measurement strategy ppt powerpoint presentation complete deck with slides. This is a one stage process. The stages in this process are business, strategy, marketing, finance, growth strategy.
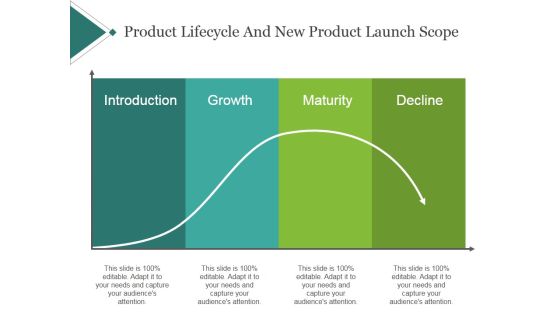
Product Lifecycle And New Product Launch Scope Template 1 Ppt PowerPoint Presentation Slides
This is a product lifecycle and new product launch scope template 1 ppt powerpoint presentation slides. This is a four stage process. The stages in this process are introduction, growth, maturity, decline.

Product Lifecycle And New Product Launch Scope Template 2 Ppt PowerPoint Presentation Show
This is a product lifecycle and new product launch scope template 2 ppt powerpoint presentation show. This is a five stage process. The stages in this process are growth, maturity, decline, rebirth.
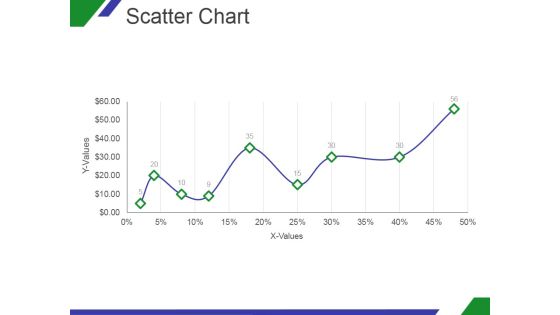
Scatter Chart Ppt PowerPoint Presentation Designs Download
This is a scatter chart ppt powerpoint presentation designs download. This is a nine stage process. The stages in this process are x values, y values, graph, growth, success.
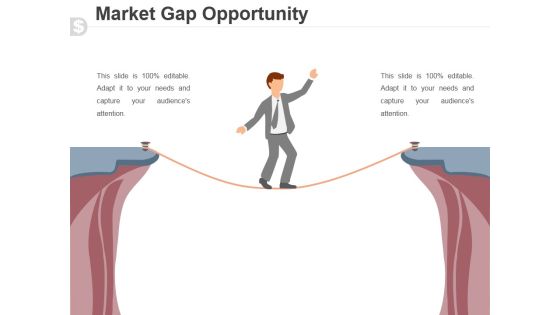
Market Gap Opportunity Template 2 Ppt PowerPoint Presentation Portfolio
This is a market gap opportunity template 2 ppt powerpoint presentation portfolio. This is a one stage process. The stages in this process are market opportunity, business, marketing, growth, skill.

Industry Overview Template 1 Ppt PowerPoint Presentation Show
This is a industry overview template 1 ppt powerpoint presentation show. This is a six stage process. The stages in this process are revenue, profit, annual growth, wages, businesses.

Career Path Template 2 Ppt PowerPoint Presentation Example 2015
This is a career path template 2 ppt powerpoint presentation example 2015. This is a six stage process. The stages in this process are business, marketing, growth, career, planning.
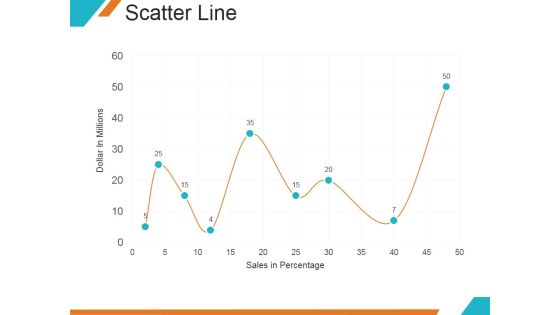
Scatter Line Ppt PowerPoint Presentation Backgrounds
This is a scatter line ppt powerpoint presentation backgrounds. This is a nine stage process. The stages in this process are dollar in millions, sales in percentage, graph, growth.

Combo Chart Ppt PowerPoint Presentation Infographics Infographics
This is a combo chart ppt powerpoint presentation infographics infographics. This is a three stage process. The stages in this process are bar graph, growth, finance, marketing, strategy, business.
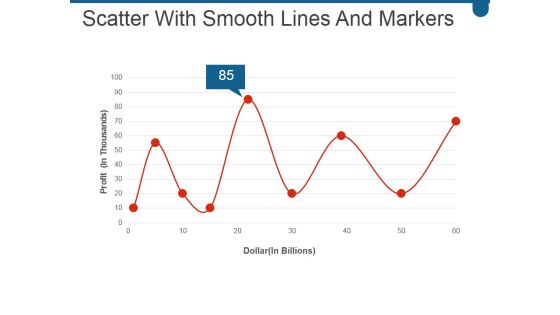
Scatter With Smooth Lines And Markers Ppt PowerPoint Presentation Professional Visual Aids
This is a scatter with smooth lines and markers ppt powerpoint presentation professional visual aids. This is a nine stage process. The stages in this process are business, marketing, success, growth, line.
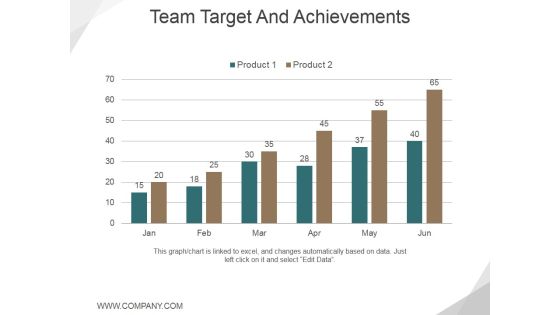
Team Target And Achievements Template 2 Ppt PowerPoint Presentation Infographic Template Graphic Tips
This is a team target and achievements template 2 ppt powerpoint presentation infographic template graphic tips. This is a six stage process. The stages in this process are graph, growth, success, business, marketing.

Combo Chart Ppt PowerPoint Presentation Summary Graphics Tutorials
This is a combo chart ppt powerpoint presentation summary graphics tutorials. This is a eight stage process. The stages in this process are product, growth rate, market size, business.
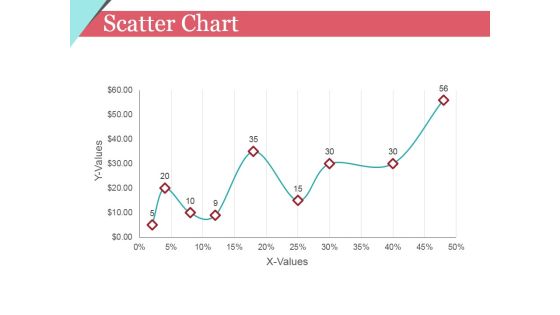
Scatter Chart Ppt PowerPoint Presentation Model Template
This is a scatter chart ppt powerpoint presentation model template. This is a nine stage process. The stages in this process are x values, y values, graph, growth, success.

Bar Graph Ppt PowerPoint Presentation Infographic Template Background
This is a bar graph ppt powerpoint presentation infographic template background. This is a four stage process. The stages in this process are business, strategy, analysis, growth, chart and graph.

Revenue Per Employee Ppt PowerPoint Presentation Layouts Layout
This is a revenue per employee ppt powerpoint presentation layouts layout. This is a eight stage process. The stages in this process are company revenue, annual revenue per employee, revenue, growth.

Staff Engagement Model Ppt PowerPoint Presentation Infographics Portfolio
This is a staff engagement model ppt powerpoint presentation infographics portfolio. This is a six stage process. The stages in this process are people and culture, corporate reputation and practices, opportunities and growth, engagement.

Training Hours Per Employee Ppt PowerPoint Presentation Styles Influencers
This is a training hours per employee ppt powerpoint presentation styles influencers. This is a four stage process. The stages in this process are average training hours, sum of total training hours, year, growth.
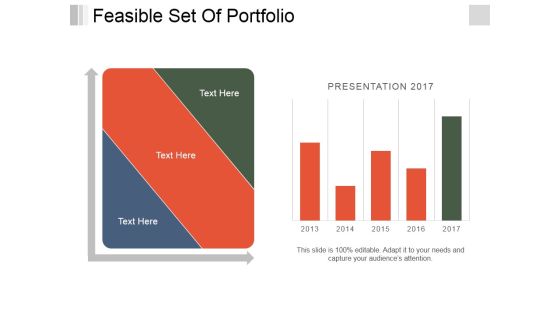
Feasible Set Of Portfolio Ppt PowerPoint Presentation Pictures Layouts
This is a feasible set of portfolio ppt powerpoint presentation pictures layouts. This is a two stage process. The stages in this process are business, finance, growth, marketing, strategy, analysis.

Stage Gate Product Life Cycle Ppt PowerPoint Presentation Complete Deck With Slides
This is a stage gate product life cycle ppt powerpoint presentation complete deck with slides. This is a one stage process. The stages in this process are graph, product, growth, decline, business.

Advertising Spent On Different Mediums Ppt PowerPoint Presentation Infographics Show
This is a advertising spent on different mediums ppt powerpoint presentation infographics show. This is a five stage process. The stages in this process are business, finance, marketing, strategy, bar graph, growth.

Bar Graph Ppt PowerPoint Presentation Show Topics
This is a bar graph ppt powerpoint presentation show topics. This is a nine stage process. The stages in this process are business, finance, marketing, strategy, bar graph, growth.
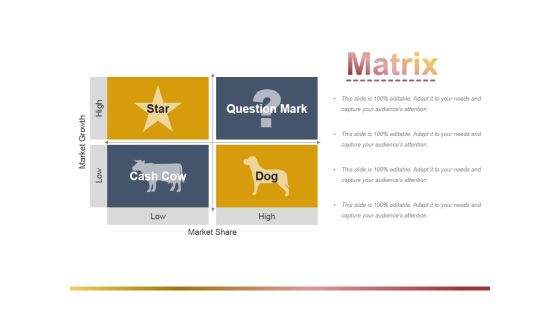
Matrix Ppt PowerPoint Presentation File Objects
This is a matrix ppt powerpoint presentation file objects. This is a four stage process. The stages in this process are market growth, question mark, cash cow, market share.

Combo Chart Ppt PowerPoint Presentation Inspiration Images
This is a combo chart ppt powerpoint presentation inspiration images. This is a three stage process. The stages in this process are market size, in years, growth rate, product.
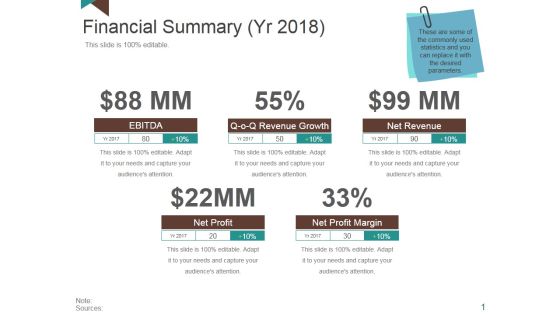
Financial Summary Ppt PowerPoint Presentation Layouts Portrait
This is a financial summary ppt powerpoint presentation layouts portrait. This is a four stage process. The stages in this process are ebitda, revenue growth, net revenue, net profit margin, net profit.
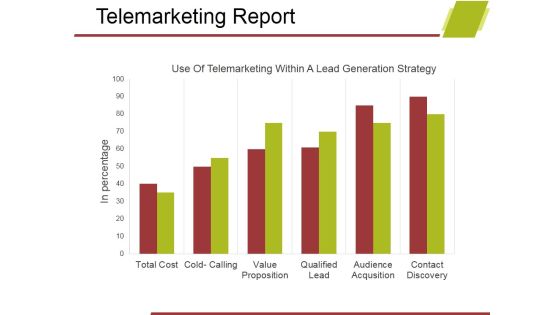
Telemarketing Report Template 1 Ppt PowerPoint Presentation Show Design Ideas
This is a telemarketing report template 1 ppt powerpoint presentation show design ideas. This is a six stage process. The stages in this process are business, bar graph, marketing, analysis, growth, strategy.

Summary Financials Revenue Ebitda Pat Ppt PowerPoint Presentation Portfolio Designs
This is a summary financials revenue ebitda pat ppt powerpoint presentation portfolio designs. This is a three stage process. The stages in this process are growth, finance, business, marketing.

Summary Financials Wc Analysis Roce Roe Ppt PowerPoint Presentation Inspiration Templates
This is a summary financials wc analysis roce roe ppt powerpoint presentation inspiration templates. This is a two stage process. The stages in this process are working capital analysis, roce and roe, growth, finance.

Clustered Column Line Ppt PowerPoint Presentation Slides Deck
This is a clustered column line ppt powerpoint presentation slides deck. This is a four stage process. The stages in this process are clustered column line, business, product, growth, strategy.

Matrix Ppt PowerPoint Presentation Model Design Templates
This is a matrix ppt powerpoint presentation model design templates. This is a four stage process. The stages in this process are star, question mark, cash cow, dog, market growth, market share.

Staked Line Chart Ppt PowerPoint Presentation Model Graphics Download
This is a staked line chart ppt powerpoint presentation model graphics download. This is a two stage process. The stages in this process are business, marketing, growth, finance, management.

Gap Analysis Graph Ppt Powerpoint Presentation Gallery Sample
This is a gap analysis graph ppt powerpoint presentation gallery sample. This is a six stage process. The stages in this process are potential performance, diversification, market growth, market penetration.
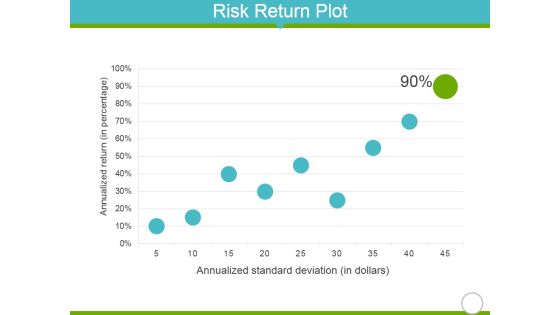
Risk Return Plot Ppt PowerPoint Presentation Infographics Background Designs
This is a risk return plot ppt powerpoint presentation infographics background designs. This is a nine stage process. The stages in this process are annualized return, annualized standard deviation, growth.

Column Chart Template 1 Ppt PowerPoint Presentation Professional Backgrounds
This is a column chart template 1 ppt powerpoint presentation professional backgrounds. This is a nine stage process. The stages in this process are column chart, product, growth, strategy, analysis, business.

Column Chart Template 2 Ppt PowerPoint Presentation Professional Slide
This is a column chart template 2 ppt powerpoint presentation professional slide. This is a nine stage process. The stages in this process are column chart, product, growth, strategy, analysis, business.

Competitor Positioning Ppt PowerPoint Presentation Slides Example Topics
This is a competitor positioning ppt powerpoint presentation slides example topics. This is a two stage process. The stages in this process are business, strategy, analysis, planning, finance, market growth.
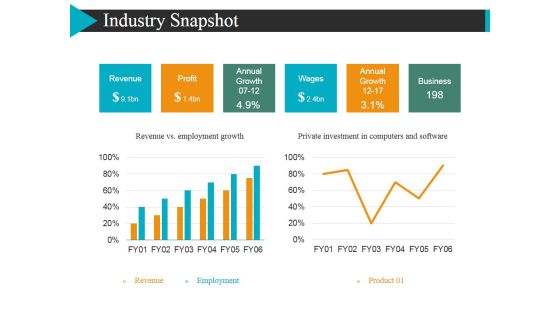
Industry Snapshot Template 2 Ppt Powerpoint Presentation Layouts Sample
This is a industry snapshot template 2 ppt powerpoint presentation layouts sample. This is a two stage process. The stages in this process are revenue, profit, annual growth, wages.

Market Insights Template 1 Ppt PowerPoint Presentation Show Brochure
This is a market insights template 1 ppt powerpoint presentation show brochure. This is a three stage process. The stages in this process are business, finance, marketing, analysis, growth.
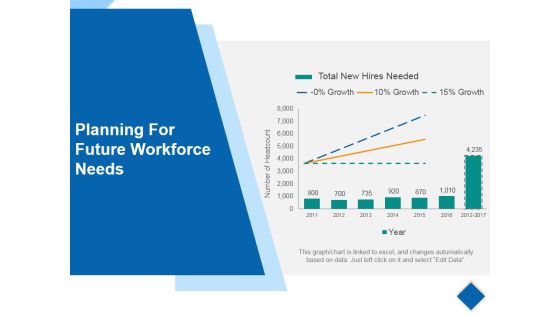
Planning For Future Workforce Needs Ppt PowerPoint Presentation Professional Slide
This is a planning for future workforce needs ppt powerpoint presentation professional slide. This is a seven stage process. The stages in this process are total new hires needed, business, graph, success, growth.

Combo Chart Ppt PowerPoint Presentation Summary Ideas
This is a combo chart ppt powerpoint presentation summary ideas. This is a eight stage process. The stages in this process are market size, growth rate, product, in years.

Internal Analysis Template 1 Ppt PowerPoint Presentation Summary Example Topics
This is a internal analysis template 1 ppt powerpoint presentation summary example topics. This is a three stage process. The stages in this process are employee performance, finance, analysis, strategy, growth, business.

Area Chart Ppt PowerPoint Presentation Show Layout Ideas
This is a area chart ppt powerpoint presentation show layout ideas. This is a two stage process. The stages in this process are product, in percentage, financial year, growth.

Clustered Column Line Ppt PowerPoint Presentation Gallery Graphics Example
This is a clustered column line ppt powerpoint presentation gallery graphics example. This is a four stage process. The stages in this process are product, growth, success, business, marketing.
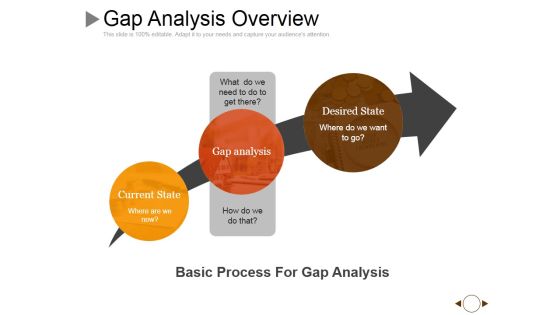
Gap Analysis Overview Ppt PowerPoint Presentation Model Show
This is a gap analysis overview ppt powerpoint presentation model show. This is a three stage process. The stages in this process are current state, gap analysis, desired state, arrow, growth.

Stacked Column Ppt PowerPoint Presentation Infographic Template Master Slide
This is a stacked column ppt powerpoint presentation infographic template master slide. This is a nine stage process. The stages in this process are product, dollar, growth, success, graph.

Clustered Column Line Ppt PowerPoint Presentation Summary Slides
This is a clustered column line ppt powerpoint presentation summary slides. This is a four stage process. The stages in this process are bar graph, growth, success, business, marketing.

Challenges Faced By Our Clients Template 2 Ppt PowerPoint Presentation Model Example
This is a challenges faced by our clients template 2 ppt powerpoint presentation model example. This is a three stage process. The stages in this process are challenge, goal, growth, success.
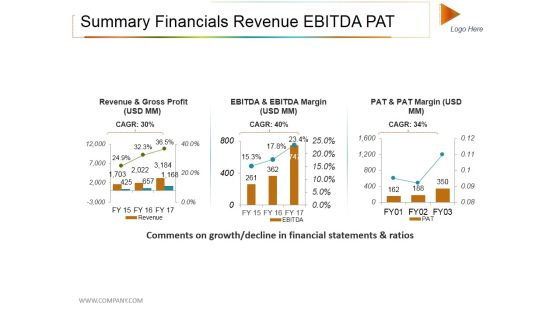
Summary Financials Revenue Ebitda Pat Ppt PowerPoint Presentation File Rules
This is a summary financials revenue ebitda pat ppt powerpoint presentation file rules. This is a three stage process. The stages in this process are revenue and gross profit, revenue, growth, success.

Bcg Matrix Ppt PowerPoint Presentation Layouts Deck
This is a bcg matrix ppt powerpoint presentation layouts deck. This is a four stage process. The stages in this process are question mark, star, dog, cash cow, market growth.

Branding And Repositioning Ppt PowerPoint Presentation Portfolio Design Templates
This is a branding and repositioning ppt powerpoint presentation portfolio design templates. This is a five stage process. The stages in this process are repositioning a product, repositioning strategy, growth stage, maturity stage, decline stage.

Bar Graph Ppt PowerPoint Presentation Pictures Slide Portrait
This is a bar graph ppt powerpoint presentation pictures slide portrait. This is a four stage process. The stages in this process are bar graph, growth, success, business, marketing.

Company History And Milestones Template 2 Ppt PowerPoint Presentation Pictures Graphics Download
This is a company history and milestones template 2 ppt powerpoint presentation pictures graphics download. This is a five stage process. The stages in this process are roadmap, management, planning, strategy, business, growth.

Inflation Rate Template 1 Ppt PowerPoint Presentation Professional Design Inspiration
This is a inflation rate template 1 ppt powerpoint presentation professional design inspiration. This is a twelve stage process. The stages in this process are business, finance, growth, marketing, strategy, analysis.

Shareholders Fund And Market Cap Ppt PowerPoint Presentation Visual Aids Styles
This is a shareholders fund and market cap ppt powerpoint presentation visual aids styles. This is a five stage process. The stages in this process are business, finance, marketing, strategy, analysis, growth.

Career Path Template 2 Ppt PowerPoint Presentation Outline Topics
This is a career path template 2 ppt powerpoint presentation outline topics. This is a three stage process. The stages in this process are silhouettes, business, marketing, communication, growth.

Process Capability Measurement Template 1 Ppt PowerPoint Presentation Portfolio Model
This is a process capability measurement template 1 ppt powerpoint presentation portfolio model. This is a nine stage process. The stages in this process are target, lsl, usl, graph, growth.
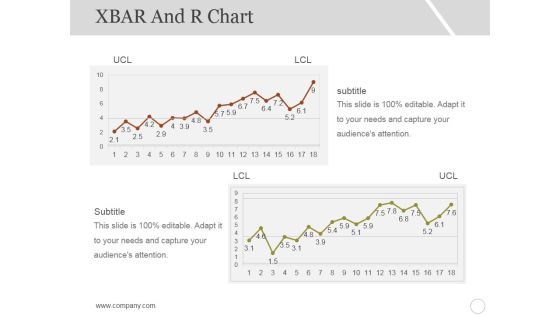
Xbar And R Chart Ppt PowerPoint Presentation Inspiration Styles
This is a xbar and r chart ppt powerpoint presentation inspiration styles. This is a two stage process. The stages in this process are subtitle, lcl, ucl, growth, graph.
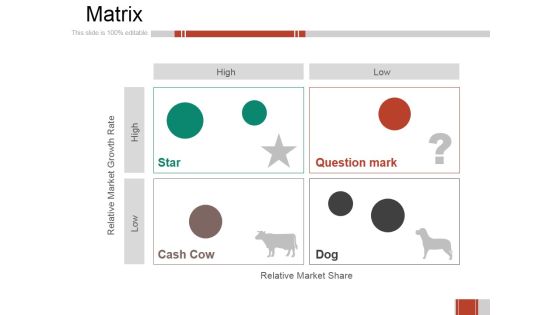
Matrix Ppt PowerPoint Presentation Summary Inspiration
This is a matrix ppt powerpoint presentation summary inspiration. This is a four stage process. The stages in this process are star, question mark, cash cow, dog, relative market share, relative market growth rate.
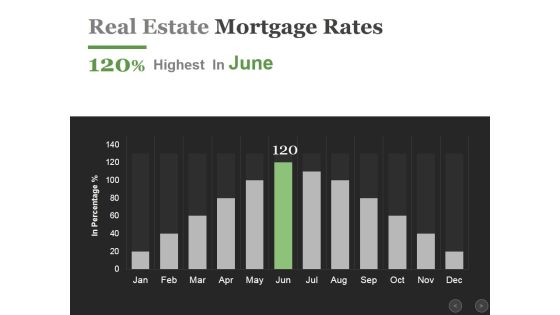
Real Estate Mortgage Rates Ppt PowerPoint Presentation Infographics Influencers
This is a real estate mortgage rates ppt powerpoint presentation infographics influencers. This is a twelve stage process. The stages in this process are business, finance, marketing, analysis, growth.

Matrix Ppt PowerPoint Presentation Model Influencers
This is a matrix ppt powerpoint presentation model influencers. This is a four stage process. The stages in this process are high, low, relative market share, relative market growth rate.

Annual Run Rate Ppt PowerPoint Presentation Gallery Mockup
This is a annual run rate ppt powerpoint presentation gallery mockup. This is a four stage process. The stages in this process are bar graph, growth, success, business, marketing.

Bar Graph Ppt PowerPoint Presentation Inspiration Format Ideas
This is a bar graph ppt powerpoint presentation inspiration format ideas. This is a four stage process. The stages in this process are bar graph, growth, success, business, marketing.
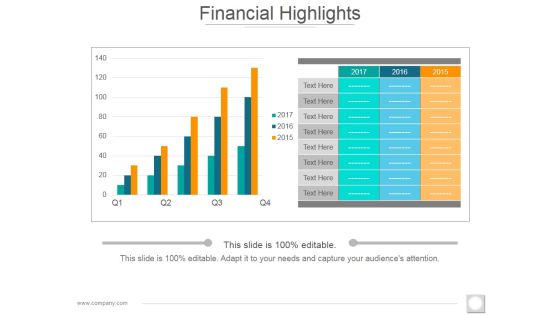
Financial Highlights Template 2 Ppt PowerPoint Presentation Slides Ideas
This is a financial highlights template 2 ppt powerpoint presentation slides ideas. This is a two stage process. The stages in this process are bar graph, growth, success, business, marketing.

Bcg Matrix Ppt PowerPoint Presentation Slides Design Ideas
This is a bcg matrix ppt powerpoint presentation slides design ideas. This is a four stage process. The stages in this process are question mark, star, dog, cash cow, market growth, market share.
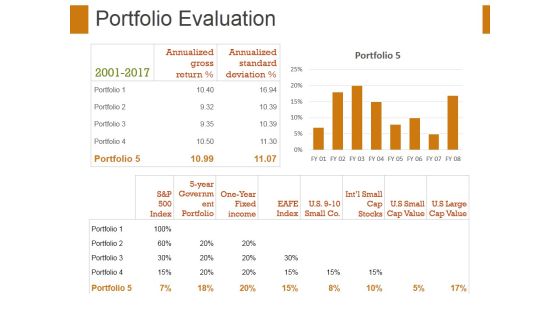
Portfolio Evaluation Template 2 Ppt PowerPoint Presentation Portfolio Slides
This is a portfolio evaluation template 2 ppt powerpoint presentation portfolio slides. This is a eight stage process. The stages in this process are portfolio evaluation, finance, growth, marketing, analysis, business.
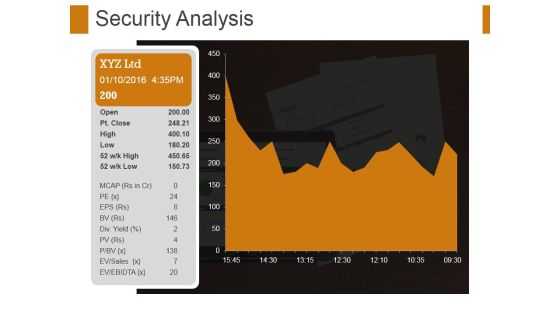
Security Analysis Ppt PowerPoint Presentation File Format Ideas
This is a security analysis ppt powerpoint presentation file format ideas. This is a one stage process. The stages in this process are security analysis, growth, strategy, management, business.

Monthly Recurring Revenue Churn Template 2 Ppt PowerPoint Presentation Diagram Images
This is a monthly recurring revenue churn template 2 ppt powerpoint presentation diagram images. This is a eleven stage process. The stages in this process are bar graph, growth, success, business, marketing.
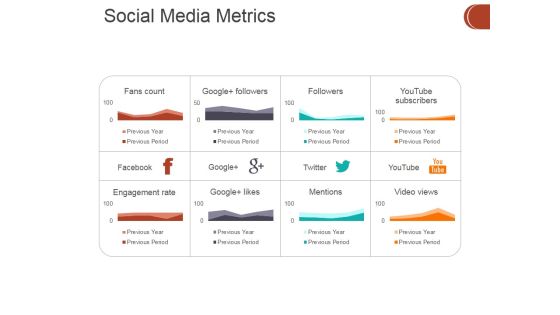
Social Media Metrics Ppt PowerPoint Presentation Portfolio Tips
This is a social media metrics ppt powerpoint presentation portfolio tips. This is a eight stage process. The stages in this process are business, finance, growth, strategy, analysis, investment.

External Analysis Trends In Public Sector Employment Ppt PowerPoint Presentation Slides Templates
This is a external analysis trends in public sector employment ppt powerpoint presentation slides templates. This is a seven stage process. The stages in this process are percentage, growth, business, marketing, strategy.
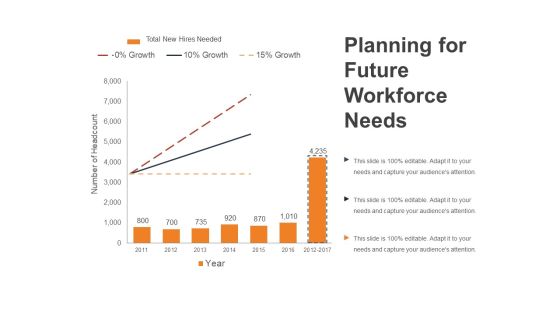
Planning For Future Workforce Needs Ppt PowerPoint Presentation Outline Smartart
This is a planning for future workforce needs ppt powerpoint presentation outline smartart. This is a three stage process. The stages in this process are growth, percentage, number of headcount, year, finance.

Bar Graph Ppt PowerPoint Presentation Ideas Graphic Tips
This is a bar graph ppt powerpoint presentation ideas graphic tips. This is a three stage process. The stages in this process are financial year, sales in percentage, product, bar graph, growth.

Clustered Column Line Ppt PowerPoint Presentation Show Influencers
This is a clustered column line ppt powerpoint presentation show influencers. This is a four stage process. The stages in this process are financial year, sales in percentage, product, growth, success.
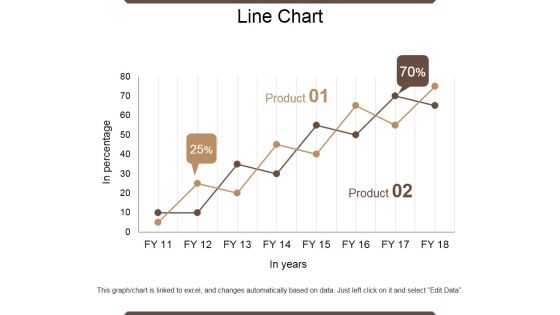
Line Chart Ppt PowerPoint Presentation Outline Infographic Template
This is a line chart ppt powerpoint presentation outline infographic template. This is a two stage process. The stages in this process are in percentage, product, in year, growth, success.

Stacked Area Clustered Column Ppt PowerPoint Presentation Show Guidelines
This is a stacked area clustered column ppt powerpoint presentation show guidelines. This is a four stage process. The stages in this process are in percentage, product, bar graph, growth, success.

Bar Graph Ppt PowerPoint Presentation Model Graphics Design
This is a bar graph ppt powerpoint presentation model graphics design. This is a four stage process. The stages in this process are bar graph, growth, success, business, marketing.

Area Chart Ppt PowerPoint Presentation Infographic Template Samples
This is a area chart ppt powerpoint presentation infographic template samples. This is a two stage process. The stages in this process are in percentage product, business, marketing, growth.

Clustered Column Line Ppt PowerPoint Presentation Portfolio Outline
This is a clustered column line ppt powerpoint presentation portfolio outline. This is a four stage process. The stages in this process are sales in percentage, financial year, product, graph, growth.
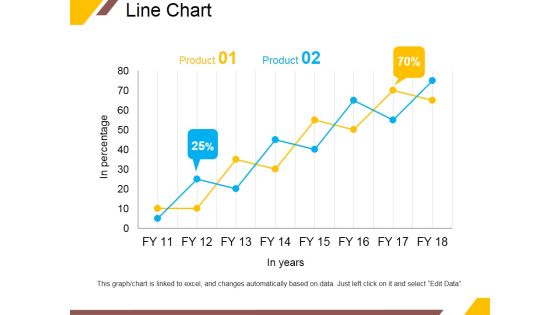
Line Chart Ppt PowerPoint Presentation Portfolio Infographic Template
This is a line chart ppt powerpoint presentation portfolio infographic template. This is a two stage process. The stages in this process are product, in years, business, percentage, growth.

Stacked Area Clustered Column Ppt PowerPoint Presentation Inspiration Shapes
This is a stacked area clustered column ppt powerpoint presentation inspiration shapes. This is a four stage process. The stages in this process are in percentage, product, growth, success, graph.
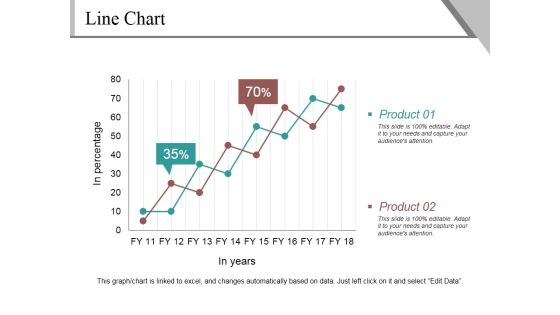
Line Chart Ppt PowerPoint Presentation Infographics Example
This is a line chart ppt powerpoint presentation infographics example. This is a two stage process. The stages in this process are product, in percentage, in years, finance, growth.
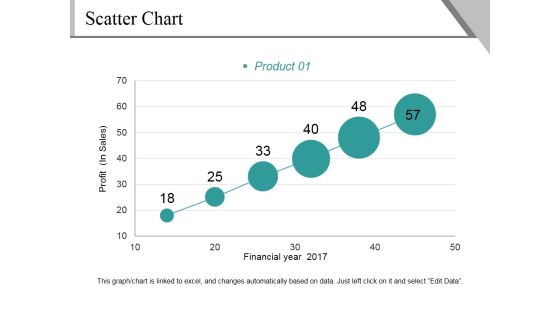
Scatter Chart Ppt PowerPoint Presentation File Background Image
This is a scatter chart ppt powerpoint presentation file background image. This is a six stage process. The stages in this process are profit, financial year, product, growth, success.
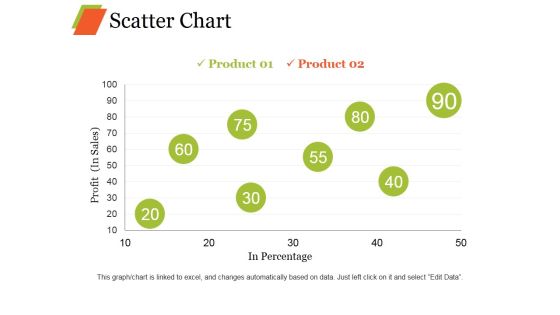
Scatter Chart Ppt PowerPoint Presentation Professional Graphic Images
This is a scatter chart ppt powerpoint presentation professional graphic images. This is a eight stage process. The stages in this process are product, profit, in percentage growth, business.

Combo Chart Ppt PowerPoint Presentation Summary Slides
This is a combo chart ppt powerpoint presentation summary slides. This is a three stage process. The stages in this process are market size, product, growth rate, bar graph, success.
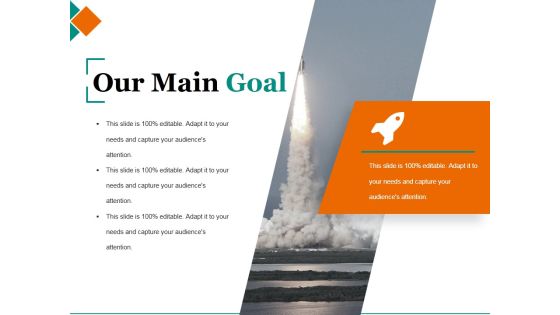
Our Main Goal Ppt PowerPoint Presentation Summary Clipart Images
This is a our main goal ppt powerpoint presentation summary clipart images. This is a one stage process. The stages in this process are our main goal, growth, success, strategic, launch.

Customer Acquisition Cost By Channel Template 1 Ppt PowerPoint Presentation Show Graphic Tips
This is a customer acquisition cost by channel template 1 ppt powerpoint presentation show graphic tips. This is a five stage process. The stages in this process are business, finance, growth, analysis, strategy.

New Business Marketing Strategy Financing Expense Model Ppt PowerPoint Presentation Complete Deck With Slides
This is a new business marketing strategy financing expense model ppt powerpoint presentation complete deck with slides. This is a one stage process. The stages in this process are business, marketing, strategy, growth, graph.

Area Chart Ppt PowerPoint Presentation Infographics Visual Aids
This is a area chart ppt powerpoint presentation infographics visual aids. This is a two stage process. The stages in this process are product, area chart, in percentage, growth, success.
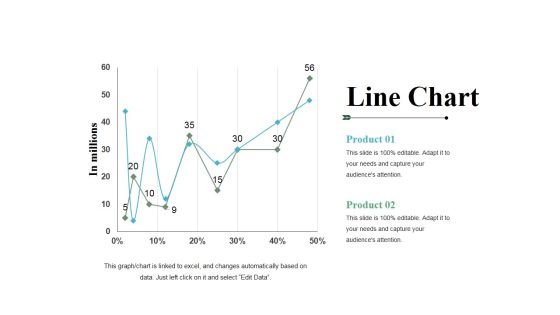
Line Chart Ppt PowerPoint Presentation File Templates
This is a line chart ppt powerpoint presentation file templates. This is a two stage process. The stages in this process are product, line chart, growth, percentage, in millions.
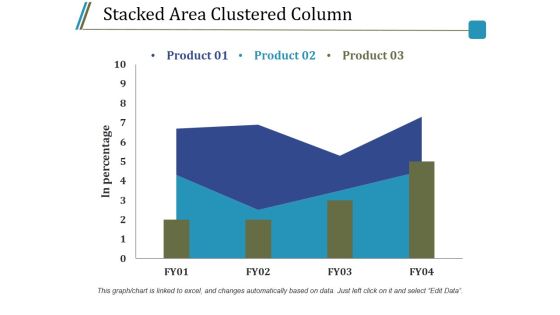
Stacked Area Clustered Column Ppt PowerPoint Presentation Model Guidelines
This is a stacked area clustered column ppt powerpoint presentation model guidelines. This is a three stage process. The stages in this process are product, in percentage, bar graph, growth, success.

Area Chart Ppt PowerPoint Presentation Infographic Template Layout
This is a area chart ppt powerpoint presentation infographic template layout. This is a two stage process. The stages in this process are product, profit, area chart, growth, success.
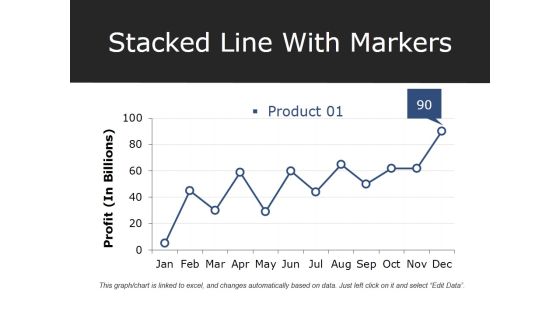
Stacked Line With Markers Ppt PowerPoint Presentation Professional Deck
This is a stacked line with markers ppt powerpoint presentation professional deck. This is a one stage process. The stages in this process are product, profit, growth, success, graph.

Line Chart Ppt PowerPoint Presentation Professional Graphics Design
This is a line chart ppt powerpoint presentation professional graphics design. This is a two stage process. The stages in this process are financial years, sales in percentage, product, growth, success.
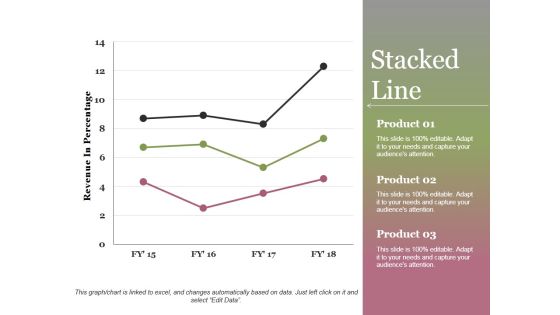
Stacked Line Ppt PowerPoint Presentation Show
This is a stacked line ppt powerpoint presentation show. This is a three stage process. The stages in this process are revenue in percentage, product, stacked line, growth, success.
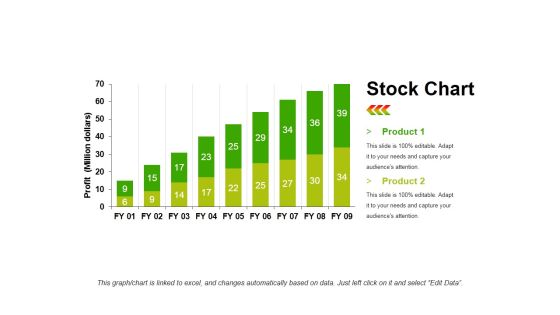
Stock Chart Template 1 Ppt PowerPoint Presentation Infographic Template Objects
This is a stock chart template 1 ppt powerpoint presentation infographic template objects. This is a two stage process. The stages in this process are product, profit, bar graph, growth, success.

Stacked Area Clustered Column Ppt PowerPoint Presentation File Background Designs
This is a stacked area clustered column ppt powerpoint presentation file background designs. This is a three stage process. The stages in this process are product, in percentage, growth, success, bar graph.

Clustered Column Template 1 Ppt PowerPoint Presentation Outline File Formats
This is a clustered column template 1 ppt powerpoint presentation outline file formats. This is a two stage process. The stages in this process are product, bar graph, success, growth, finance.

Clustered Column Template 2 Ppt PowerPoint Presentation Summary Smartart
This is a clustered column template 2 ppt powerpoint presentation summary smartart. This is a two stage process. The stages in this process are product, bar graph, in percentage, clustered column, growth.
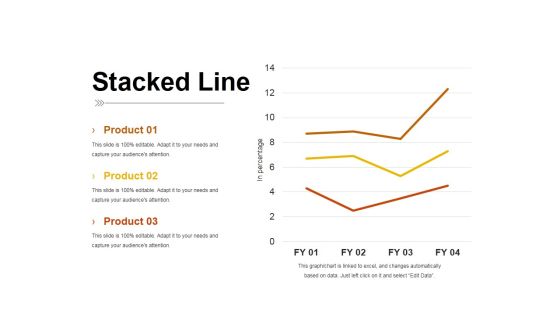
Stacked Line Ppt PowerPoint Presentation Inspiration Pictures
This is a stacked line ppt powerpoint presentation inspiration pictures. This is a three stage process. The stages in this process are product, stacked line, in percentage, business, growth.

Stacked Area Clustered Column Ppt PowerPoint Presentation Summary Professional
This is a stacked area clustered column ppt powerpoint presentation summary professional. This is a three stage process. The stages in this process are product, bar graph, growth, success, in percentage.
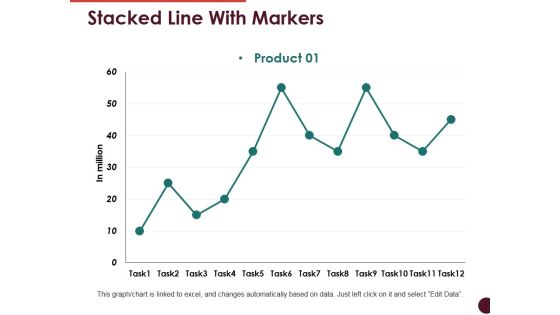
Stacked Line With Markers Ppt PowerPoint Presentation Show Templates
This is a stacked line with markers ppt powerpoint presentation show templates. This is a one stage process. The stages in this process are product, bar graph, growth, success, business.

Line Chart Ppt PowerPoint Presentation Layouts Example
This is a line chart ppt powerpoint presentation layouts example. This is a two stage process. The stages in this process are sales in percentage, product, financial years, growth, success.
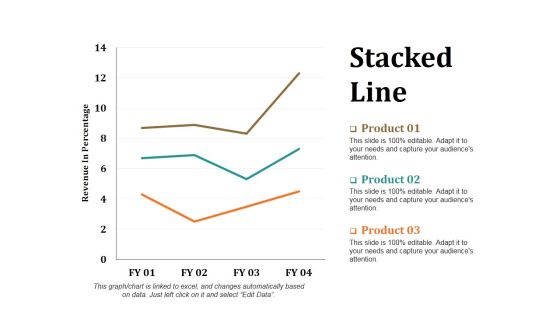
Stacked Line Ppt PowerPoint Presentation Layouts Portrait
This is a stacked line ppt powerpoint presentation layouts portrait. This is a three stage process. The stages in this process are revenue in percentage, stacked line, product, growth, success.
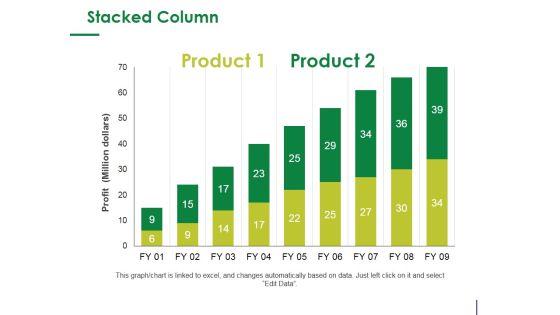
Stacked Column Ppt PowerPoint Presentation Infographic Template Design Ideas
This is a stacked column ppt powerpoint presentation infographic template design ideas. This is a two stage process. The stages in this process are product, profit, bar graph, growth, success.

Clustered Column Line Ppt PowerPoint Presentation Summary Background Image
This is a clustered column line ppt powerpoint presentation summary background image. This is a four stage process. The stages in this process are in percentage, product, graph, growth, success.

Clustered Column Ppt PowerPoint Presentation File Graphics
This is a clustered column ppt powerpoint presentation file graphics. This is a two stage process. The stages in this process are product, financial year, sales in percentage, graph, growth.

Competitor Revenue And Profit Template 1 Ppt PowerPoint Presentation Infographic Template Designs Download
This is a competitor revenue and profit template 1 ppt powerpoint presentation infographic template designs download. This is a five stage process. The stages in this process are revenue, profit, competitor, bar graph, growth.

Column Chart Ppt PowerPoint Presentation Model Clipart Images
This is a column chart ppt powerpoint presentation model clipart images. This is a two stage process. The stages in this process are product, bar graph, growth, success, business.

Competitor Revenue And Profit Template 2 Ppt PowerPoint Presentation Infographic Template Format Ideas
This is a competitor revenue and profit template 2 ppt powerpoint presentation infographic template format ideas. This is a five stage process. The stages in this process are competitor, revenue, profit, graph, growth.

Line Chart Ppt PowerPoint Presentation File Example File
This is a line chart ppt powerpoint presentation file example file. This is a two stage process. The stages in this process are product, in percentage, in years, growth, success.
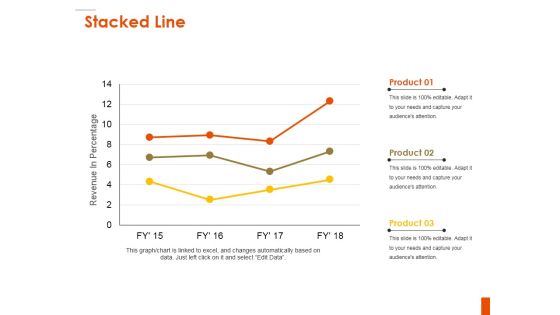
Stacked Line Ppt PowerPoint Presentation Outline Inspiration
This is a stacked line ppt powerpoint presentation outline inspiration. This is a three stage process. The stages in this process are revenue in percentage, product, growth, business, success.

Column Chart Ppt PowerPoint Presentation Infographics Deck
This is a column chart ppt powerpoint presentation infographics deck. This is a two stage process. The stages in this process are product, expenditure in, years, bar graph, growth.

Some Quick Facts Ppt PowerPoint Presentation Inspiration Graphics
This is a some quick facts ppt powerpoint presentation inspiration graphics. This is a three stage process. The stages in this process are customers in, sales growth in, staff works weekly.

Competitor Revenue And Profit Template 1 Ppt PowerPoint Presentation Professional Example File
This is a competitor revenue and profit template 1 ppt powerpoint presentation professional example file. This is a five stage process. The stages in this process are business, finance, marketing, strategy, analysis, growth.

Combo Chart Ppt PowerPoint Presentation Slides Show
This is a combo chart ppt powerpoint presentation slides show. This is a three stage process. The stages in this process are combo chart, market size, product, bar graph, growth.
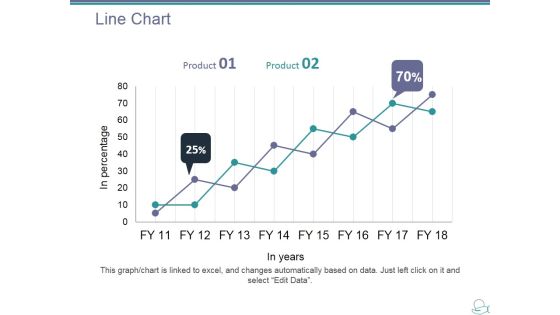
Line Chart Ppt PowerPoint Presentation Layouts Show
This is a line chart ppt powerpoint presentation layouts show. This is a two stage process. The stages in this process are product, in years, in percentage, line chart, growth.

Scatter Chart Ppt PowerPoint Presentation Ideas Designs Download
This is a scatter chart ppt powerpoint presentation ideas designs download. This is a one stage process. The stages in this process are product, dollar, in percentage, growth, success.
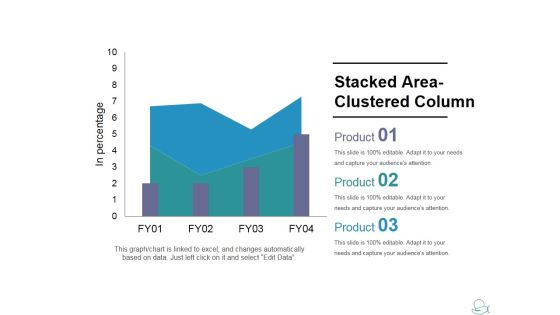
Stacked Area Clustered Column Ppt PowerPoint Presentation Slides Shapes
This is a stacked area clustered column ppt powerpoint presentation slides shapes. This is a three stage process. The stages in this process are product, growth, success graph, business.

Column Chart Ppt PowerPoint Presentation Layouts Background Images
This is a column chart ppt powerpoint presentation layouts background images. This is a two stage process. The stages in this process are product, in months, graph, growth, success.
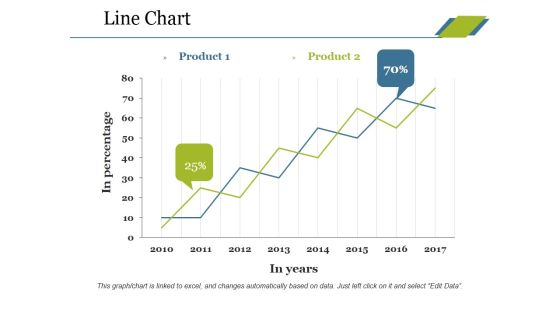
Line Chart Ppt PowerPoint Presentation Professional Tips
This is a line chart ppt powerpoint presentation professional tips. This is a two stage process. The stages in this process are product, in percentage, in years, growth, success.

Bubble Chart Ppt PowerPoint Presentation Inspiration Graphics Download
This is a bubble chart ppt powerpoint presentation inspiration graphics download. This is a three stage process. The stages in this process are product, growth, success, bubble chart, business.

Bar Diagram Ppt PowerPoint Presentation Gallery Structure
This is a bar diagram ppt powerpoint presentation gallery structure. This is a three stage process. The stages in this process are financial in years, sales in percentage, bar graph, growth, success.

Column Chart Ppt PowerPoint Presentation Layouts Tips
This is a column chart ppt powerpoint presentation layouts tips. This is a six stage process. The stages in this process are sales in percentage, financial year, bar graph, growth, success.

Bar Diagram Ppt PowerPoint Presentation Pictures Background Image
This is a bar diagram ppt powerpoint presentation pictures background image. This is a three stage process. The stages in this process are financial in years, sales in percentage, bar graph, growth, success.

Column Chart Ppt PowerPoint Presentation Slides Visual Aids
This is a column chart ppt powerpoint presentation slides visual aids. This is a six stage process. The stages in this process are bar graph, growth, success, sales in percentage, financial year.

Combo Chart Ppt PowerPoint Presentation Inspiration Slide Portrait
This is a combo chart ppt powerpoint presentation inspiration slide portrait. This is a three stage process. The stages in this process are product, market size, bar chart, growth, success.

Line Chart Ppt PowerPoint Presentation Slides Ideas
This is a line chart ppt powerpoint presentation slides ideas. This is a two stage process. The stages in this process are product, in percentage, in years, growth, success.
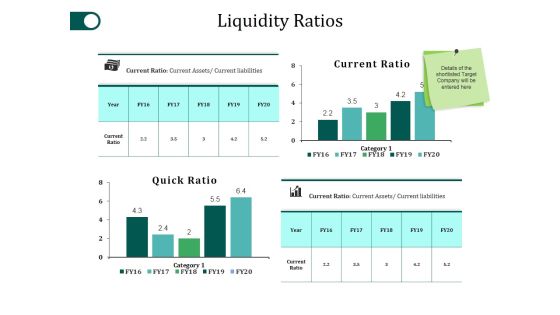
Liquidity Ratios Ppt PowerPoint Presentation Ideas Design Inspiration
This is a liquidity ratios ppt powerpoint presentation ideas design inspiration. This is a four stage process. The stages in this process are current ratio, quick ratio, category, business, growth.

Line Chart Ppt PowerPoint Presentation Show Guide
This is a line chart ppt powerpoint presentation show guide. This is a two stage process. The stages in this process are product, sales in percentage, financial years, growth, success.
