Engineering Change

Automotive Industry Report Motor Vehicle Production By Type Portrait PDF
This slide covers the details of the data related to vehicle production all over the world in last 10 years to know where we are right now and what is needed to be at a good spot in future. Pitch your topic with ease and precision using this Automotive Industry Report Motor Vehicle Production By Type Portrait PDF. This layout presents information on Automotive Industry Report, Motor Vehicle Production. It is also available for immediate download and adjustment. So, changes can be made in the color, design, graphics or any other component to create a unique layout.

Brand Promotion Advertising Communication Process With Feedback Channel Ppt PowerPoint Presentation Layouts Templates PDF
This slide showcases the communication flowchart for the brand marketing campaign. The key elements of the process include sender, encode, message channel, decode, receiver, etc. Pitch your topic with ease and precision using this Brand Promotion Advertising Communication Process With Feedback Channel Ppt PowerPoint Presentation Layouts Templates PDF. This layout presents information on Advertising Communication, Effective Marketing, Advertising Agency. It is also available for immediate download and adjustment. So, changes can be made in the color, design, graphics or any other component to create a unique layout.

Brand Promotion Advertising Goal Achievement Strategy Roadmap Ppt PowerPoint Presentation Ideas Show PDF
This slide covers the strategy roadmap for brand advertising. The plans key elements include organizational vision, purpose, values, goals, strategies, and tactics for goal achievement. Pitch your topic with ease and precision using this Brand Promotion Advertising Goal Achievement Strategy Roadmap Ppt PowerPoint Presentation Ideas Show PDF. This layout presents information on Distribution Points, Instore Sampling, Sampling Program. It is also available for immediate download and adjustment. So, changes can be made in the color, design, graphics or any other component to create a unique layout.

Five Strategies To Overcome Communication Barriers Ppt PowerPoint Presentation Summary Graphics Template PDF
This slide represents the strategies for bridging the communication gap with description. It includes strategies such as make a plan, experience expertise, avoid broken information flow, etc.Pitch your topic with ease and precision using this Five Strategies To Overcome Communication Barriers Ppt PowerPoint Presentation Summary Graphics Template PDF. This layout presents information on Experience Consistency Communication, Flow Expertise. It is also available for immediate download and adjustment. So, changes can be made in the color, design, graphics or any other component to create a unique layout.

Diversified Investment Summary With Actual Return Guidelines PDF
This slide exhibits diversified portfolio to minimize risk and maximize returns by investing in various areas. It also covers buying price, original and current value, actual price and return, Pitch your topic with ease and precision using this Diversified Investment Summary With Actual Return Guidelines PDF. This layout presents information on Buying Price, Current Portfolio Value, Portfolio. It is also available for immediate download and adjustment. So, changes can be made in the color, design, graphics or any other component to create a unique layout.

Investment Summary Report Of ABC Stocks Introduction PDF
The following slide shows portfolio activity over a certain period of time to analyze the market value of firms investment. It also includes period returns, contributions, revenue and expenses. Pitch your topic with ease and precision using this Investment Summary Report Of ABC Stocks Introduction PDF. This layout presents information on Summary Report, Value Summary, Revenues, Expenses. It is also available for immediate download and adjustment. So, changes can be made in the color, design, graphics or any other component to create a unique layout.

Investment Summary Snapshot With Funds Strategy And Actions Mockup PDF
This slide showcases portfolio of investor that provide information on holdings and performance of portfolio. It includes fund name, initial allocation, investment amount, weighted average, latest price , market value and profit or loss. Pitch your topic with ease and precision using this Investment Summary Snapshot With Funds Strategy And Actions Mockup PDF. This layout presents information on Portfolio Funds, Risk Debt Fund, Growth Fund. It is also available for immediate download and adjustment. So, changes can be made in the color, design, graphics or any other component to create a unique layout.

Project Investment Summary With Status Cost And Variance Graphics PDF
The following slide showcases project portfolio summary to provide an insight of programs and their status to create centralized management. It also covers alignment ,risk , budget and planned cost and variance. Pitch your topic with ease and precision using this Project Investment Summary With Status Cost And Variance Graphics PDF. This layout presents information on Risk, Budget Cost, Planned Cost. It is also available for immediate download and adjustment. So, changes can be made in the color, design, graphics or any other component to create a unique layout.
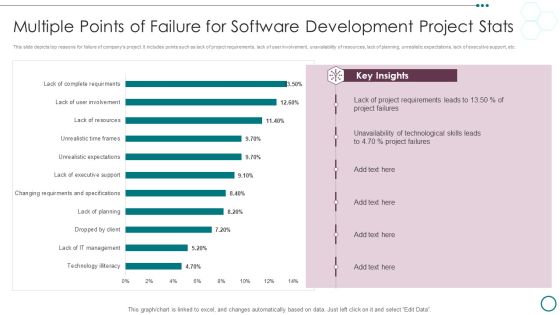
Multiple Points Of Failure For Software Development Project Stats Ppt PowerPoint Presentation Infographics Slides PDF
This slide depicts top reasons for failure of companys project. It includes points such as lack of project requirements, lack of user involvement, unavailability of resources, lack of planning, unrealistic expectations, lack of executive support, etc.Pitch your topic with ease and precision using this Multiple Points Of Failure For Software Development Project Stats Ppt PowerPoint Presentation Infographics Slides PDF. This layout presents information on Project Requirements, Unavailability Technological, Project Failures. It is also available for immediate download and adjustment. So, changes can be made in the color, design, graphics or any other component to create a unique layout.
Promotional Investments Barriers For B2B Sales And Marketing Data Quality Icons PDF
This slide depicts top investment challenges in B2B sales and marketing data quality. It includes barriers such as cost, better ROI with others, inadequate understanding of data quality, lack of results evidenced and absence of decision makers.Pitch your topic with ease and precision using this Promotional Investments Barriers For B2B Sales And Marketing Data Quality Icons PDF. This layout presents information on Loyalty Increases, Products Instagram, Business Presence. It is also available for immediate download and adjustment. So, changes can be made in the color, design, graphics or any other component to create a unique layout.

Survey Stats On Digital Marketing Channel Promotional Investments Areas Brochure PDF
This slide depicts results for different digital marketing channels. It includes digital marketing areas such as social media marketing, email marketing, search marketing, sms and video marketing.Pitch your topic with ease and precision using this Survey Stats On Digital Marketing Channel Promotional Investments Areas Brochure PDF. This layout presents information on Video Marketing, Media Marketing, Search Marketing. It is also available for immediate download and adjustment. So, changes can be made in the color, design, graphics or any other component to create a unique layout.

Quantitative Market Research Survey Results Structure PDF
This slide showcases market survey conducted and data gathered by various people to know the topics that drive better customer engagement. It also covers the location of the users. Pitch your topic with ease and precision using this Quantitative Market Research Survey Results Structure PDF. This layout presents information on Marketing Manager, Customer Support, Data Analyst. It is also available for immediate download and adjustment. So, changes can be made in the color, design, graphics or any other component to create a unique layout.

Survey Showing Usage Of Quantitative Market Research By Teams Formats PDF
The following slide exhibits survey representing response of users on their usage of quantitative research methods. The answers includes at least 1 per project, sometimes, rarely, never and not sure. Pitch your topic with ease and precision using this Survey Showing Usage Of Quantitative Market Research By Teams Formats PDF. This layout presents information on Quantitative Market Research, Survey, Teams. It is also available for immediate download and adjustment. So, changes can be made in the color, design, graphics or any other component to create a unique layout.

Major Objectives Of Services Promotional Campaign Activities Introduction PDF
The following slide highlights the major objectives of service promotional activities. It depicts objective, target and completion status, where objective includes build awareness, create differentiation, communicate benefits, develop brand image, customer persuasion, encourage trail service, attract new customers and increase selling frequency. Pitch your topic with ease and precision using this Major Objectives Of Services Promotional Campaign Activities Introduction PDF. This layout presents information on Target Brand, Customers, Target. It is also available for immediate download and adjustment. So, changes can be made in the color, design, graphics or any other component to create a unique layout.
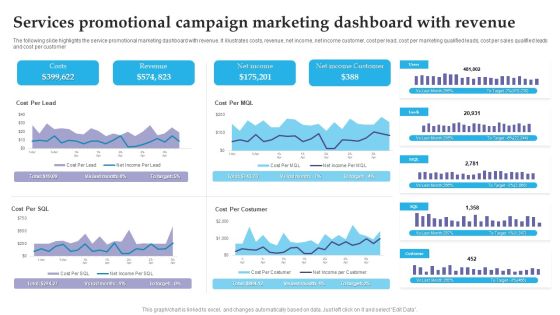
Services Promotional Campaign Marketing Dashboard With Revenue Brochure PDF
The following slide highlights the service promotional marketing dashboard with revenue. It illustrates costs, revenue, net income, net income customer, cost per lead, cost per marketing qualified leads, cost per sales qualified leads and cost per customer. Pitch your topic with ease and precision using this Services Promotional Campaign Marketing Dashboard With Revenue Brochure PDF. This layout presents information on Costs, Revenue, Net Income. It is also available for immediate download and adjustment. So, changes can be made in the color, design, graphics or any other component to create a unique layout.
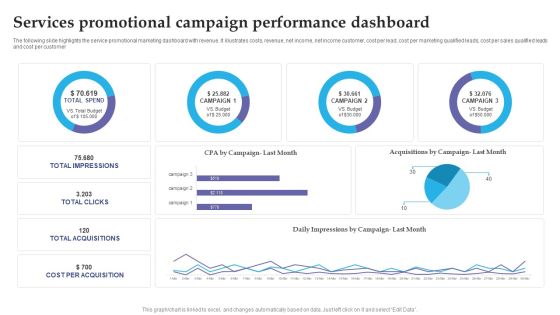
Services Promotional Campaign Performance Dashboard Slides PDF
The following slide highlights the service promotional marketing dashboard with revenue. It illustrates costs, revenue, net income, net income customer, cost per lead, cost per marketing qualified leads, cost per sales qualified leads and cost per customer. Pitch your topic with ease and precision using this Services Promotional Campaign Performance Dashboard Slides PDF. This layout presents information on Services Promotional, Campaign Performance Dashboard. It is also available for immediate download and adjustment. So, changes can be made in the color, design, graphics or any other component to create a unique layout.

Erp Project Metrics Plan Dashboard Slides PDF
This slide focuses on project management dashboard for enterprise resource planning which covers the total hours spent that includes project preparation, business blueprint, project realization, final preparation, go live and support with gantt chart showing detailed tasks. Pitch your topic with ease and precision using this Erp Project Metrics Plan Dashboard Slides PDF. This layout presents information on Business Blueprint, Project Preparation, Project Realization. It is also available for immediate download and adjustment. So, changes can be made in the color, design, graphics or any other component to create a unique layout.

IT Operations Dashboard For Project Metrics Portrait PDF
This slide focuses on dashboard that provides information about the information technology operations for managing IT project which covers the investments, billed amount, time taken to complete the project, customer satisfaction, monthly expenses, service level agreement status, etc. Pitch your topic with ease and precision using this IT Operations Dashboard For Project Metrics Portrait PDF. This layout presents information on Revenues, Investments, Monthly Expenses. It is also available for immediate download and adjustment. So, changes can be made in the color, design, graphics or any other component to create a unique layout.

Multi Project Metrics Dashboard With Overall Status Pictures PDF
This slide covers the dashboard that shows the status of project such as status of schedule, resource, quality with projects which are on schedule, in which issues has been occurred, that are critical, etc. That helps the project managers to understand the progress accurately. Pitch your topic with ease and precision using this Multi Project Metrics Dashboard With Overall Status Pictures PDF. This layout presents information on Multi Project, Metrics Dashboard. It is also available for immediate download and adjustment. So, changes can be made in the color, design, graphics or any other component to create a unique layout.

Project Dashboard To Track Success Metrics Background PDF
This slide focuses on project management dashboard which covers summary of project, resources and tasks, tasks that are in progress, costs and budget that shows the over costed, late, on time and early tasks, resources rate using pie chart, earned value, etc. Pitch your topic with ease and precision using this Project Dashboard To Track Success Metrics Background PDF. This layout presents information on Cost And Budget, Project Summary, Resource Allocation. It is also available for immediate download and adjustment. So, changes can be made in the color, design, graphics or any other component to create a unique layout.
Project Metrics Dashboard Depicting Tracking System Inspiration PDF
This slide focuses on project management dashboard which covers the four spirit teams, iteration defects by priority with quarterly roadmap with legends such as high attention, low, none, normal and resolved immediately with time in iteration, etc. Pitch your topic with ease and precision using this Project Metrics Dashboard Depicting Tracking System Inspiration PDF. This layout presents information on Project Metrics, Dashboard Depicting, Tracking System. It is also available for immediate download and adjustment. So, changes can be made in the color, design, graphics or any other component to create a unique layout.

Project Metrics Dashboard Showing Organizational Progress Demonstration PDF
This slide covers the project management dashboard that shows the two year timeline of project tasks and activities such as hiring survey consultants, writing curriculum, creating employees training programs with initiative, its description, budget, end date, milestones, etc. Pitch your topic with ease and precision using this Project Metrics Dashboard Showing Organizational Progress Demonstration PDF. This layout presents information on Budget, Survey, Employees. It is also available for immediate download and adjustment. So, changes can be made in the color, design, graphics or any other component to create a unique layout.

Project Metrics Dashboard With Active Issues Topics PDF
This slide focuses on the project management dashboard which shows the number of active emergency risks and issues, projects, current user count, splitting of project status by priority level, capacity percentage, top recent assignees with open, resolved and closed projects. Pitch your topic with ease and precision using this Project Metrics Dashboard With Active Issues Topics PDF. This layout presents information on Project Metrics, Dashboard With Active Issues. It is also available for immediate download and adjustment. So, changes can be made in the color, design, graphics or any other component to create a unique layout.
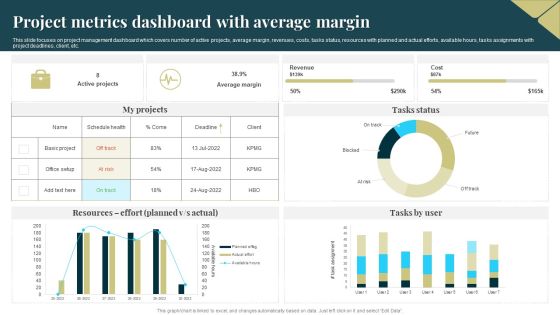
Project Metrics Dashboard With Average Margin Sample PDF
This slide focuses on project management dashboard which covers number of active projects, average margin, revenues, costs, tasks status, resources with planned and actual efforts, available hours, tasks assignments with project deadlines, client, etc. Pitch your topic with ease and precision using this Project Metrics Dashboard With Average Margin Sample PDF. This layout presents information on Average Margin, Revenue, Cost. It is also available for immediate download and adjustment. So, changes can be made in the color, design, graphics or any other component to create a unique layout.
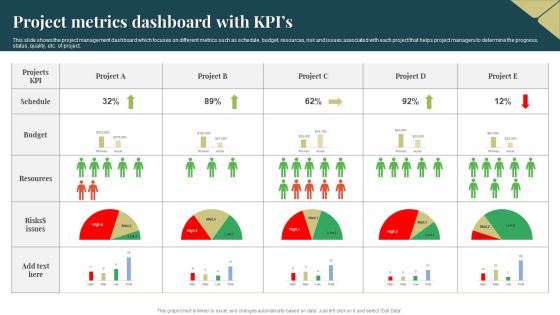
Project Metrics Dashboard With Kpis Ideas PDF
This slide shows the project management dashboard which focuses on different metrics such as schedule, budget, resources, risk and issues associated with each project that helps project managers to determine the progress, status, quality, etc. of project. Pitch your topic with ease and precision using this Project Metrics Dashboard With Kpis Ideas PDF. This layout presents information on Resources, Budget, Risks. It is also available for immediate download and adjustment. So, changes can be made in the color, design, graphics or any other component to create a unique layout.

Project Metrics Dashboard With Monthly Workload Topics PDF
This slide shows the project management dashboard which covers the number of tasks completed in last one week, return on investment on overall project, milestones covered, performance of employees, tasks created, competed, work in progress, started, etc. Pitch your topic with ease and precision using this Project Metrics Dashboard With Monthly Workload Topics PDF. This layout presents information on Investment, Employee Performance, Project Metrics Dashboard. It is also available for immediate download and adjustment. So, changes can be made in the color, design, graphics or any other component to create a unique layout.
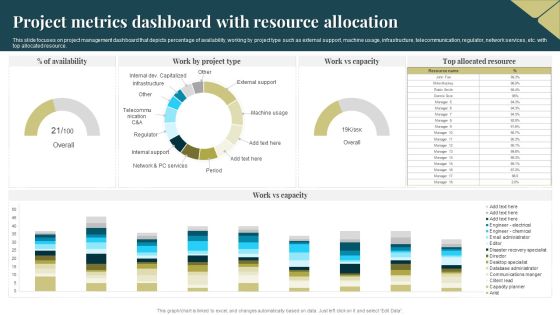
Project Metrics Dashboard With Resource Allocation Portrait PDF
This slide focuses on project management dashboard that depicts percentage of availability, working by project type such as external support, machine usage, infrastructure, telecommunication, regulator, network services, etc. with top allocated resource. Pitch your topic with ease and precision using this Project Metrics Dashboard With Resource Allocation Portrait PDF. This layout presents information on Project Metrics Dashboard, Resource Allocation. It is also available for immediate download and adjustment. So, changes can be made in the color, design, graphics or any other component to create a unique layout.

Project Metrics Dashboard With Responsibilities Graphics PDF
This slide focuses on project management dashboard which shows the number of projects, types of objects, key performance indicators, viewpoints, overall project status with actions and progress, responsibilities with linked object types and actions, etc. Pitch your topic with ease and precision using this Project Metrics Dashboard With Responsibilities Graphics PDF. This layout presents information on Project Metrics, Dashboard With Responsibilities. It is also available for immediate download and adjustment. So, changes can be made in the color, design, graphics or any other component to create a unique layout.
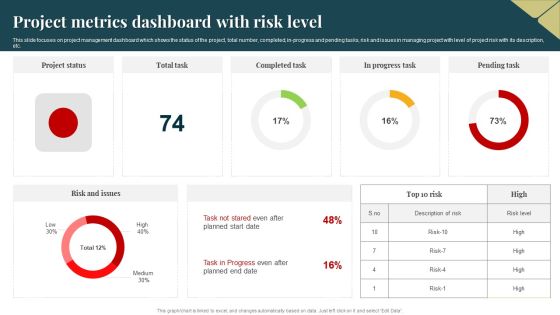
Project Metrics Dashboard With Risk Level Guidelines PDF
This slide focuses on project management dashboard which shows the status of the project, total number, completed, in progress and pending tasks, risk and issues in managing project with level of project risk with its description, etc. Pitch your topic with ease and precision using this Project Metrics Dashboard With Risk Level Guidelines PDF. This layout presents information on Project Metrics Dashboard, Risk Level. It is also available for immediate download and adjustment. So, changes can be made in the color, design, graphics or any other component to create a unique layout.

Project Metrics Dashboard With Stages Download PDF
This slide shows the project management dashboard which includes start and end date if project, its duration, status of the project, key project links and project stages with metrics such as proposal, kick off, discovery, actions, optimization , etc. Pitch your topic with ease and precision using this Project Metrics Dashboard With Stages Download PDF. This layout presents information on Economic, Project Plan, Execution. It is also available for immediate download and adjustment. So, changes can be made in the color, design, graphics or any other component to create a unique layout.
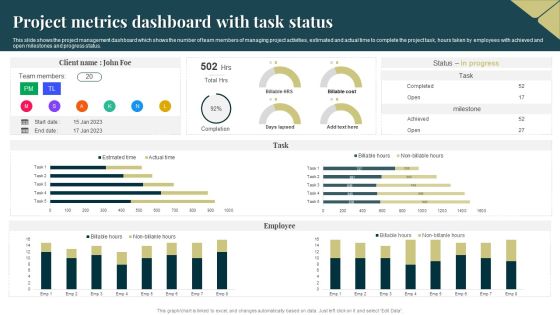
Project Metrics Dashboard With Task Status Rules PDF
This slide shows the project management dashboard which shows the number of team members of managing project activities, estimated and actual time to complete the project task, hours taken by employees with achieved and open milestones and progress status. Pitch your topic with ease and precision using this Project Metrics Dashboard With Task Status Rules PDF. This layout presents information on Team Members, Employee. It is also available for immediate download and adjustment. So, changes can be made in the color, design, graphics or any other component to create a unique layout.

Project Metrics Dashboard With Team Requests Background PDF
This slide focuses on the project management dashboard which shows the creation of monthly number of requests, requests made by departmental teams, average completion time in days with the number of requests created on week days, etc. Pitch your topic with ease and precision using this Project Metrics Dashboard With Team Requests Background PDF. This layout presents information on Project Metrics Dashboard, Team Requests. It is also available for immediate download and adjustment. So, changes can be made in the color, design, graphics or any other component to create a unique layout.
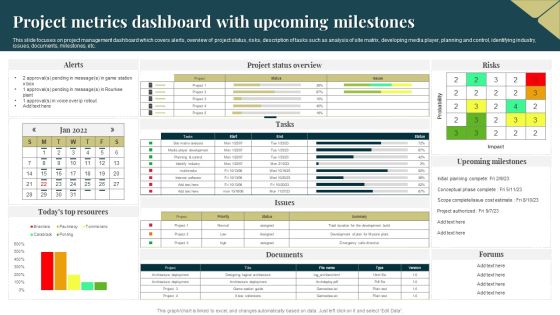
Project Metrics Dashboard With Upcoming Milestones Demonstration PDF
This slide focuses on project management dashboard which covers alerts, overview of project status, risks, description of tasks such as analysis of site matrix, developing media player, planning and control, identifying industry, issues, documents, milestones, etc. Pitch your topic with ease and precision using this Project Metrics Dashboard With Upcoming Milestones Demonstration PDF. This layout presents information on Probability, Project, Risks. It is also available for immediate download and adjustment. So, changes can be made in the color, design, graphics or any other component to create a unique layout.

Project Portfolio Metrics Dashboard With Activity Plan Clipart PDF
This slide focuses on project portfolio management dashboard which includes completed projects, budget spent, number of team members, associated risks and issues, activity plan with duration, status percentage, budget allocation, critical issues, tasks, comments, etc. Pitch your topic with ease and precision using this Project Portfolio Metrics Dashboard With Activity Plan Clipart PDF. This layout presents information on Budgets, Team, Risks. It is also available for immediate download and adjustment. So, changes can be made in the color, design, graphics or any other component to create a unique layout.

Due Diligence Checklist For M And A With Status Ppt Icon Brochure PDF
The following slide showcases checklist of due diligence to analyze the company that is being acquired. The checklist includes financial matters, intellectual property, sales, material contracts, litigation, tax matters and their priority, deadline and completion status. Pitch your topic with ease and precision using this Due Diligence Checklist For M And A With Status Ppt Icon Brochure PDF. This layout presents information on Financial Matters, Intellectual Property, Sales. It is also available for immediate download and adjustment. So, changes can be made in the color, design, graphics or any other component to create a unique layout.

Financial Due Diligence For M And A Ppt Layouts Layout PDF
The following slide showcases financial details audited and reviewed in due diligence process for merger and acquisition. Financial information included are statements, balance sheet, assets, liabilities, cash flow and capital expenditure. Pitch your topic with ease and precision using this Financial Due Diligence For M And A Ppt Layouts Layout PDF. This layout presents information on Financial Information, Buyer Side Review, Seller Side Review. It is also available for immediate download and adjustment. So, changes can be made in the color, design, graphics or any other component to create a unique layout.

Monthly Due Diligence Roadmap For M And A Ppt Pictures Guidelines PDF
The following slide showcases the due diligence schedule for merger or acquisition illustrating process preparation, marketing and pre-liminary non-binding bids and final bids. Pitch your topic with ease and precision using this Monthly Due Diligence Roadmap For M And A Ppt Pictures Guidelines PDF. This layout presents information on Process Preparation, Due Diligence, Conduct Management Meetings. It is also available for immediate download and adjustment. So, changes can be made in the color, design, graphics or any other component to create a unique layout.

Prospective Buyer Retention Dashboard With Key Performance Indicators Themes PDF
This slide shows the dashboard representing the key performance metrics for retention of potential customers of the organization. It shows no. of active users, churn rate, cost of customer acquisition, their life time value, monthly recurring revenue etc.Pitch your topic with ease and precision using this Prospective Buyer Retention Dashboard With Key Performance Indicators Themes PDF. This layout presents information on Recurring Revenue, Revenue Growth, Customer Acquisition. It is also available for immediate download and adjustment. So, changes can be made in the color, design, graphics or any other component to create a unique layout.

Retail Merchandising Kpis To Measure Marketing Plan Ideas PDF
Mentioned slide showcases retail merchandising KPIs of different months such as sales per square feet, average transaction value, loss of inventory, foot traffic etc. Store manager can use such KPIs to effectively measure the performance of marketing strategies.Pitch your topic with ease and precision using this Retail Merchandising Kpis To Measure Marketing Plan Ideas PDF. This layout presents information on Average Transaction, Customer Retention, Foot Traffic. It is also available for immediate download and adjustment. So, changes can be made in the color, design, graphics or any other component to create a unique layout.

FMEA Tool For Customer Loan Process Ppt PowerPoint Presentation Layouts Influencers PDF
This slide represents failure mode and effects analysis for a commercial loan process taken by a customer. In this a customer fills out a loan application with incorrect data. It includes analyzing its severity, chances of occurrence, failure detection and RPN.Pitch your topic with ease and precision using this FMEA Tool For Customer Loan Process Ppt PowerPoint Presentation Layouts Influencers PDF. This layout presents information on Process Step, Potential Failure, Potential Effect. It is also available for immediate download and adjustment. So, changes can be made in the color, design, graphics or any other component to create a unique layout.

FMEA Tool Scoring Matrix Ppt PowerPoint Presentation Ideas Influencers PDF
This slide signifies scoring matrix for multiple failure occurrence in an organization with analyzing its severity and action to be taken .It includes frquent , occasional, uncommon and remote probability. Pitch your topic with ease and precision using this FMEA Tool Scoring Matrix Ppt PowerPoint Presentation Ideas Influencers PDF. This layout presents information on Frequent, Catastrophic, Uncommon. It is also available for immediate download and adjustment. So, changes can be made in the color, design, graphics or any other component to create a unique layout.

Production FMEA Tool Ppt PowerPoint Presentation Outline Templates PDF
This slide represents FMEA report of a product manufacturing company to identifying potential failure modes, listing potential failure effects, assigning severity score, determining potential causes, assigning occurrence rating, determining current process controls, and assigning detection rating.Pitch your topic with ease and precision using this Production FMEA Tool Ppt PowerPoint Presentation Outline Templates PDF. This layout presents information on Process Function, Soap Manufacturing, Standard Measurement. It is also available for immediate download and adjustment. So, changes can be made in the color, design, graphics or any other component to create a unique layout.

Dashboard For Customer Satisfaction Survey Outcome Results Topics PDF
This slide showcases outcome of customer satisfaction survey that can help organization to gain insight about customer requirements and implement strategies to reduce customer churn rate in future. It also showcases product recommendation and improvement feedback from customers. Pitch your topic with ease and precision using this Dashboard For Customer Satisfaction Survey Outcome Results Topics PDF. This layout presents information on Dashboard, Customer Satisfaction, Survey Outcome Results. It is also available for immediate download and adjustment. So, changes can be made in the color, design, graphics or any other component to create a unique layout.

Dashboard For Customer Satisfaction Survey Outcome Demonstration PDF
This slide outlines customer satisfaction survey outcome dashboard that can help organization to analyze the ratings and determine areas of improvement in customer service and make changes in strategies to increase the satisfied customers in future. Its key components are survey response rate, total invitations, total responses and CSAT score. Showcasing this set of slides titled Dashboard For Customer Satisfaction Survey Outcome Demonstration PDF. The topics addressed in these templates are Total Invitations, Survey Response Rate, Total Responses. All the content presented in this PPT design is completely editable. Download it and make adjustments in color, background, font etc. as per your unique business setting.
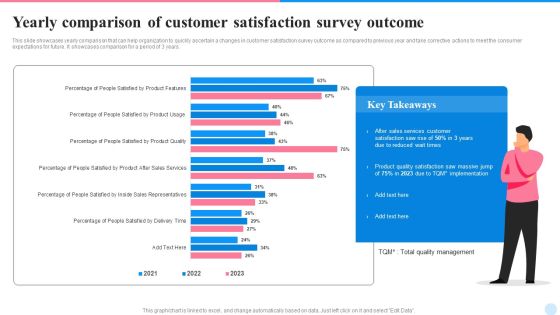
Yearly Comparison Of Customer Satisfaction Survey Outcome Demonstration PDF
This slide showcases yearly comparison that can help organization to quickly ascertain a changes in customer satisfaction survey outcome as compared to previous year and take corrective actions to meet the consumer expectations for future. It showcases comparison for a period of 3 years. Showcasing this set of slides titled Yearly Comparison Of Customer Satisfaction Survey Outcome Demonstration PDF. The topics addressed in these templates are Sales Services Customer, Implementation, Product Quality Satisfaction. All the content presented in this PPT design is completely editable. Download it and make adjustments in color, background, font etc. as per your unique business setting.

Maturity Model To Analyze Organization Grievance Management Operations Elements PDF
This slide showcases model that can help organization to identify the level of customer service level and formulate strategies to improve the potential to resolve complaints. Its key elements are informal, basic, balanced, structure and optimal. Pitch your topic with ease and precision using this Maturity Model To Analyze Organization Grievance Management Operations Elements PDF. This layout presents information on Informal, Balanced, Formal And Structured, Optimal And Intelligent. It is also available for immediate download and adjustment. So, changes can be made in the color, design, graphics or any other component to create a unique layout.

Customer Service Metrics Dashboard For Email And Chat Infographics PDF
This slide showcases dashboard for customer service metrics that can help to identify the customer satisfaction score plus implement strategies in case of decline. Its key KPIs are first response time, requester wait time, first response time and time to close. Pitch your topic with ease and precision using this Customer Service Metrics Dashboard For Email And Chat Infographics PDF. This layout presents information on Customer Service, Metrics Dashboard, Email And Chat. It is also available for immediate download and adjustment. So, changes can be made in the color, design, graphics or any other component to create a unique layout.

Customer Service Metrics Dashboard With Average First Response Time Background PDF
This slide showcases Dashboard for Customer Service metrics that can help organization to easily identify the key pain points of your customers, areas which need additional resources and support agents that can benefit from additional training. It also showcases performance of top and bottom 5 call support agents. Pitch your topic with ease and precision using this Customer Service Metrics Dashboard With Average First Response Time Background PDF. This layout presents information on Average, Abandon Rate, Contact Resolution. It is also available for immediate download and adjustment. So, changes can be made in the color, design, graphics or any other component to create a unique layout.

Customer Service Metrics Dashboard With Net Retention Rate Sample PDF
This slide showcases KPI dashboard for customer service that can help to compare the customer churn rate, revenue churn rate, net retention rate and MRR growth rate as compared to previous month. Its key elements are net promoter score, loyal customer rate, percentage of premium users and customer lifetime value. Pitch your topic with ease and precision using this Customer Service Metrics Dashboard With Net Retention Rate Sample PDF. This layout presents information on Loyal Customer Rate, Premium Users, Customer Lifetime Value. It is also available for immediate download and adjustment. So, changes can be made in the color, design, graphics or any other component to create a unique layout.

Customer Service Metrics Improvement Strategies With Implementation Results Clipart PDF
This slide outlines strategies that can help organization to improve the customer service metrics that are net promoter score, average resolution time, customer satisfactions score and average response time . It also showcases result before and after the implementation of improvement tactics. Pitch your topic with ease and precision using this Customer Service Metrics Improvement Strategies With Implementation Results Clipart PDF. This layout presents information on Customer Service Metrics, Improvement Strategy, Results Before Implementation. It is also available for immediate download and adjustment. So, changes can be made in the color, design, graphics or any other component to create a unique layout.
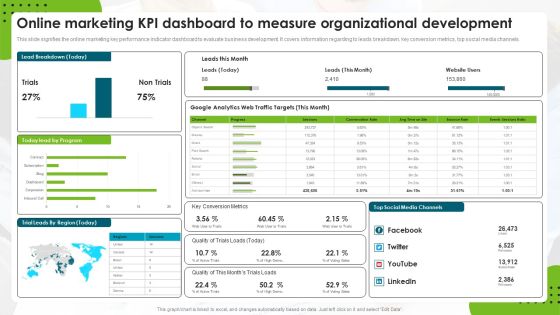
Online Marketing Kpi Dashboard To Measure Organizational Development Rules PDF
This slide signifies the online marketing key performance indicator dashboard to evaluate business development. It covers information regarding to leads breakdown, key conversion metrics, top social media channels. Pitch your topic with ease and precision using this Online Marketing Kpi Dashboard To Measure Organizational Development Rules PDF. This layout presents information on Web Traffic Targets, Google Analytics, Social Media Channels. It is also available for immediate download and adjustment. So, changes can be made in the color, design, graphics or any other component to create a unique layout.

Three Key Workplace Trend Statistics For Staff Slides PDF
This slide represents the organization trends for understanding the initiatives that are shifting the company. It includes effect of positive workplace, reasons of increased interest in remote area, etc. Pitch your topic with ease and precision using this Three Key Workplace Trend Statistics For Staff Slides PDF. This layout presents information on Workplace Environment, Greater Profitability, Customer. It is also available for immediate download and adjustment. So, changes can be made in the color, design, graphics or any other component to create a unique layout.

Highly Ranked Ethical Investing Stocks Infographics PDF
This slide represents the ten best stocks for ethical investments. It includes details related to the overall , growth, valuation, efficiency, financial strength, dividends and momentum rating scores. Pitch your topic with ease and precision using this Highly Ranked Ethical Investing Stocks Infographics PDF. This layout presents information on Valuation Ratings Score, Growth Ratings Score, Financial Strength Ratings Score. It is also available for immediate download and adjustment. So, changes can be made in the color, design, graphics or any other component to create a unique layout.

HR Operations Process Model Ppt PowerPoint Presentation Summary Guide PDF
This slide shows model of human resource planning process to achieve organizational goals with optimum use of human resources. It includes key steps such as considerations, techniques in demand and supply forecasting, shortages and reductions.Pitch your topic with ease and precision using this HR Operations Process Model Ppt PowerPoint Presentation Summary Guide PDF. This layout presents information on Considerations, Techniques, External Factors. It is also available for immediate download and adjustment. So, changes can be made in the color, design, graphics or any other component to create a unique layout.

Comparative Analysis Of Insider Threat In Cyber Security Detection Software Guidelines PDF
This slide shows comparison of software available for detecting insider threat. It provides information about tools, features, user reviews, detection rate, free trial and pricing. Pitch your topic with ease and precision using this Comparative Analysis Of Insider Threat In Cyber Security Detection Software Guidelines PDF. This layout presents information on User Reviews, Detection Rate, Free Trial. It is also available for immediate download and adjustment. So, changes can be made in the color, design, graphics or any other component to create a unique layout.

Impact Of Insider Threat In Cyber Security On Business Operations Microsoft PDF
This slide shows impact of insider threat on business operations. It contains information about operational disruption, damaging brand image, loss of sensitive information, market value, etc. Pitch your topic with ease and precision using this Impact Of Insider Threat In Cyber Security On Business Operations Microsoft PDF. This layout presents information on Operational Disruption Or Outage, Brand Damage, Loss Critical Data. It is also available for immediate download and adjustment. So, changes can be made in the color, design, graphics or any other component to create a unique layout.

Insider Threat In Cyber Security Detection And Prevention Dashboard Diagrams PDF
This slide shows dashboard for detecting and preventing insider threats. It provides details about antivirus, vector detection, patch, admin access, email security, network and endpoint threat, etc. Pitch your topic with ease and precision using this Insider Threat In Cyber Security Detection And Prevention Dashboard Diagrams PDF. This layout presents information on Active Clients, Network Threat Prevention, Endpoint Threat Prevention. It is also available for immediate download and adjustment. So, changes can be made in the color, design, graphics or any other component to create a unique layout.

Insider Threat In Cyber Security Management Plan With Case Status Graphics PDF
This slide shows plan for managing insider risk with case status. It provides information about users, alert, status, severity, time detected, action plan, etc. Pitch your topic with ease and precision using this Insider Threat In Cyber Security Management Plan With Case Status Graphics PDF. This layout presents information on Requires Review, Action Plan, Case Status. It is also available for immediate download and adjustment. So, changes can be made in the color, design, graphics or any other component to create a unique layout.
Insider Threat In Cyber Security Tracking Dashboard With User Details Portrait PDF
This slide shows user details tracked by insider threat dashboard. It provides information such as exposure events, file activity, archive, document, image, pdf, ppt, scripts, etc. Pitch your topic with ease and precision using this Insider Threat In Cyber Security Tracking Dashboard With User Details Portrait PDF. This layout presents information on Private Data, Exposure Events, User Activity, File Activity, Over Time. It is also available for immediate download and adjustment. So, changes can be made in the color, design, graphics or any other component to create a unique layout.

Performance Coaching Program For Leadership Skills Ppt Infographics Sample PDF
The following slide shows performance coaching program which can support leaders in improving their competencies. It includes information about program name, appropriate for, requisites, delivery mode, duration and charges. Pitch your topic with ease and precision using this Performance Coaching Program For Leadership Skills Ppt Infographics Sample PDF. This layout presents information on Team Coaching, In Depth Coaching, Leadership And Performance. It is also available for immediate download and adjustment. So, changes can be made in the color, design, graphics or any other component to create a unique layout.
 Home
Home