AI PPT Maker
Templates
PPT Bundles
Design Services
Business PPTs
Business Plan
Management
Strategy
Introduction PPT
Roadmap
Self Introduction
Timelines
Process
Marketing
Agenda
Technology
Medical
Startup Business Plan
Cyber Security
Dashboards
SWOT
Proposals
Education
Pitch Deck
Digital Marketing
KPIs
Project Management
Product Management
Artificial Intelligence
Target Market
Communication
Supply Chain
Google Slides
Research Services
 One Pagers
All Categories
-
Home
- Customer Favorites
- Engineer Icon
Engineer Icon
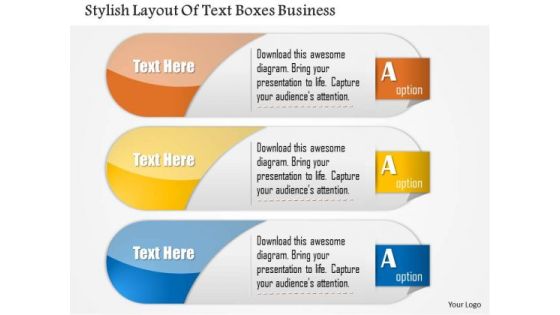
Consulting Slides Stylish Layout Of Text Boxes Business Presentation
Our awesome diagram consists with stylish text boxes. You can add text to text placeholders. This diagram is designed to help bullet-point your views and thoughts.
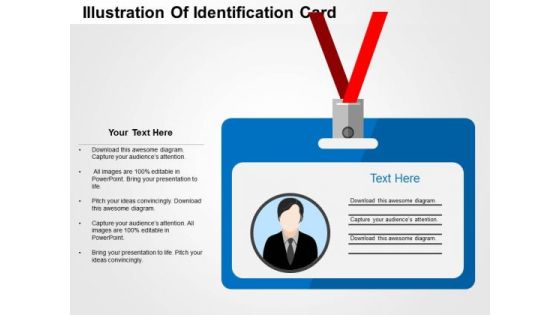
Illustration Of Identification Card PowerPoint Templates
This PowerPoint template contains graphics of ID Card. This PPT diagram has been designed with corporate identity card. Use this professional diagram slide to make appealing presentations.
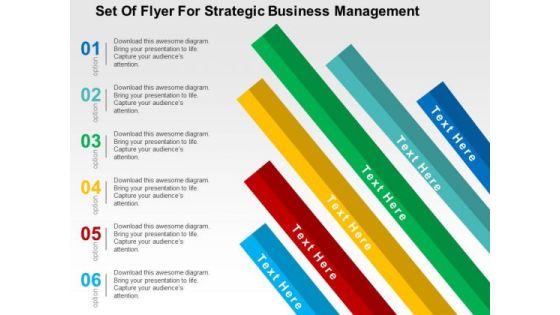
Set Of Flyer For Strategic Business Management PowerPoint Template
This business slide has been designed with set of flyer. You may download this diagram to display strategic business management. Download this diagram slide to make impressive presentations.
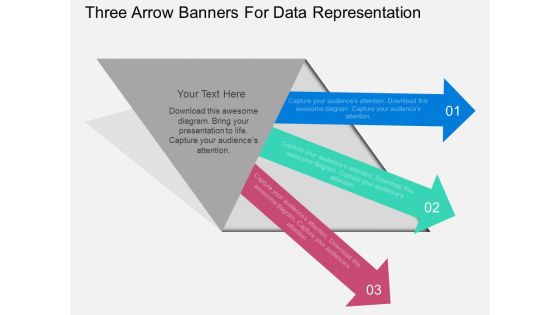
Three Arrow Banners For Data Representation Powerpoint Template
This business diagram contains graphics three arrow banners. Our professionally designed business diagram helps to portray business concepts in visual manner. Enlighten your audience with your breathtaking ideas.

Infographic For Global Business Analysis Powerpoint Templates
Our professionally designed business diagram is as an effective tool to display global business analysis. It contains circular infographic. This diagram can be useful for business presentations.

Layout Of Arrows Infographic Powerpoint Templates
Our professionally designed business diagram is as an effective tool for communicating concepts of global technology. This slide illustrates arrows infographic. Convey your views with this diagram slide.
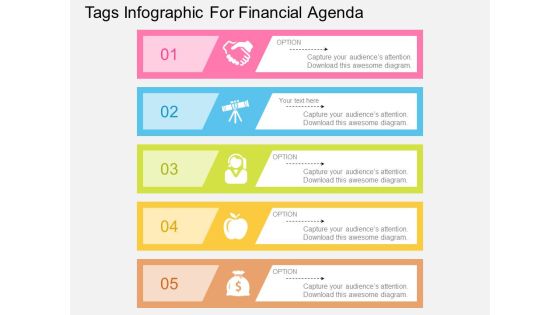
Tags Infographic For Financial Agenda Powerpoint Template
Our professionally designed business diagram is as an effective tool for communicating financial agenda. This PPT slide illustrates text tags infographic. Convey your views with this diagram slide.
Time Is Money Concept Powerpoint Templates
The above template displays a diagram of four tags. This diagram has been professionally designed to display steps of goal setting. Capture the attention of your audience.

World Map For Global Business Analysis Powerpoint Slides
This professionally designed PowerPoint template displays diagram of world map. You can download this diagram to exhibit global business analysis. Above PPT slide is suitable for business presentation.

World Map With Percentage Value Powerpoint Slides
This professionally designed PowerPoint template displays diagram of world map. You can download this diagram to exhibit global business analysis. Above PPT slide is suitable for business presentation.
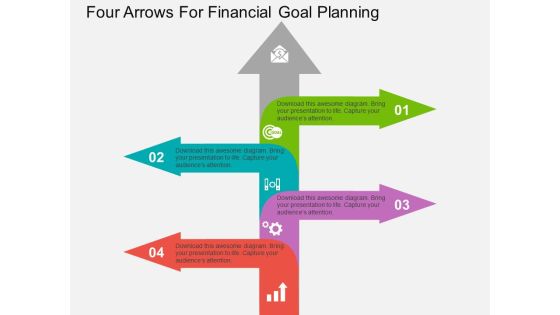
Four Arrows For Financial Goal Planning Powerpoint Template
This business diagram has been designed with arrows infographic. It may use to display financial goal planning. Prove the viability of your ideas using this business diagram

Binary Numbers Big Data Processing Powerpoint Template
This PowerPoint template has been designed with diagram of binary system. Download this PPT slide to display big data processing. Download this diagram slide for technology related presentations.
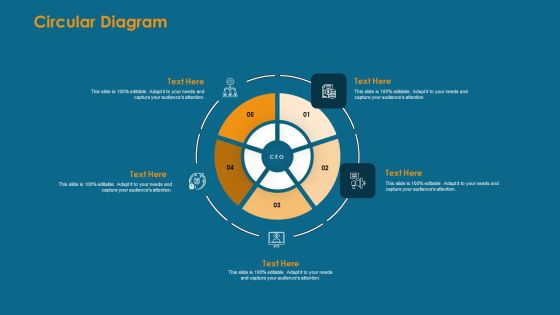
Formulating And Implementing Organization Sales Action Plan Circular Diagram Ppt PowerPoint Presentation Ideas Images PDF
Presenting formulating and implementing organization sales action plan circular diagram ppt powerpoint presentation ideas images pdf to provide visual cues and insights. Share and navigate important information on five stages that need your due attention. This template can be used to pitch topics like circular diagram. In addition, this PPT design contains high-resolution images, graphics, etc, that are easily editable and available for immediate download.

Initiatives To Manage Reduced Footfall At Zoo Case Competition Linear Diagram Ppt Show Infographic Template PDF
Presenting initiatives to manage reduced footfall at zoo case competition linear diagram ppt show infographic template pdf. to provide visual cues and insights. Share and navigate important information on five stages that need your due attention. This template can be used to pitch topics like linear diagram. In addtion, this PPT design contains high resolution images, graphics, etc, that are easily editable and available for immediate download.
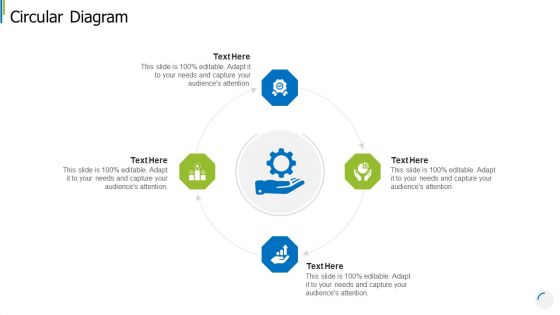
Procedure Management Tools To Decrease Vendor Risks And Enhance Administrative Effectiveness Circular Diagram Ideas PDF
Presenting procedure management tools to decrease vendor risks and enhance administrative effectiveness circular diagram ideas pdf to provide visual cues and insights. Share and navigate important information on four stages that need your due attention. This template can be used to pitch topics like circular diagram. In addtion, this PPT design contains high resolution images, graphics, etc, that are easily editable and available for immediate download.
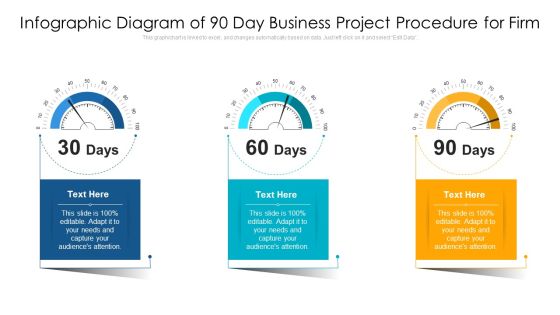
Infographic Diagram Of 90 Day Business Project Procedure For Firm Ppt PowerPoint Presentation Gallery Inspiration PDF
Showcasing this set of slides titled infographic diagram of 90 day business project procedure for firm ppt powerpoint presentation gallery inspiration pdf. The topics addressed in these templates are infographic diagram of 90 day business project procedure for firm. All the content presented in this PPT design is completely editable. Download it and make adjustments in color, background, font etc. as per your unique business setting.
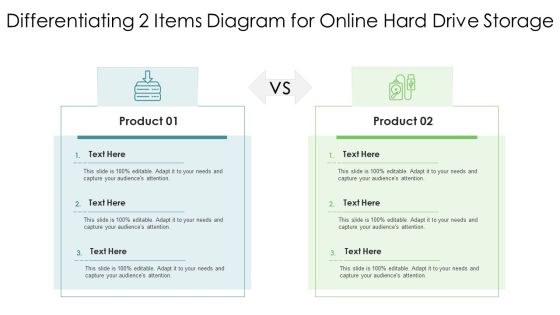
Differentiating 2 Items Diagram For Online Hard Drive Storage Pictures PDF
Presenting differentiating 2 items diagram for online hard drive storage pictures pdf to provide visual cues and insights. Share and navigate important information on two stages that need your due attention. This template can be used to pitch topics like differentiating 2 items diagram for online hard drive storage. In addtion, this PPT design contains high resolution images, graphics, etc, that are easily editable and available for immediate download.

One Page Overview Of Network Diagram For Project Management PDF Document PPT Template
Presenting you an exemplary One Page Overview Of Network Diagram For Project Management PDF Document PPT Template. Our one-pager template comprises all the must-have essentials of an inclusive document. You can edit it with ease, as its layout is completely editable. With such freedom, you can tweak its design and other elements to your requirements. Download this One Page Overview Of Network Diagram For Project Management PDF Document PPT Template Download now.
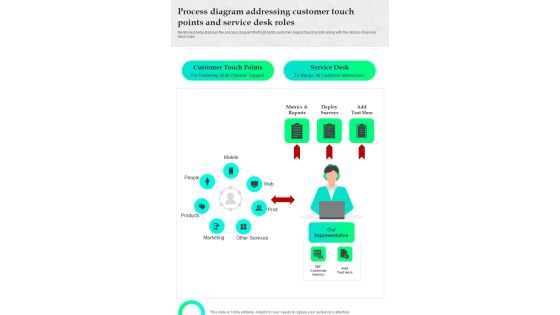
Proposal For IT Assistance Services Process Diagram Addressing Customer One Pager Sample Example Document
Presenting you an exemplary Proposal For IT Assistance Services Process Diagram Addressing Customer One Pager Sample Example Document. Our one pager comprises all the must have essentials of an inclusive document. You can edit it with ease, as its layout is completely editable. With such freedom, you can tweak its design and other elements to your requirements. Download this Proposal For IT Assistance Services Process Diagram Addressing Customer One Pager Sample Example Document brilliant piece now.
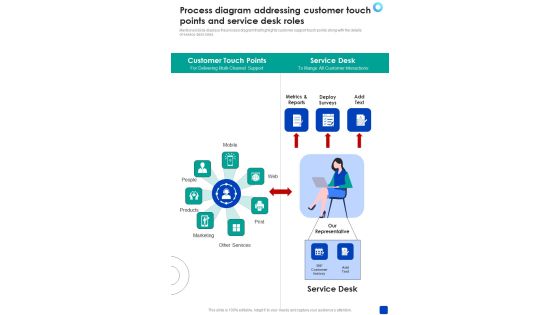
Process Diagram Addressing Customer Touch Points One Pager Sample Example Document
Presenting you an exemplary Process Diagram Addressing Customer Touch Points One Pager Sample Example Document. Our one-pager comprises all the must-have essentials of an inclusive document. You can edit it with ease, as its layout is completely editable. With such freedom, you can tweak its design and other elements to your requirements. Download this Process Diagram Addressing Customer Touch Points One Pager Sample Example Document brilliant piece now.

Actions To Achieve Result 6 Stages Steps Writing Business Plan PowerPoint Templates
We present our actions to achieve result 6 stages steps writing business plan PowerPoint templates.Use our Arrows PowerPoint Templates because you are the star of your enlightened team. Download our Shapes PowerPoint Templates because this PPt slide helps you to measure key aspects of the current process and collect relevant data. Use our Metaphors-Visual Concepts PowerPoint Templates because our helpful and interactive Diagram is a wonderful tool to serve your purpose. Make interaction between groups using this seamless system. Use our Signs PowerPoint Templates because this is an appropriate layout to convince your team that they have the ability to score a tEN every time. Use our Business PowerPoint Templates because your ideas too are pinpointedly focused on you goals.Use these PowerPoint slides for presentations relating to achieve, achievement, action, business, chinese, company, concept, conceptual, corporate, definition, idea, macro, market, nature, organization, paintbrush, plan, profit, research, results, sand, shape, single, success, successful, symbol, text, translation, treasure, vision, word. The prominent colors used in the PowerPoint template are Blue light, Gray, Black. People tell us our actions to achieve result 6 stages steps writing business plan PowerPoint templates will impress their bosses and teams. Use our action PowerPoint templates and PPT Slides are Detailed. Use our actions to achieve result 6 stages steps writing business plan PowerPoint templates are Perfect. PowerPoint presentation experts tell us our corporate PowerPoint templates and PPT Slides are topically designed to provide an attractive backdrop to any subject. People tell us our actions to achieve result 6 stages steps writing business plan PowerPoint templates provide great value for your money. Be assured of finding the best projection to highlight your words. Customers tell us our conceptual PowerPoint templates and PPT Slides are Wonderful.

Business Framework The Internal Diversification Process PowerPoint Presentation
This slide exhibits framework for internal diversification process. This diagram contains four steps of diversification process. These steps are diversification decision, search and idea generation, selection review and development, institutionalization. Use this professional and customized business diagram in your PowerPoint presentations.
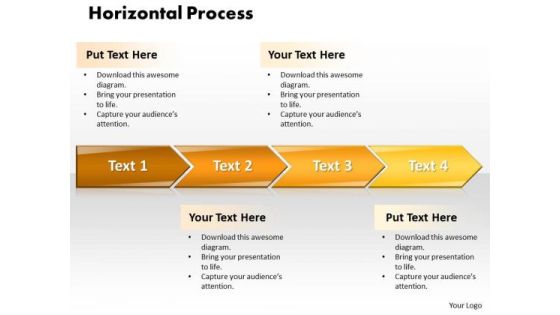
Ppt Horizontal Style 4 Power Point Stage 1 PowerPoint Templates
PPT horizontal style 4 power point stage 1 PowerPoint Templates-This chart is an effective way of displaying information you can edit text, color, shade and style as per you need.-PPT horizontal style 4 power point stage 1 PowerPoint Templates-Banner, Arrows, Business, Button, Chrome, Collection, Control, Design, Direction, Element, Empty, Financial, Flow, Graph, Green, Header, Horizontal, Illustration, Image, Information, Process, Red, Retail, Round, Sale, Set, Shapes

Ppt Direct Implementation Of Banking Process Using 6 Steps PowerPoint Templates
PPT direct implementation of banking process using 6 steps PowerPoint Templates-This template with an image of text boxes helps you chart the course of your presentation. This template allows you to effectively highlight the key issues concerning the growth of your business.-PPT direct implementation of banking process using 6 steps PowerPoint Templates-Accent, Advertisement, Arrow, Badge, Banner, Blank, Business, Collection, Decoration, Design, Direction, Element, Empty, Financial, Flow, Graph, Horizontal, Instruction, Isolated, Label, Manual, Menu, Message, Placard, Process, Promo, Promotion, Sale, Set, Shape
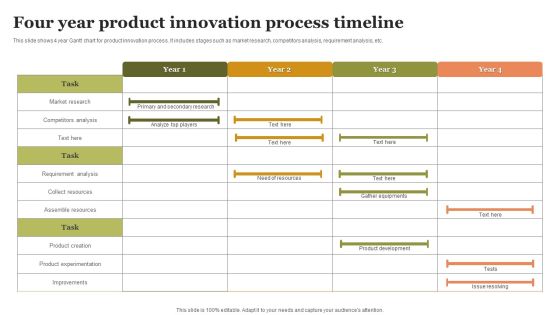
Four Year Product Innovation Process Timeline Slides PDF
This slide shows 4 year Gantt chart for product innovation process. It includes stages such as market research, competitors analysis, requirement analysis, etc. Showcasing this set of slides titled Four Year Product Innovation Process Timeline Slides PDF. The topics addressed in these templates are Requirement Analysis, Assemble Resources, Collect Resources. All the content presented in this PPT design is completely editable. Download it and make adjustments in color, background, font etc. as per your unique business setting.

Streamlining Manufacturing Processes With Workflow Automation Procurement And Supply Chain Workflow Optimization Model Template PDF
This slide showcase the workflow optimization model via automation for procurement process. It include steps such as purchase, requisition form, purchase order approval, delivery, invoice generation, payment method ,etc. Explore a selection of the finest Streamlining Manufacturing Processes With Workflow Automation Procurement And Supply Chain Workflow Optimization Model Template PDFhere. With a plethora of professionally designed and pre-made slide templates, you can quickly and easily find the right one for your upcoming presentation. You can use our Streamlining Manufacturing Processes With Workflow Automation Procurement And Supply Chain Workflow Optimization Model Template PDF to effectively convey your message to a wider audience. Slidegeeks has done a lot of research before preparing these presentation templates. The content can be personalized and the slides are highly editable. Grab templates today from Slidegeeks.

Talent Acquisition And Recruitment Methods Used By Hiring Department Ppt PowerPoint Presentation Layouts Templates PDF
This graph or chart is linked to excel, and changes automatically based on data. Just left click on it and select Edit Data. Showcasing this set of slides titled talent acquisition and recruitment methods used by hiring department ppt powerpoint presentation layouts templates pdf. The topics addressed in these templates are other methods, paid software, job fairs, employee referrals, jobs boards, social networks. All the content presented in this PPT design is completely editable. Download it and make adjustments in color, background, font etc. as per your unique business setting.
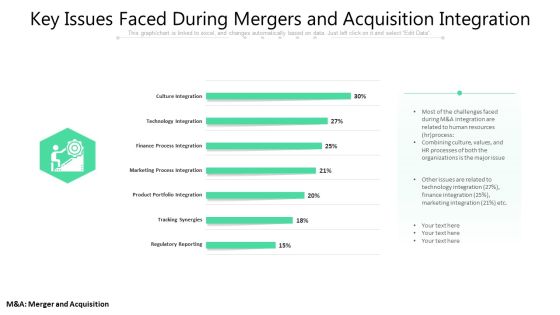
Key Issues Faced During Mergers And Acquisition Integration Ppt PowerPoint Presentation Summary Graphics PDF
This graph or chart is linked to excel, and changes automatically based on data. Just left click on it and select Edit Data. Showcasing this set of slides titled key issues faced during mergers and acquisition integration ppt powerpoint presentation summary graphics pdf. The topics addressed in these templates are culture integration, technology integration, finance process integration, marketing process integration, product portfolio integration, tracking synergies, regulatory reporting. All the content presented in this PPT design is completely editable. Download it and make adjustments in color, background, font etc. as per your unique business setting.
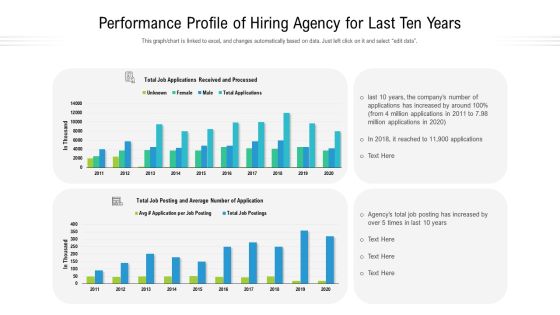
Performance Profile Of Hiring Agency For Last Ten Years Ppt Show Styles PDF
This graph to chart is linked to excel, and changes automatically based on data. Just left click on it and select edit data. Showcasing this set of slides titled performance profile of hiring agency for last ten years ppt show styles pdf. The topics addressed in these templates are performance profile of hiring agency for last ten years. All the content presented in this PPT design is completely editable. Download it and make adjustments in color, background, font etc. as per your unique business setting.
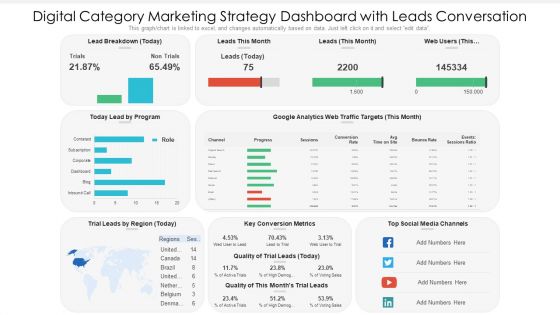
Digital Category Marketing Strategy Dashboard With Leads Conversation Ppt PowerPoint Presentation Slides Information PDF
This graph chart is linked to excel, and changes automatically based on data. Just left click on it and select edit data. Pitch your topic with ease and precision using this digital category marketing strategy dashboard with leads conversation ppt powerpoint presentation slides information pdf. This layout presents information on key conversion metrics, social media channels, lead by program. It is also available for immediate download and adjustment. So, changes can be made in the color, design, graphics or any other component to create a unique layout.
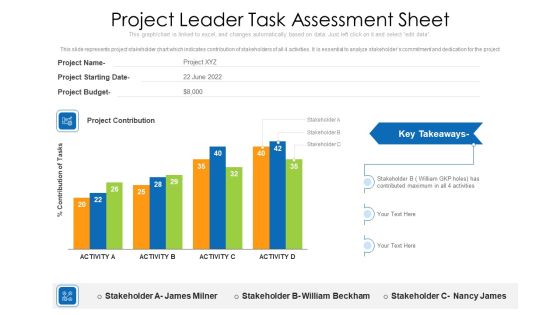
Project Leader Task Assessment Sheet Ppt PowerPoint Presentation Gallery Outline PDF
This slide represents project stakeholder chart which indicates contribution of stakeholders of all 4 activities. It is essential to analyze stakeholders commitment and dedication for the project. Pitch your topic with ease and precision using this project leader task assessment sheet ppt powerpoint presentation gallery outline pdf. This layout presents information on project leader task assessment sheet. It is also available for immediate download and adjustment. So, changes can be made in the color, design, graphics or any other component to create a unique layout.

Risk Analysis Strategies For Real Estate Construction Project Impact Assessment Of Risk Mitigation Download PDF
This slide illustrates graphs and charts for assessing the impact of risk mitigation initiatives taken to improve personal skills, boost motivation and enhance project deadline meeting capability. Deliver and pitch your topic in the best possible manner with this risk analysis strategies for real estate construction project impact assessment of risk mitigation download pdf. Use them to share invaluable insights on planning, designing, construction, commissioning and impress your audience. This template can be altered and modified as per your expectations. So, grab it now.

Company Departmental Task And Time Monitoring Report Clipart PDF
This slide shows a dashboard which includes a table with category, task description, due date, priority, status. It also includes pie charts of sales and marketing team showing task completed, in progress and overdue along with summary table and todays progress. Showcasing this set of slides titled company departmental task and time monitoring report clipart pdf. The topics addressed in these templates are system, sales, marketing. All the content presented in this PPT design is completely editable. Download it and make adjustments in color, background, font etc. as per your unique business setting.

Data Mining Report With Age And Occupation Details Background PDF
The following slide highlights the data profiling report with age and occupation illustrating data table and pie chart for age band, occupational type, and marital status Showcasing this set of slides titled data mining report with age and occupation details background pdf . The topics addressed in these templates are data mining report with age and occupation details . All the content presented in this PPT design is completely editable. Download it and make adjustments in color, background, font etc. as per your unique business setting.

Cyber Risk Security Market Growth With Current Trends Summary PDF
The following slide highlights the bar graph of cyber security market growth from 2017 to 2028 and pie chart of cyber security market share. Showcasing this set of slides titled cyber risk security market growth with current trends summary pdf. The topics addressed in these templates are cyber security market share, cyber security expected market growth, banking and finance. All the content presented in this PPT design is completely editable. Download it and make adjustments in color, background, font etc. as per your unique business setting.
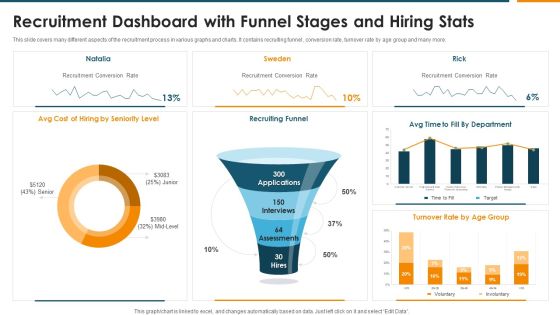
Recruitment Dashboard With Funnel Stages And Hiring Stats Rules PDF
This slide covers many different aspects of the recruitment process in various graphs and charts. It contains recruiting funnel , conversion rate, turnover rate by age group and many more. Pitch your topic with ease and precision using this Recruitment Dashboard With Funnel Stages And Hiring Stats Rules PDF. This layout presents information on Recruiting Funnel, Recruitment Conversion Rate, Seniority Level. It is also available for immediate download and adjustment. So, changes can be made in the color, design, graphics or any other component to create a unique layout.

Statistics Showing Organisation Advertising Cost Distribution To Create Brand Awareness Slides PDF
This slide signifies the pie chart on marketing cost distribution to optimize brand awareness. It includes methods like online advertising, print media, sales training and channel.Showcasing this set of slides titled Statistics Showing Organisation Advertising Cost Distribution To Create Brand Awareness Slides PDF The topics addressed in these templates are Creating Brand Awareness, Marketing Budget, Advertising Activities All the content presented in this PPT design is completely editable. Download it and make adjustments in color, background, font etc. as per your unique business setting.

Average Reduction In Injuries After Health And Safety Performance Measurements Check Template PDF
This slide covers the 7 year chart that is showing the number of injuries reduced during the timeframe by taking some measures or training employees on the usage of equipment they are using. Showcasing this set of slides titled Average Reduction In Injuries After Health And Safety Performance Measurements Check Template PDF The topics addressed in these templates are Employees Safety Measures, Workstation Ergonomics, Workplace Paying Attention All the content presented in this PPT design is completely editable. Download it and make adjustments in color, background, font etc. as per your unique business setting.
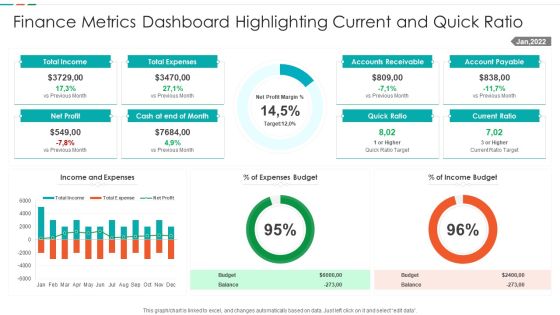
Finance Metrics Dashboard Highlighting Current And Quick Ratio Template PDF
This graph or chart is linked to excel, and changes automatically based on data. Just left click on it and select edit data. Showcasing this set of slides titled Finance Metrics Dashboard Highlighting Current And Quick Ratio Template PDF. The topics addressed in these templates are Total Income Budget, Total Expenses Balance, Net Profit Quick, Ratio Current Ratio. All the content presented in this PPT design is completely editable. Download it and make adjustments in color, background, font etc. as per your unique business setting.

Finance Metrics Dashboard Illustrating Income And Cash Flow Template PDF
This graph or chart is linked to excel, and changes automatically based on data. Just left click on it and select edit data. Pitch your topic with ease and precision using this Finance Metrics Dashboard Illustrating Income And Cash Flow Template PDF. This layout presents information on Current Accounts Receivable, Current Account Payable, Cash End Period, Account Receivable Account. It is also available for immediate download and adjustment. So, changes can be made in the color, design, graphics or any other component to create a unique layout.

Finance Metrics Dashboard Indicating Account Receivable And Account Payable Demonstration PDF
This graph or chart is linked to excel, and changes automatically based on data. Just left click on it and select edit data. Showcasing this set of slides titled Finance Metrics Dashboard Indicating Account Receivable And Account Payable Demonstration PDF. The topics addressed in these templates are Total Accounts Receivable, Total Accounts Payable, Recommended Payment Timeline, Monthly Cash Flow. All the content presented in this PPT design is completely editable. Download it and make adjustments in color, background, font etc. as per your unique business setting.
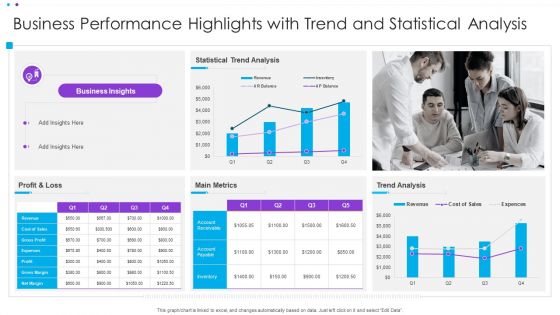
Business Performance Highlights With Trend And Statistical Analysis Ppt Infographic Template Display PDF
This graph or chart is linked to excel, and changes automatically based on data. Just left click on it and select Edit Data. Pitch your topic with ease and precision using this Business Performance Highlights With Trend And Statistical Analysis Ppt Infographic Template Display PDF. This layout presents information on Statistical Trend Analysis, Main Metrics, Profit And Loss. It is also available for immediate download and adjustment. So, changes can be made in the color, design, graphics or any other component to create a unique layout.

Client Helpline Dashboard At Valet Information Dsk Ppt Gallery Slide Portrait PDF
This graph or chart is linked to excel, and changes automatically based on data. Just left click on it and select Edit Data. Pitch your topic with ease and precision using this Client Helpline Dashboard At Valet Information Dsk Ppt Gallery Slide Portrait PDF. This layout presents information on Valet Damage Claims, Valet Wait Times, Information Desk. It is also available for immediate download and adjustment. So, changes can be made in the color, design, graphics or any other component to create a unique layout.

Client Helpline Dashboard With Retention Rate Ppt Gallery Ideas PDF
This graph or chart is linked to excel, and changes automatically based on data. Just left click on it and select Edit Data. Pitch your topic with ease and precision using this Client Helpline Dashboard With Retention Rate Ppt Gallery Ideas PDF. This layout presents information on Cost per Support 2022, Total Requests, Total Revenue 2022, Avg Requests Answered. It is also available for immediate download and adjustment. So, changes can be made in the color, design, graphics or any other component to create a unique layout.

Firm KPI Dashboard With Average Click Through Rate Ppt Inspiration Sample PDF
This graph or chart is linked to excel, and changes automatically based on data. Just left click on it and select Edit Data. Pitch your topic with ease and precision using this Firm KPI Dashboard With Average Click Through Rate Ppt Inspiration Sample PDF. This layout presents information on Total Clicks, Total Impressive, Average CTR, Average Position. It is also available for immediate download and adjustment. So, changes can be made in the color, design, graphics or any other component to create a unique layout.

Firm KPI Dashboard With Schedule Performance Index Ppt Visual Aids PDF
This graph or chart is linked to excel, and changes automatically based on data. Just left click on it and select Edit Data. Pitch your topic with ease and precision using this Firm KPI Dashboard With Schedule Performance Index Ppt Visual Aids PDF. This layout presents information on Project Cost Performance, Project Planning Stage, Monitor And Control. It is also available for immediate download and adjustment. So, changes can be made in the color, design, graphics or any other component to create a unique layout.

Firm Marketing Dashboard Report With Closed Sales Ppt Slides Graphics Example PDF
This graph or chart is linked to excel, and changes automatically based on data. Just left click on it and select Edit Data. Showcasing this set of slides titled Firm Marketing Dashboard Report With Closed Sales Ppt Slides Graphics Example PDF. The topics addressed in these templates are Days On Market, Homes For Sale, Median Sales Price, Closed Sales. All the content presented in this PPT design is completely editable. Download it and make adjustments in color, background, font etc. as per your unique business setting.

Quarterly Declining Graph Of A Manufacturing Plant Ppt PowerPoint Presentation File Example Topics PDF
This chart shows how the production of the manufacturing plan is declining in every quarter because of some critical reasons and how it is effecting the companys growth and goodwill. Showcasing this set of slides titled Quarterly Declining Graph Of A Manufacturing Plant Ppt PowerPoint Presentation File Example Topics PDF. The topics addressed in these templates are Production Declined, Lack Of Technology, Unskilled Laborers. All the content presented in this PPT design is completely editable. Download it and make adjustments in color, background, font etc. as per your unique business setting.

Stakeholder Evaluation Plan Dashboard With Acceptance Level Of New Reforms Background PDF
This slide illustrates statistical analysis of key stakeholders of the corporation. It includes pie chart of key stakeholders and bar graph of their level of acceptance of new reforms. Showcasing this set of slides titled Stakeholder Evaluation Plan Dashboard With Acceptance Level Of New Reforms Background PDF. The topics addressed in these templates are Level Acceptance, Key Stakeholders, Critical Stakeholder. All the content presented in this PPT design is completely editable. Download it and make adjustments in color, background, font etc. as per your unique business setting.

Service Level Agreement KPI Dashboard With Current Risk Statistics Topics PDF
This graph or chart is linked to excel, and changes automatically based on data. Just left click on it and select Edit Data. Pitch your topic with ease and precision using this Service Level Agreement KPI Dashboard With Current Risk Statistics Topics PDF. This layout presents information on Current Risk SLAS, Current Breached Slas, Personal Active SLA It is also available for immediate download and adjustment. So, changes can be made in the color, design, graphics or any other component to create a unique layout.

Project Dashboard To Track Success Metrics Background PDF
This slide focuses on project management dashboard which covers summary of project, resources and tasks, tasks that are in progress, costs and budget that shows the over costed, late, on time and early tasks, resources rate using pie chart, earned value, etc. Pitch your topic with ease and precision using this Project Dashboard To Track Success Metrics Background PDF. This layout presents information on Cost And Budget, Project Summary, Resource Allocation. It is also available for immediate download and adjustment. So, changes can be made in the color, design, graphics or any other component to create a unique layout.
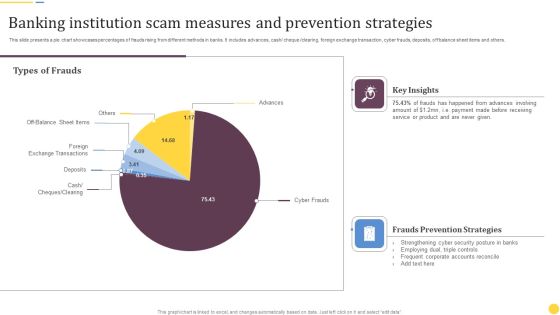
Banking Institution Scam Measures And Prevention Strategies Information PDF
This slide presents a pie chart showcases percentages of frauds rising from different methods in banks. It includes advances, cash or cheque or clearing, foreign exchange transaction, cyber frauds, deposits, off balance sheet items and others. Showcasing this set of slides titled Banking Institution Scam Measures And Prevention Strategies Information PDF. The topics addressed in these templates are Key Insights, Frauds Prevention Strategies, Types Of Frauds. All the content presented in this PPT design is completely editable. Download it and make adjustments in color, background, font etc. as per your unique business setting.

Budget Vs Actual Cost Comparison Dashboard Ppt PowerPoint Presentation Professional Format Ideas PDF
This slide illustrates fact and figures relating to various project budgets of a company. It includes monthly budget graph, project budget meter and budget vs. Actual costs chart.Pitch your topic with ease and precision using this Budget Vs Actual Cost Comparison Dashboard Ppt PowerPoint Presentation Professional Format Ideas PDF. This layout presents information on Milestones, Budget Graph, Manager. It is also available for immediate download and adjustment. So, changes can be made in the color, design, graphics or any other component to create a unique layout.
New Staff Onboarding Process KPI Tracking Dashboard Inspiration PDF
This slide showcase the KPI dashboard for tracking new hire onboarding completion progress. It includes KPIs such as onboarding completion status, employees per office, progress chart, hires starting in current and next week. Showcasing this set of slides titled New Staff Onboarding Process KPI Tracking Dashboard Inspiration PDF. The topics addressed in these templates are New Staff Onboarding Process, KPI Tracking Dashboard. All the content presented in this PPT design is completely editable. Download it and make adjustments in color, background, font etc. as per your unique business setting.
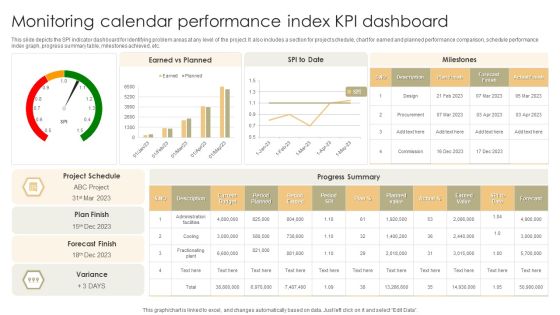
Monitoring Calendar Performance Index KPI Dashboard Slides PDF
This slide depicts the SPI indicator dashboard for identifying problem areas at any level of the project. It also includes a section for project schedule, chart for earned and planned performance comparison, schedule performance index graph, progress summary table, milestones achieved, etc. Pitch your topic with ease and precision using this Monitoring Calendar Performance Index KPI Dashboard Slides PDF. This layout presents information on Current Budget, Planned Value, Earned Value. It is also available for immediate download and adjustment. So, changes can be made in the color, design, graphics or any other component to create a unique layout.
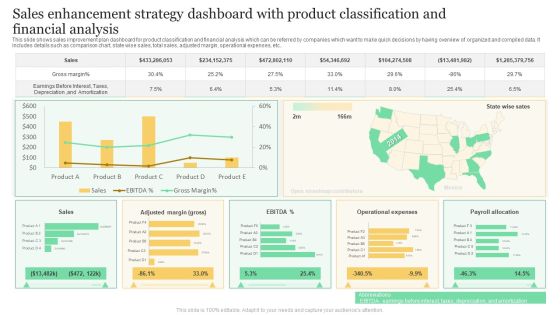
Sales Enhancement Strategy Dashboard With Product Classification And Financial Analysis Formats PDF
This slide shows sales improvement plan dashboard for product classification and financial analysis which can be referred by companies which want to make quick decisions by having overview of organized and compiled data. It includes details such as comparison chart, state wise sales, total sales, adjusted margin, operational expenses, etc. Showcasing this set of slides titled Sales Enhancement Strategy Dashboard With Product Classification And Financial Analysis Formats PDF. The topics addressed in these templates are Gross Margin, Sales, Operational Expenses. All the content presented in this PPT design is completely editable. Download it and make adjustments in color, background, font etc. as per your unique business setting.

Domestic Family Budget Plan Expense Categories Ppt PowerPoint Presentation Styles Graphics Example PDF
The slide shows a pie chart showing various categories of spending in family domestic to understand and improve money spending habits. It includes house rent, food, transportation, clothing, medical, insurance, education, credit or card, savings, entertainment and charity.Showcasing this set of slides titled Domestic Family Budget Plan Expense Categories Ppt PowerPoint Presentation Styles Graphics Example PDF. The topics addressed in these templates are Least Spending, Earnings Spend, Key Insights. All the content presented in this PPT design is completely editable. Download it and make adjustments in color, background, font etc. as per your unique business setting.

Company Financial Performance Indicators Dashboard With Liquidity And Turnover Ratios Formats PDF
This graph or chart is linked to excel, and changes automatically based on data. Just left click on it and select Edit Data. Pitch your topic with ease and precision using this Company Financial Performance Indicators Dashboard With Liquidity And Turnover Ratios Formats PDF. This layout presents information on Cash Balance, Days Inventory Outstanding, Days Payable Outstanding. It is also available for immediate download and adjustment. So, changes can be made in the color, design, graphics or any other component to create a unique layout.

Power Plant Energy Production Dashboard For Consumption Statistics Download PDF
This graph or chart is linked to excel, and changes automatically based on data. Just left click on it and select edit data. Pitch your topic with ease and precision using this Multiple Country Energy Consumption Statistics Comparison Dashboard Formats PDF. This layout presents information on August Year 2022, Return on Investments, Power Plan Detail . It is also available for immediate download and adjustment. So, changes can be made in the color, design, graphics or any other component to create a unique layout.
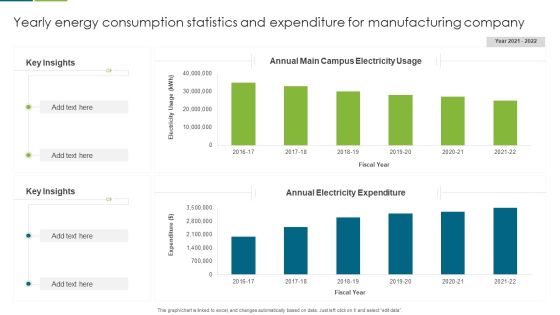
Yearly Energy Consumption Statistics And Expenditure For Manufacturing Company Guidelines PDF
This graph or chart is linked to excel, and changes automatically based on data. Just left click on it and select edit data. Pitch your topic with ease and precision using this Yearly Energy Consumption Statistics And Expenditure For Manufacturing Company Guidelines PDF. This layout presents information on Key Insights, Annual Electricity Expenditure, Annual Main Campus, Electricity Usage. It is also available for immediate download and adjustment. So, changes can be made in the color, design, graphics or any other component to create a unique layout.
