AI PPT Maker
Templates
PPT Bundles
Design Services
Business PPTs
Business Plan
Management
Strategy
Introduction PPT
Roadmap
Self Introduction
Timelines
Process
Marketing
Agenda
Technology
Medical
Startup Business Plan
Cyber Security
Dashboards
SWOT
Proposals
Education
Pitch Deck
Digital Marketing
KPIs
Project Management
Product Management
Artificial Intelligence
Target Market
Communication
Supply Chain
Google Slides
Research Services
 One Pagers
All Categories
-
Home
- Customer Favorites
- Energy Dashboard
Energy Dashboard

Ppt 7 Power Point Stage Social Backgrounds Linear Process PowerPoint Templates
PPT 7 power point stage social backgrounds linear process PowerPoint Templates-Create visually stimulating Microsoft office PPT Presentations with our above Diagram. It shows seven different layers placed in horizontal manner. It shows the successive concepts used in a procedure. This diagram will fit for Business Presentations. An excellent graphic to attract the attention of your audience to improve earnings.-PPT 7 power point stage social backgrounds linear process PowerPoint Templates-achievement, adding, analyzing, arrow, art, background, blank, business, chart, colorful, cycle, data, design, diagram, element, flow, graph, graphic, gray, icon, linear, magenta, management, market, numbers, orange, percent, process, project, round, stock, success, up, value

Business Diagram Business People Over Bar Chart PowerPoint Template
This Power Point template has been designed with graphic of business people and bar chart. This PPT contains the concept of result analysis and business data display. Use this PPT slide for your business and marketing related presentations.
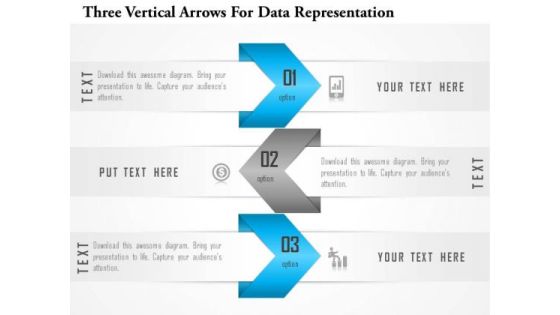
Business Diagram Three Vertical Arrows For Data Representation Presentation Template
This Power Point template slide has been designed with graphic of three vertical arrows. This PPT slide contains the concept of data representation. Use this PPt slide and build innovative presentation for your viewers.

Five Staged Funnel Diagram For Sales Data PowerPoint Template
Five staged funnel diagram has been used to design this power point template. This diagram template contains the concept of sales data representation. Use this PPT for your business and sales related presentations.

Business Diagram Colorful Box For Data Representation Presentation Template
Graphic of colorful boxes has been used to craft this power point template. This PPT diagram contains the concept of data representation. Use this PPT for business and management related presentations.

Telehealth Brief History From Telematics To Tele Health Sample PDF
The Telehealth Brief History From Telematics To Tele Health Sample PDF is a compilation of the most recent design trends as a series of slides. It is suitable for any subject or industry presentation, containing attractive visuals and photo spots for businesses to clearly express their messages. This template contains a variety of slides for the user to input data, such as structures to contrast two elements, bullet points, and slides for written information. Slidegeeks is prepared to create an impression.

Strategic Manpower Management Training Need Analysis Ppt Professional Example File PDF
Presenting this set of slides with name strategic manpower management training need analysis ppt professional example file pdf. This is a one stage process. The stages in this process are identifying gaps in data sources, selecting methods for data collection, analyzing quantitative data, identifying evidence based pubic health interventions. This is a completely editable PowerPoint presentation and is available for immediate download. Download now and impress your audience.

Data Analytics Change Management Gantt Chart Transformation Toolkit Competitive Intelligence Rules PDF
The slide shows the timeline for assessing and implementing the change in data analytics project. Are you in need of a template that can accommodate all of your creative concepts This one is crafted professionally and can be altered to fit any style. Use it with Google Slides or PowerPoint. Include striking photographs, symbols, depictions, and other visuals. Fill, move around, or remove text boxes as desired. Test out color palettes and font mixtures. Edit and save your work, or work with colleagues. Download Data Analytics Change Management Gantt Chart Transformation Toolkit Competitive Intelligence Rules PDF and observe how to make your presentation outstanding. Give an impeccable presentation to your group and make your presentation unforgettable.
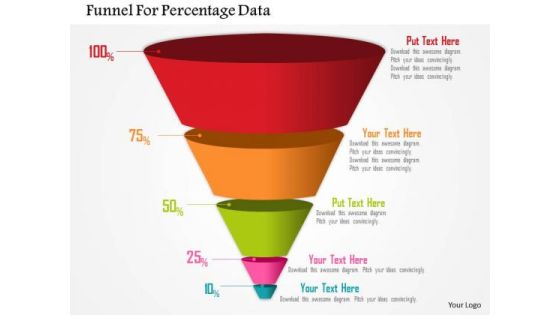
Business Diagram Funnel For Percentage Data Presentation Template
Four staged funnel diagram has been used to design this power point template. This diagram contains the concept of filtration. Present your views and ideas with this impressive image.

Human Resource Analytics Data Warehouse And Olap Cubes Business Intelligence Professional PDF
This slide represents the data warehouse and OLAP cubes architecture of business intelligence. It includes key recommendations such as used by companies of all sizes etc. Are you in need of a template that can accommodate all of your creative concepts This one is crafted professionally and can be altered to fit any style. Use it with Google Slides or PowerPoint. Include striking photographs, symbols, depictions, and other visuals. Fill, move around, or remove text boxes as desired. Test out color palettes and font mixtures. Edit and save your work, or work with colleagues. Download Human Resource Analytics Data Warehouse And Olap Cubes Business Intelligence Professional PDF and observe how to make your presentation outstanding. Give an impeccable presentation to your group and make your presentation unforgettable.

5 Kpis Of Managing Business Relations Elements PDF
This slide provides information about 5 key performance indicators KPIs of business relationship management which is customer satisfaction, percentage of questionnaire returned, number of complaints, etc. These KPIs will help businesses in improvement of their as well as employee performance. Presenting 5 kpis of managing business relations elements pdf to dispense important information. This template comprises five stages. It also presents valuable insights into the topics including customer satisfaction, determined surveys. This is a completely customizable PowerPoint theme that can be put to use immediately. So, download it and address the topic impactfully.
Four Circles Venn Diagram With Icons Powerpoint Slides
Four circles Venn diagram has been used to design this power point template. This PPT helps to portray the concept of business data analysis. Use this PPT for your business and marketing related presentations.
Two Circles Venn Diagram With Icons Powerpoint Slides
Venn diagram of two circles has been used to design this power point template. This PPT helps to portray the concept of business data analysis. Use this PPT for your business and marketing related presentations.
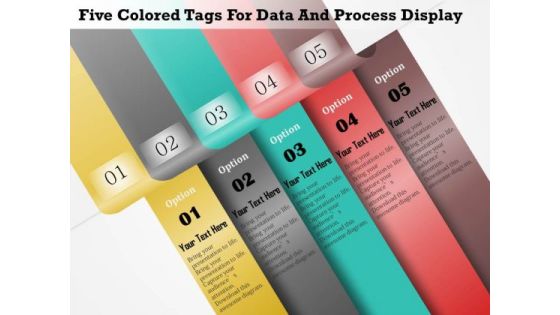
Five Colored Tags For Data And Process Display Presentation Template
Five staged colored tags style text boxes are used to design this Power Point template. This template contains the concept of data or process flow representation. Use this PPT for any business and marketing related presentations.

Four Staged Vertical Text Boxes For Data Display Presentation Template
Four staged vertical text boxes diagram has been used to design this power point template. This PPT contains the concept of data representation. Use this PPT and build presentation for business and marketing related topics.

Data Interpretation And Analysis Playbook Ppt PowerPoint Presentation Complete Deck With Slides
This complete deck acts as a great communication tool. It helps you in conveying your business message with personalized sets of graphics, icons etc. Comprising a set of thirty nine slides, this complete deck can help you persuade your audience. It also induces strategic thinking as it has been thoroughly researched and put together by our experts. Not only is it easily downloadable but also editable. The color, graphics, theme any component can be altered to fit your individual needs. So grab it now.
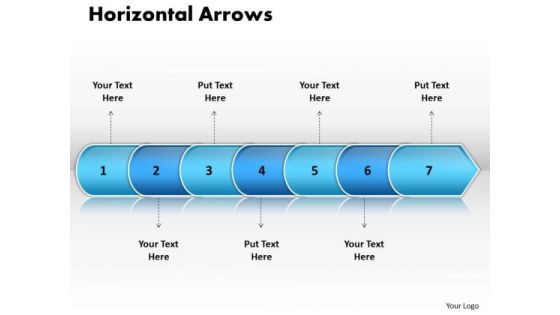
Ppt Linear Arrow 7 Power Point Stage PowerPoint Templates
PPT linear arrow 7 power point stage PowerPoint Templates-This Linear arrow data flow diagram conveys information about the events in the process clearly and efficiently-PPT linear arrow 7 power point stage PowerPoint Templates-Arrow, Background, Collection, Completed, Concept, Confirmation, Design, Flow, Graph, Graphic, Illustration, Indication, Indicator, Information, Instruction, Interface, Internet, Layout, Measurement, Order, Phase, Pointer, Process, Progress, Reflection, Scale, Shape, Sign
Business Diagram Three Horizontal Data Columns For Business Presentation Template
Three staged gear diagram has been used to craft this power point template. This PPT contains the concept of business process control. Use this PPT diagram for business and marketing related presentations.
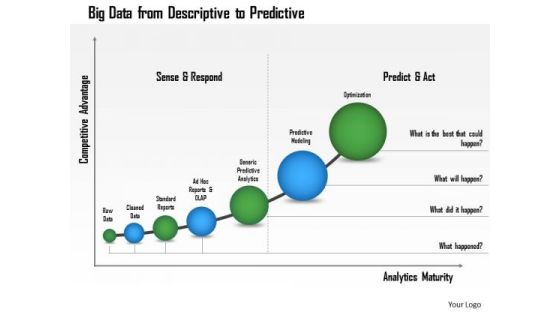
Business Framework Big Data From Descriptive To Predictive PowerPoint Presentation
Two funnel diagrams with text boxes are used to design this Power point template slide. This PPT slide contains the concept of AIDA marketing. Use this PPT for marketing and business presentations.
Business Framework Matrix PowerPoint Presentation
This business framework power point template has been designed with graphic of matrix. This two variable matrix can be used for data manipulation and analysis. Use this template to show business data analysis and create an impact on viewers.

Visual Health Plan Trends Analytics Ppt PowerPoint Presentation Inspiration Slideshow Cpb Pdf
Presenting this set of slides with name visual health plan trends analytics ppt powerpoint presentation inspiration slideshow cpb pdf. This is an editable Powerpoint six stages graphic that deals with topics like visual health plan trends analytics to help convey your message better graphically. This product is a premium product available for immediate download and is 100 percent editable in Powerpoint. Download this now and use it in your presentations to impress your audience.

Business Intelligence And Big Project Mini Charter For Data Analytics Download PDF
In this slide, we are providing vital information needed to get the project started. It includes information about project goals, deliverables, business case, participants and key milestones etc. Deliver an awe inspiring pitch with this creative business intelligence and big project mini charter for data analytics download pdf bundle. Topics like business case, team members, risks and constraints, milestones can be discussed with this completely editable template. It is available for immediate download depending on the needs and requirements of the user.
Pharmaceutical Management Healthcare Marketing Trends Ppt Icon Design Templates PDF
Deliver and pitch your topic in the best possible manner with this pharmaceutical management healthcare marketing trends ppt icon design templates pdf. Use them to share invaluable insights on patient generation, local power, social power, seo, ppc, content, chat, review power, website and impress your audience. This template can be altered and modified as per your expectations. So, grab it now.
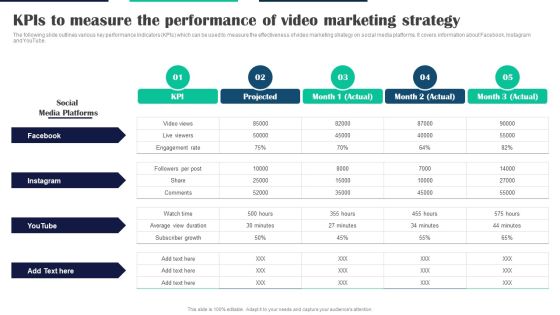
Executing Video Promotional Kpis To Measure The Performance Of Video Marketing Strategy Inspiration PDF
The following slide outlines various key performance indicators KPIs which can be used to measure the effectiveness of video marketing strategy on social media platforms. It covers information about Facebook, Instagram and YouTube. This modern and well-arranged Executing Video Promotional Kpis To Measure The Performance Of Video Marketing Strategy Inspiration PDF provides lots of creative possibilities. It is very simple to customize and edit with the Powerpoint Software. Just drag and drop your pictures into the shapes. All facets of this template can be edited with Powerpoint, no extra software is necessary. Add your own material, put your images in the places assigned for them, adjust the colors, and then you can show your slides to the world, with an animated slide included.
Icons Slide For Ml And Big Data In Information Technology Processes Rules PDF
Introducing our well designed Icons Slide For Ml And Big Data In Information Technology Processes Rules PDF set of slides. The slide displays editable icons to enhance your visual presentation. The icons can be edited easily. So customize according to your business to achieve a creative edge. Download and share it with your audience.
Icons Slide For Gathering And Assessing Consumer Data For Customized Promotion Technique Information PDF
Introducing our well designed Icons Slide For Gathering And Assessing Consumer Data For Customized Promotion Technique Information PDF set of slides. The slide displays editable icons to enhance your visual presentation. The icons can be edited easily. So customize according to your business to achieve a creative edge. Download and share it with your audience.

Creating Customer Personas For Customizing Sources To Obtain Buyers Persona Data Portrait PDF
The following slide highlights various sources to collect data for developing customer persona and gain understanding of audience. It showcases key components such as surveys and interviews, website analytics, social media, customer relationship management system and market research. Are you in need of a template that can accommodate all of your creative concepts This one is crafted professionally and can be altered to fit any style. Use it with Google Slides or PowerPoint. Include striking photographs, symbols, depictions, and other visuals. Fill, move around, or remove text boxes as desired. Test out color palettes and font mixtures. Edit and save your work, or work with colleagues. Download Creating Customer Personas For Customizing Sources To Obtain Buyers Persona Data Portrait PDF and observe how to make your presentation outstanding. Give an impeccable presentation to your group and make your presentation unforgettable.

Nestle Performance Management Report Bar Chart Ppt Inspiration Shapes PDF
This graph or chart is linked to excel, and changes automatically based on data. Just left click on it and select Edit Data. Whether you have daily or monthly meetings, a brilliant presentation is necessary. Nestle Performance Management Report Bar Chart Ppt Inspiration Shapes PDF can be your best option for delivering a presentation. Represent everything in detail using Nestle Performance Management Report Bar Chart Ppt Inspiration Shapes PDF and make yourself stand out in meetings. The template is versatile and follows a structure that will cater to your requirements. All the templates prepared by Slidegeeks are easy to download and edit. Our research experts have taken care of the corporate themes as well. So, give it a try and see the results.

Set Kpis To Evaluate Current And Previous Performance Ppt Model Deck PDF
The following slide covers various key performance indicators to measure and compare results of marketing efforts. It includes elements such as brand loyalty, engagement, net promotor score, return on investment, equity etc. Whether you have daily or monthly meetings, a brilliant presentation is necessary. Set Kpis To Evaluate Current And Previous Performance Ppt Model Deck PDF can be your best option for delivering a presentation. Represent everything in detail using Set Kpis To Evaluate Current And Previous Performance Ppt Model Deck PDF and make yourself stand out in meetings. The template is versatile and follows a structure that will cater to your requirements. All the templates prepared by Slidegeeks are easy to download and edit. Our research experts have taken care of the corporate themes as well. So, give it a try and see the results.

Data Evaluation And Processing Toolkit Project Mini Charter For Data Analytics Structure PDF
In this slide, we are providing vital information needed to get the project started. It includes information about project goals, deliverables, business case, participants and key milestones etc. Slidegeeks is here to make your presentations a breeze with Data Evaluation And Processing Toolkit Project Mini Charter For Data Analytics Structure PDF With our easy-to-use and customizable templates, you can focus on delivering your ideas rather than worrying about formatting. With a variety of designs to choose from, youre sure to find one that suits your needs. And with animations and unique photos, illustrations, and fonts, you can make your presentation pop. So whether youre giving a sales pitch or presenting to the board, make sure to check out Slidegeeks first.

Comprehensive Guide To Strengthen Brand Equity Brand Health Definition And Metrics To Track Formats PDF
Mentioned slide displays overview about brand health covering its definition along with key performance metrics such as net promoter score, customer satisfaction score and share of voice. Presenting this PowerPoint presentation, titled Comprehensive Guide To Strengthen Brand Equity Brand Health Definition And Metrics To Track Formats PDF, with topics curated by our researchers after extensive research. This editable presentation is available for immediate download and provides attractive features when used. Download now and captivate your audience. Presenting this Comprehensive Guide To Strengthen Brand Equity Brand Health Definition And Metrics To Track Formats PDF. Our researchers have carefully researched and created these slides with all aspects taken into consideration. This is a completely customizable Comprehensive Guide To Strengthen Brand Equity Brand Health Definition And Metrics To Track Formats PDF that is available for immediate downloading. Download now and make an impact on your audience. Highlight the attractive features available with our PPTs.

Comprehensive Guide To Build Marketing Success Metrics To Measure Influencer Marketing Sample PDF
The following slide showcases different key performance indicators KPIs through which digital marketers can evaluate influencer marketing campaign performance. The key performance indicators outlined in slide are audience reach, impressions, followers growth, click-through rate CTR, revenue, and conversion rate. This modern and well-arranged Comprehensive Guide To Build Marketing Success Metrics To Measure Influencer Marketing Sample PDF provides lots of creative possibilities. It is very simple to customize and edit with the Powerpoint Software. Just drag and drop your pictures into the shapes. All facets of this template can be edited with Powerpoint, no extra software is necessary. Add your own material, put your images in the places assigned for them, adjust the colors, and then you can show your slides to the world, with an animated slide included.

Toolkit For Data Science And Analytics Transition Key Essential Features Of Data Analytics Tools Elements PDF
The slide elaborates the key features of Data Analytics software which are required to improve business results. The features includes easy raw data processing, scalability, and technical support etc. Whether you have daily or monthly meetings, a brilliant presentation is necessary. Toolkit For Data Science And Analytics Transition Key Essential Features Of Data Analytics Tools Elements PDF can be your best option for delivering a presentation. Represent everything in detail using Toolkit For Data Science And Analytics Transition Key Essential Features Of Data Analytics Tools Elements PDF and make yourself stand out in meetings. The template is versatile and follows a structure that will cater to your requirements. All the templates prepared by Slidegeeks are easy to download and edit. Our research experts have taken care of the corporate themes as well. So, give it a try and see the results.
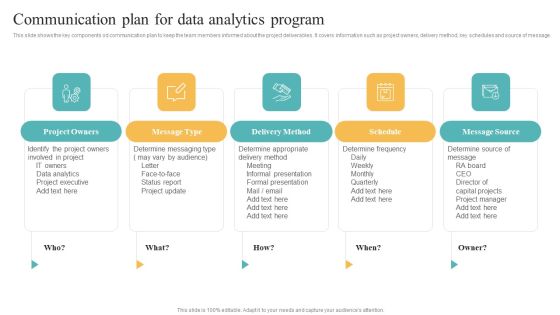
Transformation Toolkit Competitive Intelligence Information Analysis Communication Plan For Data Information PDF
This slide shows the key components od communication plan to keep the team members informed about the project deliverables. It covers information such as project owners, delivery method, key schedules and source of message. Whether you have daily or monthly meetings, a brilliant presentation is necessary. Transformation Toolkit Competitive Intelligence Information Analysis Communication Plan For Data Information PDF can be your best option for delivering a presentation. Represent everything in detail using Transformation Toolkit Competitive Intelligence Information Analysis Communication Plan For Data Information PDF and make yourself stand out in meetings. The template is versatile and follows a structure that will cater to your requirements. All the templates prepared by Slidegeeks are easy to download and edit. Our research experts have taken care of the corporate themes as well. So, give it a try and see the results.

Brand Health Definition And Metrics To Track Brand Value Estimation Guide Mockup PDF
Following slide provides an overview about brand equity by covering its definition and key components such as brand loyalty, awareness, quality, association and experience.Present like a pro with Brand Health Definition And Metrics To Track Brand Value Estimation Guide Mockup PDF Create beautiful presentations together with your team, using our easy-to-use presentation slides. Share your ideas in real-time and make changes on the fly by downloading our templates. So whether you are in the office, on the go, or in a remote location, you can stay in sync with your team and present your ideas with confidence. With Slidegeeks presentation got a whole lot easier. Grab these presentations today.

Business Financial Metrics Data Analysis Ppt PowerPoint Presentation Complete Deck With Slides
Improve your presentation delivery using this business financial metrics data analysis ppt powerpoint presentation complete deck with slides. Support your business vision and objectives using this well-structured PPT deck. This template offers a great starting point for delivering beautifully designed presentations on the topic of your choice. Comprising twenty nine this professionally designed template is all you need to host discussion and meetings with collaborators. Each slide is self-explanatory and equipped with high-quality graphics that can be adjusted to your needs. Therefore, you will face no difficulty in portraying your desired content using this PPT slideshow. This PowerPoint slideshow contains every important element that you need for a great pitch. It is not only editable but also available for immediate download and utilization. The color, font size, background, shapes everything can be modified to create your unique presentation layout. Therefore, download it now.

Brand Measurement Data Analysis Ppt PowerPoint Presentation Complete Deck With Slides
Improve your presentation delivery using this brand measurement data analysis ppt powerpoint presentation complete deck with slides. Support your business vision and objectives using this well-structured PPT deck. This template offers a great starting point for delivering beautifully designed presentations on the topic of your choice. Comprising fourteen this professionally designed template is all you need to host discussion and meetings with collaborators. Each slide is self-explanatory and equipped with high-quality graphics that can be adjusted to your needs. Therefore, you will face no difficulty in portraying your desired content using this PPT slideshow. This PowerPoint slideshow contains every important element that you need for a great pitch. It is not only editable but also available for immediate download and utilization. The color, font size, background, shapes everything can be modified to create your unique presentation layout. Therefore, download it now.
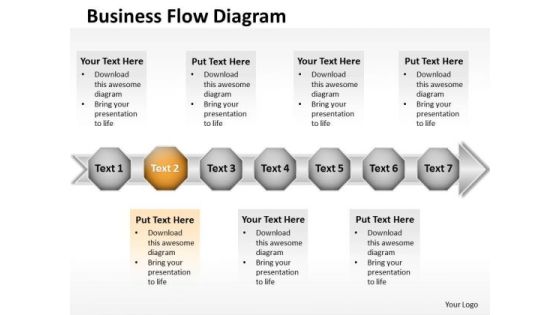
Ppt 7 Beeline Power Point Stage Business PowerPoint Theme Data Flow Diagram Templates
PPT 7 beeline power point stage business PowerPoint theme data flow diagram Templates-This PowerPoint Diagram shows Horizontal Demonstration through seven hexagonal boxes on the arrow pointing towards east direction signifying his completion of the process and leading towards success. This image has been conceived to enable you to emphatically communicate your ideas in your Business PPT presentations-PPT 7 beeline power point stage business PowerPoint theme data flow diagram Templates-arrow, art, assess, blue, business, chart, chevron, clip, clipart, colorful, compliance, corporate, design, development, diagram, flow, glossy, graphic, hierarchy, icon, illustration, implement, info graphic, levels, marketing, modern, plan, process, shape, shiny, square, stages, vector

Nestle Performance Management Report Pie Chart Ppt Ideas Graphics Example PDF
This graph or chart is linked to excel, and changes automatically based on data. Just left click on it and select Edit Data. Are you in need of a template that can accommodate all of your creative concepts This one is crafted professionally and can be altered to fit any style. Use it with Google Slides or PowerPoint. Include striking photographs, symbols, depictions, and other visuals. Fill, move around, or remove text boxes as desired. Test out color palettes and font mixtures. Edit and save your work, or work with colleagues. Download Nestle Performance Management Report Pie Chart Ppt Ideas Graphics Example PDF and observe how to make your presentation outstanding. Give an impeccable presentation to your group and make your presentation unforgettable.

Application Ppt Mobile Screens Data Analysis Ppt PowerPoint Presentation Complete Deck With Slides
If designing a presentation takes a lot of your time and resources and you are looking for a better alternative, then this application ppt mobile screens data analysis ppt powerpoint presentation complete deck with slides is the right fit for you. This is a prefabricated set that can help you deliver a great presentation on the topic. All the twelve slides included in this sample template can be used to present a birds-eye view of the topic. These slides are also fully editable, giving you enough freedom to add specific details to make this layout more suited to your business setting. Apart from the content, all other elements like color, design, theme are also replaceable and editable. This helps in designing a variety of presentations with a single layout. Not only this, you can use this PPT design in formats like PDF, PNG, and JPG once downloaded. Therefore, without any further ado, download and utilize this sample presentation as per your liking.

Customer Data Analysis Team Target Ppt PowerPoint Presentation Complete Deck With Slides
If designing a presentation takes a lot of your time and resources and you are looking for a better alternative, then this customer data analysis team target ppt powerpoint presentation complete deck with slides is the right fit for you. This is a prefabricated set that can help you deliver a great presentation on the topic. All the twelve slides included in this sample template can be used to present a birds-eye view of the topic. These slides are also fully editable, giving you enough freedom to add specific details to make this layout more suited to your business setting. Apart from the content, all other elements like color, design, theme are also replaceable and editable. This helps in designing a variety of presentations with a single layout. Not only this, you can use this PPT design in formats like PDF, PNG, and JPG once downloaded. Therefore, without any further ado, download and utilize this sample presentation as per your liking.

Trends In Digital Global Health Technology Applications By Disease State Pictures PDF
The following slide showcases digital trends in healthcare application market categorized by different disease states. It presents information related to wellness management, health condition, diet and nutrition, etc. Showcasing this set of slides titled Trends In Digital Global Health Technology Applications By Disease State Pictures PDF. The topics addressed in these templates are Healthcare Providers, Medication Information, Women Health. All the content presented in this PPT design is completely editable. Download it and make adjustments in color, background, font etc. as per your unique business setting.

5 Staged Process Of Data Cloud Platform Migration Inspiration PDF
This slide shows 5 staged process of data platform migration which contains discovering, analyzing, planning, implementing and verification. This can be referred by IT managers in streamlining their migration process for better performance of teams as well as organizations.Presenting 5 Staged Process Of Data Cloud Platform Migration Inspiration PDF to dispense important information. This template comprises five stages. It also presents valuable insights into the topics including Discovering, Analyzing, Planning. This is a completely customizable PowerPoint theme that can be put to use immediately. So, download it and address the topic impactfully
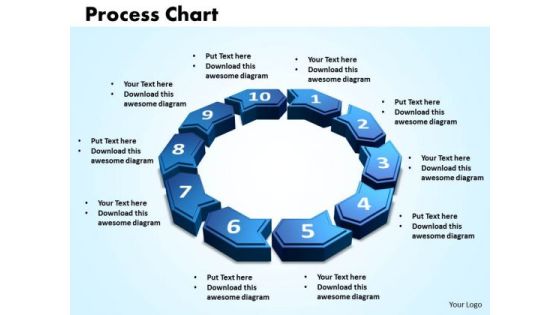
PowerPoint Slides Process Charts Success Ppt Presentation
PowerPoint Slides process charts Success PPT Presentation-More than one sector can be presented with this power point slides. This PPT presentation can be used to present the data of a complete year to the audience-Chart, circle, circular, circulation, concept, connection, continuity, correlate, course, cycle, cyclic, diagram, direction, duplicate, flow, four, iterate, manage, method, presentation, procedure, process, recycle, refresh, relate, repeat, repetition, report, review, ring, rotation, round, sequence, simple, stage, step, strategy, success, system, work flow-PowerPoint Slides process charts Success PPT Presentation
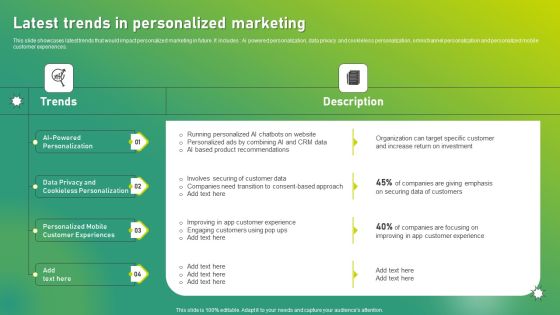
Targeted Marketing Strategic Plan For Audience Engagement Latest Trends In Personalized Marketing Mockup PDF
This slide showcases latest trends that would impact personalized marketing in future. It includes Ai powered personalization, data privacy and cookieless personalization, omnichannel personalization and personalized mobile customer experiences. From laying roadmaps to briefing everything in detail, our templates are perfect for you. You can set the stage with your presentation slides. All you have to do is download these easy to edit and customizable templates. Targeted Marketing Strategic Plan For Audience Engagement Latest Trends In Personalized Marketing Mockup PDF will help you deliver an outstanding performance that everyone would remember and praise you for. Do download this presentation today.

Return On Equity Indicators To Measure Company Financial Performance Mockup PDF
This slide showcases a graph of return on equity that represents how well the firm can manage the capital invested by shareholders. Pitch your topic with ease and precision using this Return On Equity Indicators To Measure Company Financial Performance Mockup PDF. This layout presents information on Return On Equity, Key Insights, Positive Return. It is also available for immediate download and adjustment. So, changes can be made in the color, design, graphics or any other component to create a unique layout.

Data Analysis Deployment Cost Ppt PowerPoint Presentation Complete Deck With Slides
This data analysis deployment cost ppt powerpoint presentation complete deck with slides acts as backup support for your ideas, vision, thoughts, etc. Use it to present a thorough understanding of the topic. This PPT slideshow can be utilized for both in-house and outside presentations depending upon your needs and business demands. Entailing twelve slides with a consistent design and theme, this template will make a solid use case. As it is intuitively designed, it suits every business vertical and industry. All you have to do is make a few tweaks in the content or any other component to design unique presentations. The biggest advantage of this complete deck is that it can be personalized multiple times once downloaded. The color, design, shapes, and other elements are free to modify to add personal touches. You can also insert your logo design in this PPT layout. Therefore a well-thought and crafted presentation can be delivered with ease and precision by downloading this data analysis deployment cost ppt powerpoint presentation complete deck with slides PPT slideshow.

Google Cloud Service Models Google Cloud Dataprep Adjustment In Data Exploration And Curation Slides PDF
This slide represents how cloud dataprep fits into the data discovery and curation cycle. The purpose of this slide is to demonstrate the cloud dataprep adjustment in data exploration and curation flow. The main components include access, structure, exploration, cleaning and blending, and analysis. Formulating a presentation can take up a lot of effort and time, so the content and message should always be the primary focus. The visuals of the PowerPoint can enhance the presenters message, so our Google Cloud Service Models Google Cloud Dataprep Adjustment In Data Exploration And Curation Slides PDF was created to help save time. Instead of worrying about the design, the presenter can concentrate on the message while our designers work on creating the ideal templates for whatever situation is needed. Slidegeeks has experts for everything from amazing designs to valuable content, we have put everything into Google Cloud Service Models Google Cloud Dataprep Adjustment In Data Exploration And Curation Slides PDF
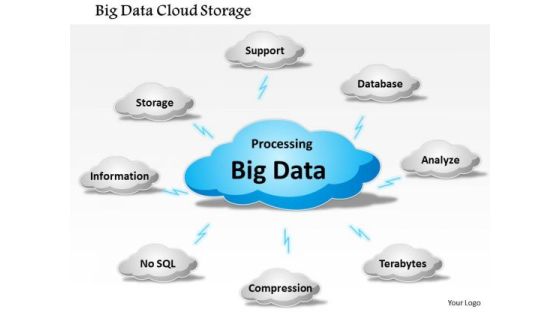
Business Framework Big Data Cloud Storage PowerPoint Presentation 1
Explain the concept of big data storage on cloud service with this power point diagram slide. This diagram contains the graphic of big cloud and connected sub clouds in network. Use this image for data storage and data networking related presentations.
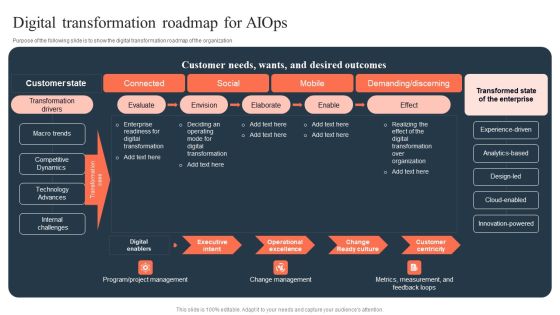
Ml And Big Data In Information Technology Processes Digital Transformation Roadmap For Aiops Graphics PDF
Purpose of the following slide is to show the digital transformation roadmap of the organization This modern and well arranged Ml And Big Data In Information Technology Processes Digital Transformation Roadmap For Aiops Graphics PDF provides lots of creative possibilities. It is very simple to customize and edit with the Powerpoint Software. Just drag and drop your pictures into the shapes. All facets of this template can be edited with Powerpoint no extra software is necessary. Add your own material, put your images in the places assigned for them, adjust the colors, and then you can show your slides to the world, with an animated slide included.
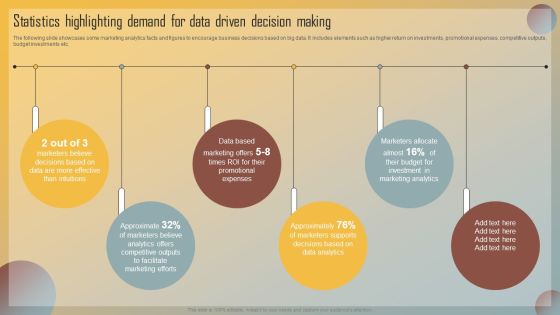
Guide For Marketing Analytics To Improve Decisions Statistics Highlighting Demand For Data Driven Decision Making Slides PDF
The following slide showcases some marketing analytics facts and figures to encourage business decisions based on big data. It includes elements such as higher return on investments, promotional expenses, competitive outputs, budget investments etc. This modern and well arranged Guide For Marketing Analytics To Improve Decisions Statistics Highlighting Demand For Data Driven Decision Making Slides PDF provides lots of creative possibilities. It is very simple to customize and edit with the Powerpoint Software. Just drag and drop your pictures into the shapes. All facets of this template can be edited with Powerpoint no extra software is necessary. Add your own material, put your images in the places assigned for them, adjust the colors, and then you can show your slides to the world, with an animated slide included.

Data Analytics Plan Ppt PowerPoint Presentation Complete With Slides
Boost your confidence and team morale with this well-structured Data Analytics Plan Ppt PowerPoint Presentation Complete With Slides. This prefabricated set gives a voice to your presentation because of its well-researched content and graphics. Our experts have added all the components very carefully, thus helping you deliver great presentations with a single click. Not only that, it contains a set of tweleve slides that are designed using the right visuals, graphics, etc. Various topics can be discussed, and effective brainstorming sessions can be conducted using the wide variety of slides added in this complete deck. Apart from this, our PPT design contains clear instructions to help you restructure your presentations and create multiple variations. The color, format, design anything can be modified as deemed fit by the user. Not only this, it is available for immediate download. So, grab it now.

New Brand Introduction Plan Marketing Channels With Kpis To Be Tracked Sample PDF
This template covers brand launch success tracking key performance indicators such as Engagement Likes, Comments, and Share, Followers growth, Story metrices Story Replies, Story Tap back and Forward, Story Impression etc.Are you in need of a template that can accommodate all of your creative concepts This one is crafted professionally and can be altered to fit any style. Use it with Google Slides or PowerPoint. Include striking photographs, symbols, depictions, and other visuals. Fill, move around, or remove text boxes as desired. Test out color palettes and font mixtures. Edit and save your work, or work with colleagues. Download New Brand Introduction Plan Marketing Channels With Kpis To Be Tracked Sample PDF and observe how to make your presentation outstanding. Give an impeccable presentation to your group and make your presentation unforgettable.

Healthcare Marketing Trends Ppt PowerPoint Presentation Portfolio Summary
Presenting this set of slides with name healthcare marketing trends ppt powerpoint presentation portfolio summary. The topics discussed in these slides are local power, social power, patient generation, management, marketing. This is a completely editable PowerPoint presentation and is available for immediate download. Download now and impress your audience.

Business Diagram Four Design For Concept Coding Presentation Template
Four colorful text boxes has been used to craft this power point template. This PPT diagram contains the concept of coding and data representation. Use this PPT for business and technology related presentations.
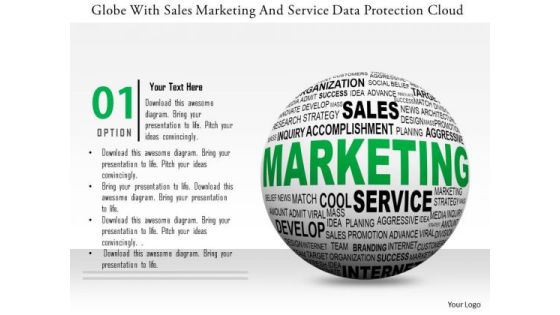
Stock Photo Globe With Sales Marketing And Service Data Protection Cloud PowerPoint Slide
This power point template has been designed with graphic of globe and cloud. This image template contains the concept of global sales and marketing service with cloud technology. Use this image template for global business related presentations.
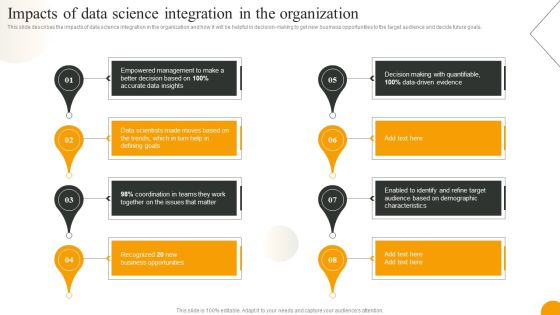
Using Data Science Technologies For Business Transformation Impacts Of Data Science Integration In The Organization Clipart PDF
This slide describes the impacts of data science integration in the organization and how it will be helpful in decision-making to get new business opportunities to the target audience and decide future goals. Whether you have daily or monthly meetings, a brilliant presentation is necessary. Using Data Science Technologies For Business Transformation Impacts Of Data Science Integration In The Organization Clipart PDF can be your best option for delivering a presentation. Represent everything in detail using Using Data Science Technologies For Business Transformation Impacts Of Data Science Integration In The Organization Clipart PDF and make yourself stand out in meetings. The template is versatile and follows a structure that will cater to your requirements. All the templates prepared by Slidegeeks are easy to download and edit. Our research experts have taken care of the corporate themes as well. So, give it a try and see the results.

Data Constraints Information Limitation Ppt PowerPoint Presentation Complete Deck With Slides
Improve your presentation delivery using this Data Constraints Information Limitation Ppt PowerPoint Presentation Complete Deck With Slides. Support your business vision and objectives using this well-structured PPT deck. This template offers a great starting point for delivering beautifully designed presentations on the topic of your choice. Comprising fourteen this professionally designed template is all you need to host discussion and meetings with collaborators. Each slide is self-explanatory and equipped with high-quality graphics that can be adjusted to your needs. Therefore, you will face no difficulty in portraying your desired content using this PPT slideshow. This PowerPoint slideshow contains every important element that you need for a great pitch. It is not only editable but also available for immediate download and utilization. The color, font size, background, shapes everything can be modified to create your unique presentation layout. Therefore, download it now.
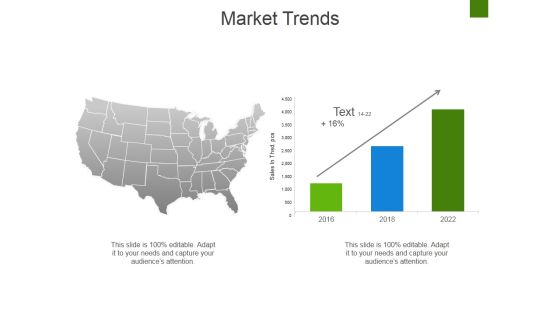
Market Trends Ppt PowerPoint Presentation Visual Aids Professional
This is a market trends ppt powerpoint presentation visual aids professional. This is a five stage process. The stages in this process are threat of new entrants, threat of substitutes, bargaining power of buyers, bargaining power of suppliers, degree of rivalry.
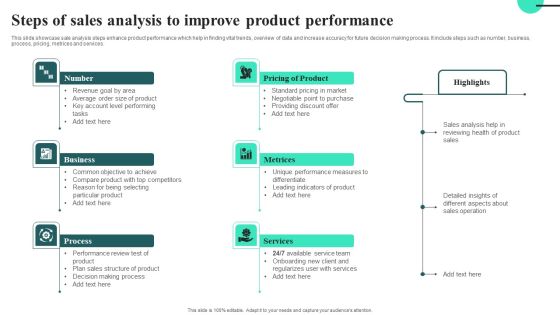
Steps Of Sales Analysis To Improve Product Performance Rules PDF
This slide showcase sale analysis steps enhance product performance which help in finding vital trends, overview of data and increase accuracy for future decision making process. It include steps such as number, business, process, pricing, metrices and services.Presenting Steps Of Sales Analysis To Improve Product Performance Rules PDF to dispense important information. This template comprises six stages. It also presents valuable insights into the topics including Number, Pricing Of Product. This is a completely customizable PowerPoint theme that can be put to use immediately. So, download it and address the topic impactfully.
