AI PPT Maker
Templates
PPT Bundles
Design Services
Business PPTs
Business Plan
Management
Strategy
Introduction PPT
Roadmap
Self Introduction
Timelines
Process
Marketing
Agenda
Technology
Medical
Startup Business Plan
Cyber Security
Dashboards
SWOT
Proposals
Education
Pitch Deck
Digital Marketing
KPIs
Project Management
Product Management
Artificial Intelligence
Target Market
Communication
Supply Chain
Google Slides
Research Services
 One Pagers
All Categories
-
Home
- Customer Favorites
- Employees Kpi
Employees Kpi
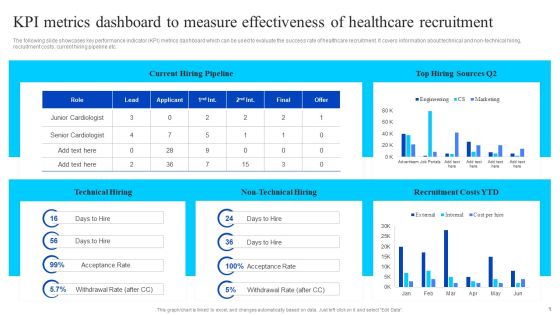
KPI Metrics Dashboard To Measure Effectiveness Of Healthcare Recruitment Microsoft PDF
The following slide showcases key performance indicator KPI metrics dashboard which can be used to evaluate the success rate of healthcare recruitment. It covers information about technical and non-technical hiring, recruitment costs, current hiring pipeline etc. Whether you have daily or monthly meetings, a brilliant presentation is necessary. KPI Metrics Dashboard To Measure Effectiveness Of Healthcare Recruitment Microsoft PDF can be your best option for delivering a presentation. Represent everything in detail using KPI Metrics Dashboard To Measure Effectiveness Of Healthcare Recruitment Microsoft PDF and make yourself stand out in meetings. The template is versatile and follows a structure that will cater to your requirements. All the templates prepared by Slidegeeks are easy to download and edit. Our research experts have taken care of the corporate themes as well. So, give it a try and see the results.

Comprehensive Sports Event Marketing Plan Sports Event Marketing KPI Dashboard Introduction PDF
This slide represents KPI dashboard to measure and monitor the performance of sports event marketing. It includes details related to KPIs such as revenue, attendance etc. in last 5 games. Do you have to make sure that everyone on your team knows about any specific topic I yes, then you should give Comprehensive Sports Event Marketing Plan Sports Event Marketing KPI Dashboard Introduction PDF a try. Our experts have put a lot of knowledge and effort into creating this impeccable Comprehensive Sports Event Marketing Plan Sports Event Marketing KPI Dashboard Introduction PDF. You can use this template for your upcoming presentations, as the slides are perfect to represent even the tiniest detail. You can download these templates from the Slidegeeks website and these are easy to edit. So grab these today

Successful Risk Administration KPI Dashboard To Track Effectiveness Of Real Estate Business Template PDF
The following slide exhibits key performance indicator KPI dashboard which can be used to measure the financial performance of the real estate company. It covers various kpis such as sales vs target per agent, top 10 projects, top 5 agencies etc. If your project calls for a presentation, then Slidegeeks is your go-to partner because we have professionally designed, easy-to-edit templates that are perfect for any presentation. After downloading, you can easily edit Successful Risk Administration KPI Dashboard To Track Effectiveness Of Real Estate Business Template PDF and make the changes accordingly. You can rearrange slides or fill them with different images. Check out all the handy templates.

KPI Dashboard For Supplier Monitoring Vendor Management Program For Supplier Growth And Development Background PDF
The slide depicts the KPI dashboard for the supplier monitoring. It provides information regarding the monthly purchase value, number of contracted suppliers, scheduled and completed audits along with vendors quality performance.Do you have to make sure that everyone on your team knows about any specific topic I yes, then you should give KPI Dashboard For Supplier Monitoring Vendor Management Program For Supplier Growth And Development Background PDF a try. Our experts have put a lot of knowledge and effort into creating this impeccable KPI Dashboard For Supplier Monitoring Vendor Management Program For Supplier Growth And Development Background PDF. You can use this template for your upcoming presentations, as the slides are perfect to represent even the tiniest detail. You can download these templates from the Slidegeeks website and these are easy to edit. So grab these today.

Brand Management Strategy To Increase Awareness Brand Awareness Measuring KPI Dashboard Mockup PDF
Following slide illustrates KPI dashboard that can be used to track the awareness level of a specific brand. KPIs covered in the slide are traffic, attention, authority, inbound channel performance etc. Do you have to make sure that everyone on your team knows about any specific topic I yes, then you should give Brand Management Strategy To Increase Awareness Brand Awareness Measuring KPI Dashboard Mockup PDF a try. Our experts have put a lot of knowledge and effort into creating this impeccable Brand Management Strategy To Increase Awareness Brand Awareness Measuring KPI Dashboard Mockup PDF. You can use this template for your upcoming presentations, as the slides are perfect to represent even the tiniest detail. You can download these templates from the Slidegeeks website and these are easy to edit. So grab these today
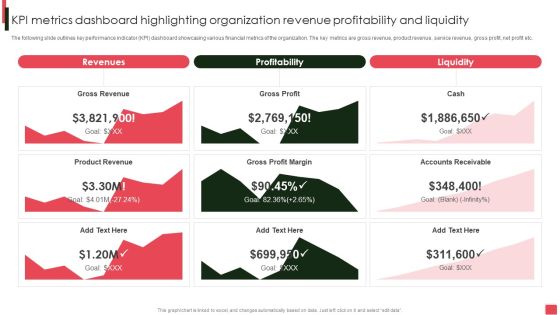
Overview Of Organizational Kpi Metrics Dashboard Highlighting Organization Revenue Brochure PDF
The following slide outlines key performance indicator KPI dashboard showcasing various financial metrics of the organization. The key metrics are gross revenue, product revenue, service revenue, gross profit, net profit etc. If your project calls for a presentation, then Slidegeeks is your go-to partner because we have professionally designed, easy-to-edit templates that are perfect for any presentation. After downloading, you can easily edit Overview Of Organizational Kpi Metrics Dashboard Highlighting Organization Revenue Brochure PDF and make the changes accordingly. You can rearrange slides or fill them with different images. Check out all the handy templates.
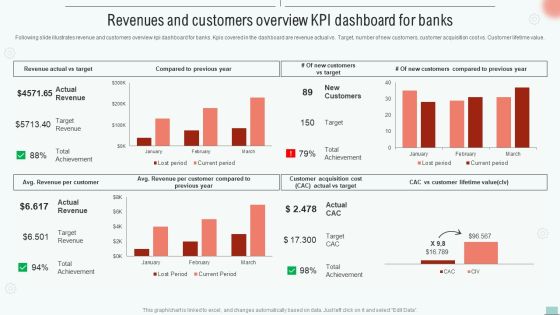
Implementing BPM Tool To Enhance Operational Efficiency Revenues And Customers Overview Kpi Dashboard Rules PDF
Following slide illustrates revenue and customers overview kpi dashboard for banks. Kpis covered in the dashboard are revenue actual vs. Target, number of new customers, customer acquisition cost vs. Customer lifetime value.This Implementing BPM Tool To Enhance Operational Efficiency Revenues And Customers Overview Kpi Dashboard Rules PDF is perfect for any presentation, be it in front of clients or colleagues. It is a versatile and stylish solution for organizing your meetings. The Implementing BPM Tool To Enhance Operational Efficiency Revenues And Customers Overview Kpi Dashboard Rules PDF features a modern design for your presentation meetings. The adjustable and customizable slides provide unlimited possibilities for acing up your presentation. Slidegeeks has done all the homework before launching the product for you. So, do not wait, grab the presentation templates today.

Executing Risk Mitigation KPI Dashboard To Track Effectiveness Of Real Estate Rules PDF
The following slide exhibits key performance indicator KPI dashboard which can be used to measure the financial performance of the real estate company. It covers various KPIs such as sales vs target per agent, top 10 projects, top 5 agencies etc. Find highly impressive Executing Risk Mitigation KPI Dashboard To Track Effectiveness Of Real Estate Rules PDF on Slidegeeks to deliver a meaningful presentation. You can save an ample amount of time using these presentation templates. No need to worry to prepare everything from scratch because Slidegeeks experts have already done a huge research and work for you. You need to download Executing Risk Mitigation Kpi Dashboard To Track Effectiveness Of Real Estate Rules PDF for your upcoming presentation. All the presentation templates are 100 percent editable and you can change the color and personalize the content accordingly. Download now.

Social Media Kpi Analytics Measurement Business Social Strategy Guide Infographics PDF
This template covers key performance indicator KPI to determine the performance against the company objectives. These Social media KPIs would be focusing on social engagements, content reach, purchase leads and conversions. If you are looking for a format to display your unique thoughts, then the professionally designed Social Media Kpi Analytics Measurement Business Social Strategy Guide Infographics PDF is the one for you. You can use it as a Google Slides template or a PowerPoint template. Incorporate impressive visuals, symbols, images, and other charts. Modify or reorganize the text boxes as you desire. Experiment with shade schemes and font pairings. Alter, share or cooperate with other people on your work. Download Social Media Kpi Analytics Measurement Business Social Strategy Guide Infographics PDF and find out how to give a successful presentation. Present a perfect display to your team and make your presentation unforgettable.

Brand Analytics KPI Dashboard For Organization Ppt PowerPoint Presentation Diagram PDF
The following slide outlines key performance indicator KPI dashboard that can assist marketers to evaluate brand performance on social media channels. The metrics covered are age group, gender, brand perception, branding themes, celebrity analysis, etc. Take your projects to the next level with our ultimate collection of Brand Analytics KPI Dashboard For Organization Ppt PowerPoint Presentation Diagram PDF. Slidegeeks has designed a range of layouts that are perfect for representing task or activity duration, keeping track of all your deadlines at a glance. Tailor these designs to your exact needs and give them a truly corporate look with your own brand colors they will make your projects stand out from the rest.
Organizing Security Awareness KPI Metrics Dashboard To Effectively Track Cyber Threat Icons PDF
The purpose of this slide is to highlight performance KPI dashboard used to monitor the cyber threat management.. The metrics highlighted in the slide are risk score, compliance status, threat level, monitoring and operational status. This Organizing Security Awareness KPI Metrics Dashboard To Effectively Track Cyber Threat Icons PDF is perfect for any presentation, be it in front of clients or colleagues. It is a versatile and stylish solution for organizing your meetings. The Organizing Security Awareness KPI Metrics Dashboard To Effectively Track Cyber Threat Icons PDF features a modern design for your presentation meetings. The adjustable and customizable slides provide unlimited possibilities for acing up your presentation. Slidegeeks has done all the homework before launching the product for you. So, dont wait, grab the presentation templates today.
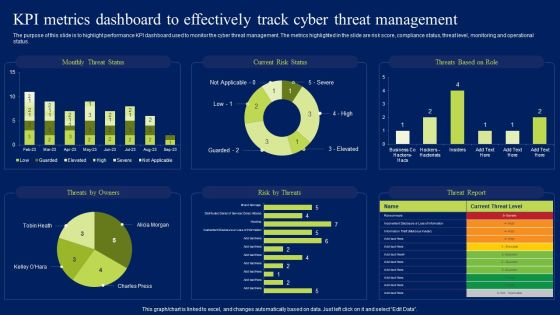
Kpi Metrics Dashboard To Effectively Track Cyber Threat Management Ppt Styles Guide PDF
The purpose of this slide is to highlight performance KPI dashboard used to monitor the cyber threat management. The metrics highlighted in the slide are risk score, compliance status, threat level, monitoring and operational status. Formulating a presentation can take up a lot of effort and time, so the content and message should always be the primary focus. The visuals of the PowerPoint can enhance the presenters message, so our Kpi Metrics Dashboard To Effectively Track Cyber Threat Management Ppt Styles Guide PDF was created to help save time. Instead of worrying about the design, the presenter can concentrate on the message while our designers work on creating the ideal templates for whatever situation is needed. Slidegeeks has experts for everything from amazing designs to valuable content, we have put everything into Kpi Metrics Dashboard To Effectively Track Cyber Threat Management Ppt Styles Guide PDF.
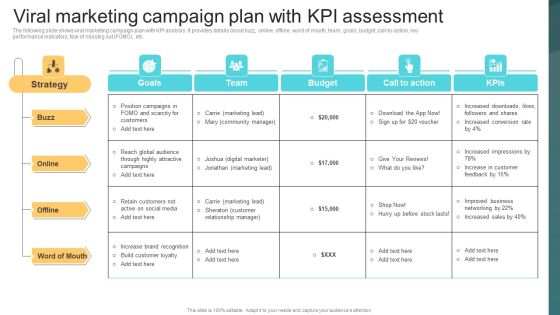
Viral Marketing Campaign Plan With Kpi Assessment Deploying Viral Marketing Strategies Brochure PDF
The following slide shows viral marketing campaign plan with KPI analysis. It provides details about buzz, online, offline, word of mouth, team, goals, budget, call to action, key performance indicators, fear of missing out FOMO, etc. Find highly impressive Viral Marketing Campaign Plan With Kpi Assessment Deploying Viral Marketing Strategies Brochure PDF on Slidegeeks to deliver a meaningful presentation. You can save an ample amount of time using these presentation templates. No need to worry to prepare everything from scratch because Slidegeeks experts have already done a huge research and work for you. You need to download Viral Marketing Campaign Plan With Kpi Assessment Deploying Viral Marketing Strategies Brochure PDF for your upcoming presentation. All the presentation templates are 100 precent editable and you can change the color and personalize the content accordingly. Download now.
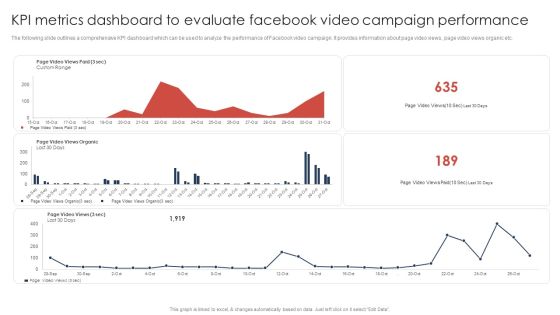
Kpi Metrics Dashboard To Evaluate Facebook Video Campaign Performance Information PDF
The following slide outlines a comprehensive KPI dashboard which can be used to analyze the performance of Facebook video campaign. It provides information about page video views, page video views organic etc. Whether you have daily or monthly meetings, a brilliant presentation is necessary. Kpi Metrics Dashboard To Evaluate Facebook Video Campaign Performance Information PDF can be your best option for delivering a presentation. Represent everything in detail using Kpi Metrics Dashboard To Evaluate Facebook Video Campaign Performance Information PDF and make yourself stand out in meetings. The template is versatile and follows a structure that will cater to your requirements. All the templates prepared by Slidegeeks are easy to download and edit. Our research experts have taken care of the corporate themes as well. So, give it a try and see the results.

Market Research To Determine Business Opportunities Brand Analytics KPI Dashboard For Organization Inspiration PDF
The following slide outlines key performance indicator KPI dashboard that can assist marketers to evaluate brand performance on social media channels. The metrics covered are age group, gender, brand perception, branding themes, celebrity analysis, etc. There are so many reasons you need a Market Research To Determine Business Opportunities Brand Analytics KPI Dashboard For Organization Inspiration PDF. The first reason is you cannot spend time making everything from scratch, Thus, Slidegeeks has made presentation templates for you too. You can easily download these templates from our website easily.

KPI Metrics Dashboard To Measure Automation Performance Achieving Operational Efficiency Guidelines PDF
The following slide outlines a comprehensive KPI dashboard which can be used by the organization to measure the automation performance in customer support department. It covers kpis such as customer retention, costs per support, customer satisfaction, etcDeliver and pitch your topic in the best possible manner with this KPI Metrics Dashboard To Measure Automation Performance Achieving Operational Efficiency Guidelines PDF. Use them to share invaluable insights on Customer Retention, Cost Per Support, Request Volume and impress your audience. This template can be altered and modified as per your expectations. So, grab it now.

Comprehensive Market Research Guide Brand Analytics Kpi Dashboard For Organization Brochure PDF
The following slide outlines key performance indicator KPI dashboard that can assist marketers to evaluate brand performance on social media channels. The metrics covered are age group, gender, brand perception, branding themes, celebrity analysis, etc. From laying roadmaps to briefing everything in detail, our templates are perfect for you. You can set the stage with your presentation slides. All you have to do is download these easy-to-edit and customizable templates. Comprehensive Market Research Guide Brand Analytics Kpi Dashboard For Organization Brochure PDF will help you deliver an outstanding performance that everyone would remember and praise you for. Do download this presentation today.
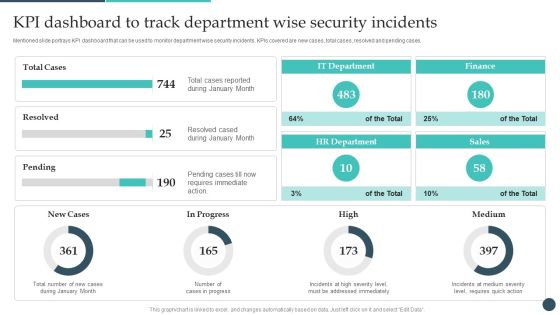
Safety Breach Response Playbook KPI Dashboard To Track Department Wise Rules PDF
Mentioned slide portrays KPI dashboard that can be used to monitor department wise security incidents. KPIs covered are new cases, total cases, resolved and pending cases. Present like a pro with Safety Breach Response Playbook KPI Dashboard To Track Department Wise Rules PDF Create beautiful presentations together with your team, using our easy-to-use presentation slides. Share your ideas in real-time and make changes on the fly by downloading our templates. So whether youre in the office, on the go, or in a remote location, you can stay in sync with your team and present your ideas with confidence. With Slidegeeks presentation got a whole lot easier. Grab these presentations today.

KPI Dashboard To Track Effectiveness Of Real Estate Business Performance Guidelines PDF
The following slide exhibits key performance indicator KPI dashboard which can be used to measure the financial performance of the real estate company. It covers various kpis such as sales vs target per agent, top 10 projects, top 5 agencies etc.Deliver an awe inspiring pitch with this creative KPI Dashboard To Track Effectiveness Of Real Estate Business Performance Guidelines PDF bundle. Topics like Top Projects, Sales Amount, Sales Amount can be discussed with this completely editable template. It is available for immediate download depending on the needs and requirements of the user.
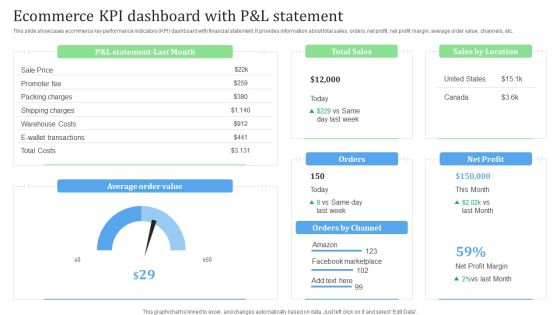
Ecommerce KPI Dashboard With P And L Statement Financial Management Strategies Background PDF
This slide showcases ecommerce key performance indicators KPI dashboard with financial statement. It provides information about total sales, orders, net profit, net profit margin, average order value, channels, etc.Whether you have daily or monthly meetings, a brilliant presentation is necessary. Ecommerce KPI Dashboard With P And L Statement Financial Management Strategies Background PDF can be your best option for delivering a presentation. Represent everything in detail using Ecommerce KPI Dashboard With P And L Statement Financial Management Strategies Background PDF and make yourself stand out in meetings. The template is versatile and follows a structure that will cater to your requirements. All the templates prepared by Slidegeeks are easy to download and edit. Our research experts have taken care of the corporate themes as well. So, give it a try and see the results.
Development And Operations KPI Dashboard With Central Processing Unit Statistics Icons PDF
This slide covers devops KPI metrics dashboard with central processing unit statistics about input output statistics , network traffic volume under during recorded sessions. Further, this template includes numbers of sessions with waiting time.Showcasing this set of slides titled Development And Operations KPI Dashboard With Central Processing Unit Statistics Icons PDF The topics addressed in these templates are Central Processing, Output Statistics, Resource Limits All the content presented in this PPT design is completely editable. Download it and make adjustments in color, background, font etc. as per your unique business setting.

Logistics KPI Dashboard For Supply Chain Management To Enhance Logistics Operations Professional PDF
This slide displays the logistics dashboard for monitoring and reporting warehouse operations and transportation processes. It include KPIs such as revenue, shipments, avg delivery time, fleet status, delivery status, average loading time and weight, etc. Pitch your topic with ease and precision using this Logistics KPI Dashboard For Supply Chain Management To Enhance Logistics Operations Professional PDF. This layout presents information on Logistics KPI, Dashboard For Supply Chain, Management To Enhance, Logistics Operations. It is also available for immediate download and adjustment. So, changes can be made in the color, design, graphics or any other component to create a unique layout.
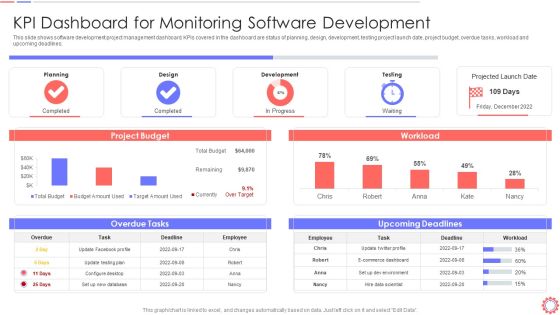
Developer Operations Automated Tools And Initiatives IT KPI Dashboard For Monitoring Demonstration PDF
This slide shows software development project management dashboard. KPIs covered in the dashboard are status of planning, design, development, testing project launch date, project budget, overdue tasks, workload and upcoming deadlines. Deliver an awe inspiring pitch with this creative developer operations automated tools and initiatives it kpi dashboard for monitoring demonstration pdf bundle. Topics like kpi dashboard for monitoring software development can be discussed with this completely editable template. It is available for immediate download depending on the needs and requirements of the user.

KPI Metrics Dashboard To Effectively Track Cyber Threat Management Demonstration PDF
The purpose of this slide is to highlight performance KPI dashboard used to monitor the cyber threat management. The metrics highlighted in the slide are risk score, compliance status, threat level, monitoring and operational status. Deliver an awe inspiring pitch with this creative KPI Metrics Dashboard To Effectively Track Cyber Threat Management Demonstration PDF bundle. Topics like Threat Status, Current Risk, Threat Report can be discussed with this completely editable template. It is available for immediate download depending on the needs and requirements of the user.
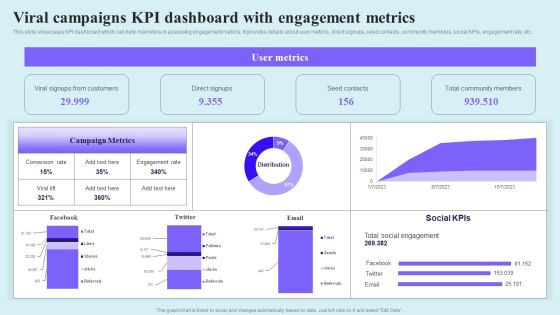
Go Viral Campaign Strategies To Increase Engagement Viral Campaigns KPI Dashboard With Engagement Demonstration PDF
This slide showcases KPI dashboard which can help marketers in assessing engagement metrics. It provides details about user metrics, direct signups, seed contacts, community members, social KPIs, engagement rate, etc. Take your projects to the next level with our ultimate collection of Go Viral Campaign Strategies To Increase Engagement Viral Campaigns KPI Dashboard With Engagement Demonstration PDF. Slidegeeks has designed a range of layouts that are perfect for representing task or activity duration, keeping track of all your deadlines at a glance. Tailor these designs to your exact needs and give them a truly corporate look with your own brand colors they will make your projects stand out from the rest.
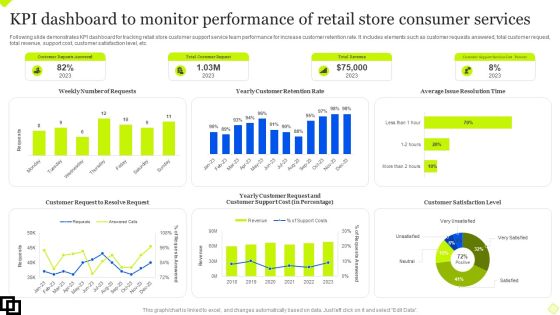
KPI Dashboard To Monitor Performance Of Retail Store Consumer Services Summary PDF
Following slide demonstrates KPI dashboard for tracking retail store customer support service team performance for increase customer retention rate. It includes elements such as customer requests answered, total customer request, total revenue, support cost, customer satisfaction level, etc. Showcasing this set of slides titled KPI Dashboard To Monitor Performance Of Retail Store Consumer Services Summary PDF. The topics addressed in these templates are Customer Request, Customer Retention Rate, Customer Satisfaction Level. All the content presented in this PPT design is completely editable. Download it and make adjustments in color, background, font etc. as per your unique business setting.
Robotic Process Automation Dashboard With Monthly Test Execution KPI Icons PDF
This slide covers RPA metrics for analyzing test execution on automated platforms. It also includes test execution metrics such as total test executed, test status, tests executed daily for different operation systems, etc. Pitch your topic with ease and precision using this Robotic Process Automation Dashboard With Monthly Test Execution KPI Icons PDF. This layout presents information on Robotic Process Automation Dashboard, Monthly Test Execution Kpi. It is also available for immediate download and adjustment. So, changes can be made in the color, design, graphics or any other component to create a unique layout.
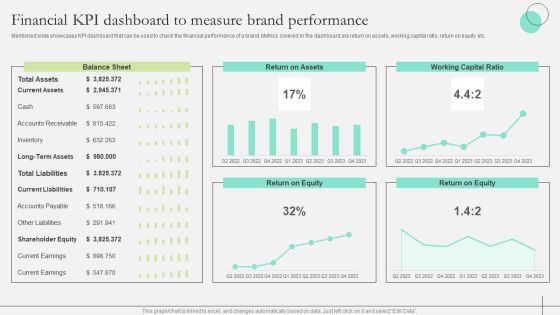
Comprehensive Guide To Strengthen Brand Equity Financial KPI Dashboard Measure Brand Structure PDF
Mentioned slide showcases KPI dashboard that can be used to check the financial performance of a brand. Metrics covered in the dashboard are return on assets, working capital ratio, return on equity etc. Take your projects to the next level with our ultimate collection of Comprehensive Guide To Strengthen Brand Equity Financial KPI Dashboard Measure Brand Structure PDF. Slidegeeks has designed a range of layouts that are perfect for representing task or activity duration, keeping track of all your deadlines at a glance. Tailor these designs to your exact needs and give them a truly corporate look with your own brand colors they will make your projects stand out from the rest

KPI Dashboard For ESO System Ppt PowerPoint Presentation File Template PDF
This slide covers kpi dashboard for enterprise security operations. It involves details such as active alerts, active automated investigation, devices with major issues and report of daily devices. Pitch your topic with ease and precision using this KPI Dashboard For ESO System Ppt PowerPoint Presentation File Template PDF. This layout presents information on Security Health, Misconfigured, Service Operating Normally. It is also available for immediate download and adjustment. So, changes can be made in the color, design, graphics or any other component to create a unique layout.

KPI Dashboard To Evaluate Growth In Sales Funnel Reporting Topics PDF
This slide represents the KPI dashboard to measure sales pipeline reporting for increasing customer conversion rate. It includes activity by representative, forecast by month and monthly growth. Pitch your topic with ease and precision using this KPI Dashboard To Evaluate Growth In Sales Funnel Reporting Topics PDF. This layout presents information on Pipeline Requirement, Key Activities, Pipeline Closed Date. It is also available for immediate download and adjustment. So, changes can be made in the color, design, graphics or any other component to create a unique layout.

Managing Cyber Security Incident Response KPI Dashboard Ppt Layouts Shapes PDF
This slide covers cyber security incident response KPI dashboard. It involves details such as intent alarm, event trend sources, event trend, sensor activity, major operating systems and asset information. Pitch your topic with ease and precision using this Managing Cyber Security Incident Response KPI Dashboard Ppt Layouts Shapes PDF. This layout presents information on Top Alarms Method, Alarms Intent, Timely Event Trend. It is also available for immediate download and adjustment. So, changes can be made in the color, design, graphics or any other component to create a unique layout.

ESO System Incident Management KPI Dashboard Ppt PowerPoint Presentation File Graphic Images PDF
This slide covers enterprise security operation incident management kpi dashboard. It involves details such as average resolution time, new incidents, incident status and new incidents by category. Pitch your topic with ease and precision using this ESO System Incident Management KPI Dashboard Ppt PowerPoint Presentation File Graphic Images PDF. This layout presents information on Average Resolution Time, Incident Status, New Incidents. It is also available for immediate download and adjustment. So, changes can be made in the color, design, graphics or any other component to create a unique layout.
Industry Analysis For Food Manufacturing Market KPI Dashboard For Tracking Supply Chain Costs Information PDF
This slide represents the KPI Dashboard to track the Multiple Cost Associated with Supply Chain in Food Manufacturing Industry. It includes information regarding Cash to Cash Cycle in days, Carry Cost of Inventory along with details of Net Sales.Deliver an awe inspiring pitch with this creative Industry Analysis For Food Manufacturing Market KPI Dashboard For Tracking Supply Chain Costs Information PDF bundle. Topics like Carrying Inventory, Supply Costs, Supply Chain can be discussed with this completely editable template. It is available for immediate download depending on the needs and requirements of the user.
KPI Dashboard For Tracking Supply Chain Costs Ppt Summary Templates PDF
This slide represents the KPI dashboard to track the multiple cost associated with supply chain in food manufacturing industry. It includes information regarding cash to cash cycle in days, carry cost of inventory along with details of net sales. Deliver an awe inspiring pitch with this creative KPI Dashboard For Tracking Supply Chain Costs Ppt Summary Templates PDF bundle. Topics like Supply Chain, Costs vs Sales, Carrying Costs Inventory, Supply Chain Costs can be discussed with this completely editable template. It is available for immediate download depending on the needs and requirements of the user.
Precooked Food Industry Analysis KPI Dashboard For Tracking Supply Chain Costs Diagrams PDF
This slide represents the KPI dashboard to track the multiple cost associated with supply chain in food manufacturing industry. It includes information regarding cash to cash cycle in days, carry cost of inventory along with details of net sales.Deliver an awe inspiring pitch with this creative Precooked Food Industry Analysis KPI Dashboard For Tracking Supply Chain Costs Diagrams PDF bundle. Topics like Processing Industry, Food Processing, Manufacturing Industry can be discussed with this completely editable template. It is available for immediate download depending on the needs and requirements of the user.

Brand Value Measuring KPI Dashboard Guide To Understand Evaluate And Enhance Brand Value Slides PDF
Following slide illustrates KPI dashboard to measure brand value. KPIs covered are brand value and percentage change, brand value over time, most followed brands on social media.Take your projects to the next level with our ultimate collection of Brand Value Measuring KPI Dashboard Guide To Understand Evaluate And Enhance Brand Value Slides PDF. Slidegeeks has designed a range of layouts that are perfect for representing task or activity duration, keeping track of all your deadlines at a glance. Tailor these designs to your exact needs and give them a truly corporate look with your own brand colors they all make your projects stand out from the rest
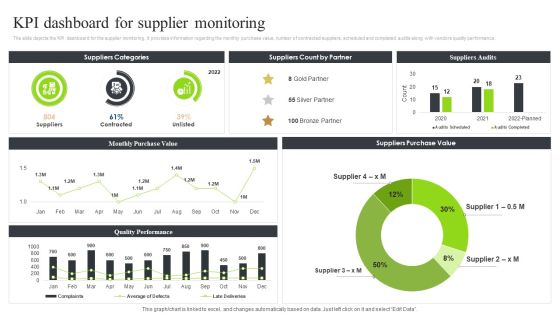
Strategic Sourcing And Supplier Quality Kpi Dashboard For Supplier Monitoring Graphics PDF
The slide depicts the KPI dashboard for the supplier monitoring. It provides information regarding the monthly purchase value, number of contracted suppliers, scheduled and completed audits along with vendors quality performance.Take your projects to the next level with our ultimate collection of Strategic Sourcing And Supplier Quality Kpi Dashboard For Supplier Monitoring Graphics PDF. Slidegeeks has designed a range of layouts that are perfect for representing task or activity duration, keeping track of all your deadlines at a glance. Tailor these designs to your exact needs and give them a truly corporate look with your own brand colors they all make your projects stand out from the rest.
KPI Dashboard For Tracking Supply Chain Costs Industry Analysis Of Food Formats PDF
This slide represents the KPI dashboard to track the multiple cost associated with supply chain in food manufacturing industry. It includes information regarding cash to cash cycle in days, carry cost of inventory along with details of net sales.Find a pre-designed and impeccable KPI Dashboard For Tracking Supply Chain Costs Industry Analysis Of Food Formats PDF. The templates can ace your presentation without additional effort. You can download these easy-to-edit presentation templates to make your presentation stand out from others. So, what are you waiting for Download the template from Slidegeeks today and give a unique touch to your presentation.
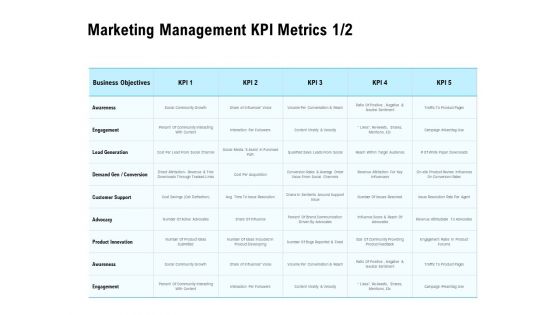
Optimizing The Marketing Operations To Drive Efficiencies Marketing Management KPI Metrics Business Pictures PDF
Deliver an awe inspiring pitch with this creative optimizing the marketing operations to drive efficiencies marketing management kpi metrics business pictures pdf bundle. Topics like product, purchase, average, growth, business can be discussed with this completely editable template. It is available for immediate download depending on the needs and requirements of the user.

Functional Analysis Of Business Operations Infrastructure KPI Metrics Showing Square Meter Area Mockup PDF
Presenting this set of slides with name functional analysis of business operations infrastructure kpi metrics showing square meter area mockup pdf. This is a three stage process. The stages in this process are square meter price, construction time, activities starting. This is a completely editable PowerPoint presentation and is available for immediate download. Download now and impress your audience.
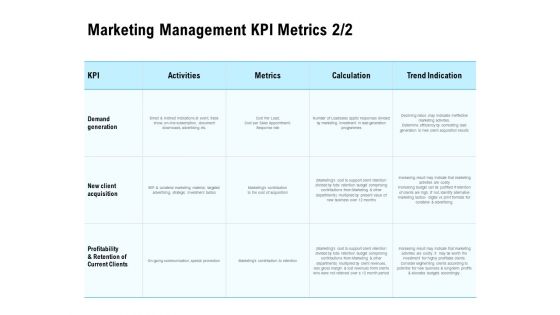
Optimizing The Marketing Operations To Drive Efficiencies Marketing Management KPI Metrics Investment Information PDF
Deliver an awe inspiring pitch with this creative optimizing the marketing operations to drive efficiencies marketing management kpi metrics investment information pdf bundle. Topics like marketing, strategic, investment, material, targeted can be discussed with this completely editable template. It is available for immediate download depending on the needs and requirements of the user.
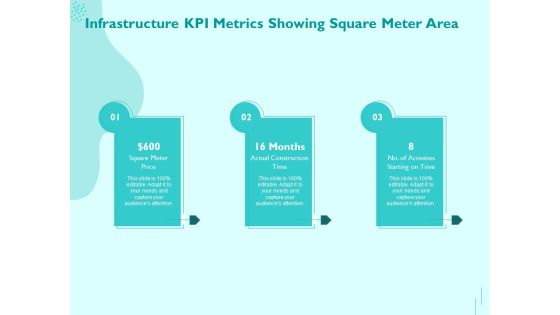
Managing IT Operating System Infrastructure KPI Metrics Showing Square Meter Area Infographics PDF
Presenting this set of slides with name managing it operating system infrastructure kpi metrics showing square meter area infographics pdf. This is a three stage process. The stages in this process are square meter price, actual construction time, no. of activities starting on time. This is a completely editable PowerPoint presentation and is available for immediate download. Download now and impress your audience.
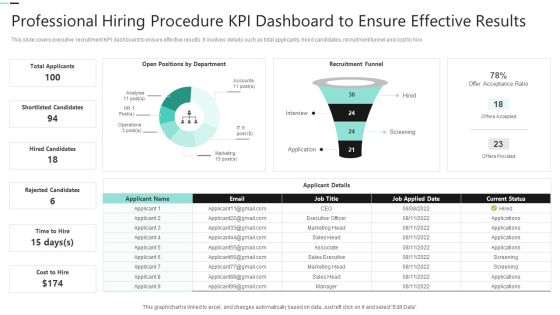
Professional Hiring Procedure KPI Dashboard To Ensure Effective Results Summary PDF
Showcasing this set of slides titled Professional Hiring Procedure KPI Dashboard To Ensure Effective Results Summary PDF. The topics addressed in these templates are Shortlisted Candidates, Hired Candidates, Rejected Candidates. All the content presented in this PPT design is completely editable. Download it and make adjustments in color, background, font etc. as per your unique business setting.
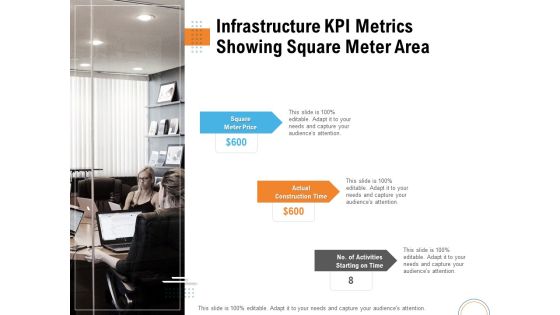
Utilizing Infrastructure Management Using Latest Methods Infrastructure KPI Metrics Showing Square Meter Area Summary PDF
Presenting utilizing infrastructure management using latest methods infrastructure kpi metrics showing square meter area summary pdf to provide visual cues and insights. Share and navigate important information on three stages that need your due attention. This template can be used to pitch topics like square meter price, actual construction time, no activities starting time. In addition, this PPT design contains high-resolution images, graphics, etc, that are easily editable and available for immediate download.

Dashboard Survey Response Results KPI Report For Mobile Operating System Designs PDF
Showcasing this set of slides titled Dashboard Survey Response Results KPI Report For Mobile Operating System Designs PDF. The topics addressed in these templates are Operating System, Survey Results, Completed Survey. All the content presented in this PPT design is completely editable. Download it and make adjustments in color, background, font etc. as per your unique business setting.

Facility Operations Contol Infrastructure Kpi Dashboard Showing Cost Reduction And Procurement Brochure PDF
Presenting this set of slides with name facility operations contol infrastructure kpi dashboard showing cost reduction and procurement brochure pdf. The topics discussed in these slides are cost reduction, procurement roi, cost reduction, cost savings, cost avoidance, cost of purchase order. This is a completely editable PowerPoint presentation and is available for immediate download. Download now and impress your audience.

Facility Operations Contol Infrastructure Kpi Dashboard Showing Resource Allocation Slides PDF
Presenting this set of slides with name facility operations contol infrastructure kpi dashboard showing resource allocation slides pdf. The topics discussed in these slides are delivery timeline and resources, project financially, resource allocation, days per project. This is a completely editable PowerPoint presentation and is available for immediate download. Download now and impress your audience.
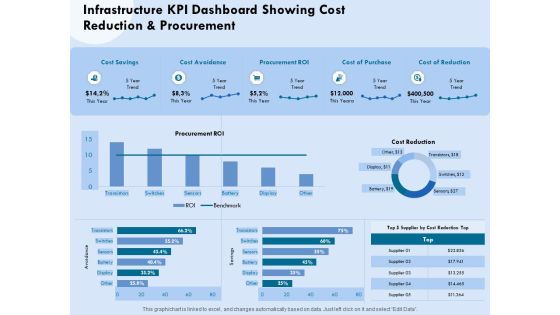
Functional Analysis Of Business Operations Infrastructure KPI Dashboard Showing Cost Reduction Elements PDF
Presenting this set of slides with name functional analysis of business operations infrastructure kpi dashboard showing cost reduction elements pdf. The topics discussed in these slides are cost savings, cost avoidance, procurement, cost of purchase, cost of reduction. This is a completely editable PowerPoint presentation and is available for immediate download. Download now and impress your audience.
Functional Analysis Of Business Operations Infrastructure KPI Dashboard Showing Resource Allocation Icons PDF
Presenting this set of slides with name functional analysis of business operations infrastructure kpi dashboard showing resource allocation icons pdf. The topics discussed in these slides are project financial, resource allocation, timeline. This is a completely editable PowerPoint presentation and is available for immediate download. Download now and impress your audience.
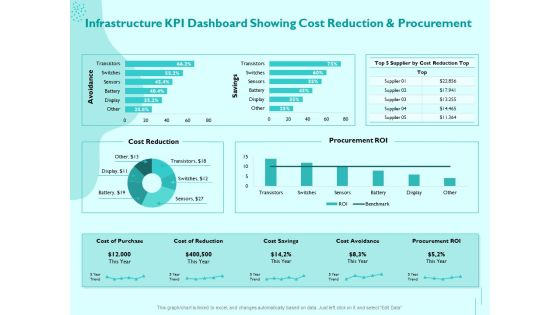
Managing IT Operating System Infrastructure KPI Dashboard Showing Cost Reduction And Procurement Brochure PDF
Presenting this set of slides with name managing it operating system infrastructure kpi dashboard showing cost reduction and procurement brochure pdf. The topics discussed in these slides are cost savings, cost avoidance, procurement roi, cost of reduction, cost of purchase. This is a completely editable PowerPoint presentation and is available for immediate download. Download now and impress your audience.
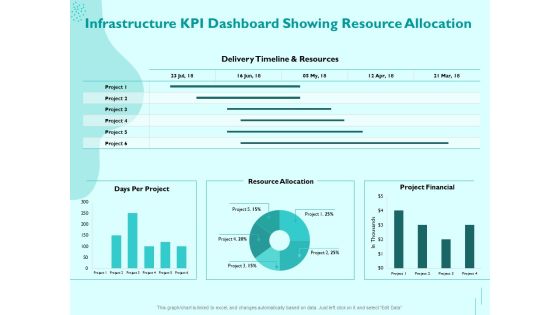
Managing IT Operating System Infrastructure KPI Dashboard Showing Resource Allocation Portrait PDF
Presenting this set of slides with name managing it operating system infrastructure kpi dashboard showing resource allocation portrait pdf. The topics discussed in these slides are delivery timeline and resources, resource allocation, project financial, days per project. This is a completely editable PowerPoint presentation and is available for immediate download. Download now and impress your audience.
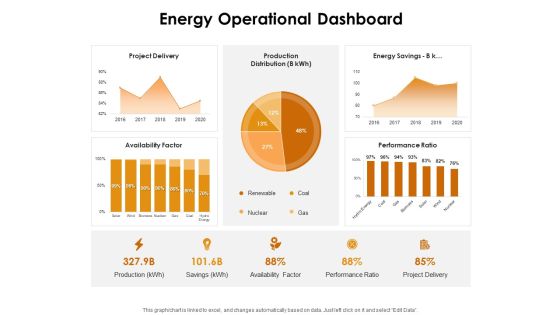
KPI Dashboards Per Industry Energy Operational Dashboard Ppt PowerPoint Presentation Outline Shapes PDF
Deliver and pitch your topic in the best possible manner with this kpi dashboards per industry energy operational dashboard ppt powerpoint presentation outline shapes pdf. Use them to share invaluable insights on project delivery, production distribution, energy savings, availability factor, coal, gas and impress your audience. This template can be altered and modified as per your expectations. So, grab it now.

Improving Operational Activities Enterprise Infrastructure Kpi Dashboard Showing Resource Allocation Ideas PDF
Deliver and pitch your topic in the best possible manner with this improving operational activities enterprise infrastructure kpi dashboard showing resource allocation ideas pdf. Use them to share invaluable insights on days per project, project financial, resource allocation and impress your audience. This template can be altered and modified as per your expectations. So, grab it now.

Fiscal And Operational Assessment Infrastructure KPI Dashboard Showing Resource Allocation Mockup PDF
Deliver an awe inspiring pitch with this creative fiscal and operational assessment infrastructure kpi dashboard showing resource allocation mockup pdf bundle. Topics like resource allocation, project financial, days per project can be discussed with this completely editable template. It is available for immediate download depending on the needs and requirements of the user.
Development And Operations KPI Dashboard IT Post It Notes Inspiration PDF
Presenting development and operations kpi dashboard it post it notes inspiration pdf to provide visual cues and insights. Share and navigate important information on four stages that need your due attention. This template can be used to pitch topics like post it notes. In addtion, this PPT design contains high resolution images, graphics, etc, that are easily editable and available for immediate download.
Icons Slide For Development And Operations KPI Dashboard IT Clipart PDF
Introducing our well designed icons slide for development and operations kpi dashboard it clipart pdf set of slides. The slide displays editable icons to enhance your visual presentation. The icons can be edited easily. So customize according to your business to achieve a creative edge. Download and share it with your audience.
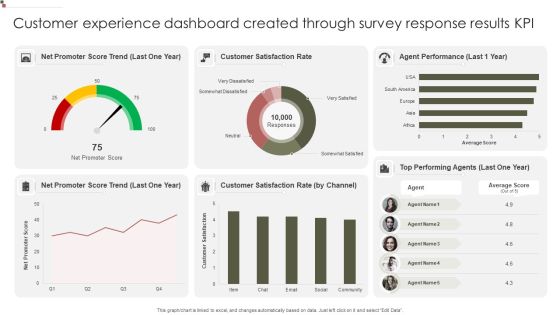
Customer Experience Dashboard Created Through Survey Response Results KPI Mockup PDF
Showcasing this set of slides titled Customer Experience Dashboard Created Through Survey Response Results KPI Mockup PDF. The topics addressed in these templates are Promoter Score, Customer Satisfaction, Agent Performance. All the content presented in this PPT design is completely editable. Download it and make adjustments in color, background, font etc. as per your unique business setting.

All About HRM Human Resources KPI Dashboard Finance Ppt Gallery Template PDF
Presenting this set of slides with name all about hrm human resources kpi dashboard finance ppt gallery template pdf. The topics discussed in these slides are finance, sales, marketing, operation. This is a completely editable PowerPoint presentation and is available for immediate download. Download now and impress your audience.
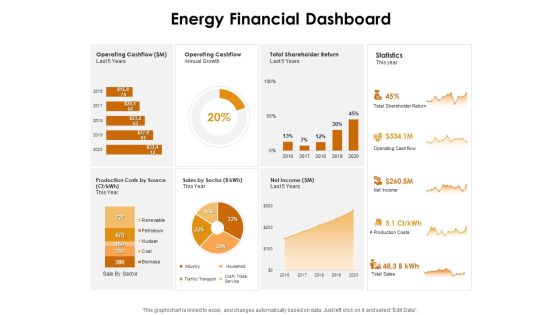
KPI Dashboards Per Industry Energy Financial Dashboard Ppt PowerPoint Presentation Professional Example File PDF
Deliver and pitch your topic in the best possible manner with this kpi dashboards per industry energy financial dashboard ppt powerpoint presentation professional example file pdf. Use them to share invaluable insights on operating cashflow, total shareholder return, production costs source, sales sector, net income and impress your audience. This template can be altered and modified as per your expectations. So, grab it now.
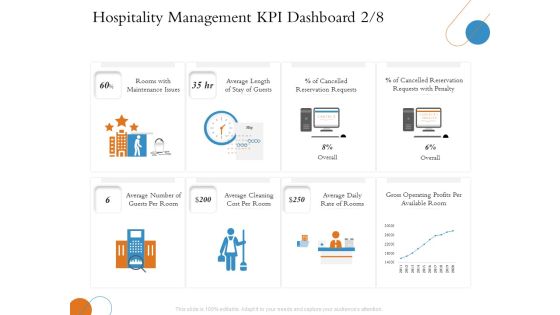
Overview Of Hospitality Industry Hospitality Management KPI Dashboard Average Professional PDF
Deliver an awe inspiring pitch with this creative overview of hospitality industry hospitality management kpi dashboard average professional pdf bundle. Topics like average, cost, gross operating, reservation, maintenance can be discussed with this completely editable template. It is available for immediate download depending on the needs and requirements of the user.
