AI PPT Maker
Templates
PPT Bundles
Design Services
Business PPTs
Business Plan
Management
Strategy
Introduction PPT
Roadmap
Self Introduction
Timelines
Process
Marketing
Agenda
Technology
Medical
Startup Business Plan
Cyber Security
Dashboards
SWOT
Proposals
Education
Pitch Deck
Digital Marketing
KPIs
Project Management
Product Management
Artificial Intelligence
Target Market
Communication
Supply Chain
Google Slides
Research Services
 One Pagers
All Categories
-
Home
- Customer Favorites
- Employee Turnover Dashboard
Employee Turnover Dashboard
Real Estate Sales Tracking Dashboard With Inquiry Referrals Ppt PowerPoint Presentation File Samples PDF
This slide showcases dashboard to track property sales KPIs for smooth flow of operations. It includes information such as rent, social media, digital ads, agent wise sales, etc. Showcasing this set of slides titled Real Estate Sales Tracking Dashboard With Inquiry Referrals Ppt PowerPoint Presentation File Samples PDF. The topics addressed in these templates are Property Inquiry Referrals, Properties Sold And Rent By Agent, Sales By Religion, Sales Target. All the content presented in this PPT design is completely editable. Download it and make adjustments in color, background, font etc. as per your unique business setting.
E Commerce Operations In B2b B2b Sales Performance Tracking Dashboard Icons PDF
This slide represents metric dashboard to track sales performance on e-commerce website. It cover performance indicators such as sales breakdown, order breakdown, recurring sales etc. Slidegeeks is one of the best resources for PowerPoint templates. You can download easily and regulate E Commerce Operations In B2b B2b Sales Performance Tracking Dashboard Icons PDF for your personal presentations from our wonderful collection. A few clicks is all it takes to discover and get the most relevant and appropriate templates. Use our Templates to add a unique zing and appeal to your presentation and meetings. All the slides are easy to edit and you can use them even for advertisement purposes.

KPI Dashboard To Track Sales And Operations Process Of Manufacturing Enterprise Brochure PDF
This slide depicts a dashboard to track the key performance metrics in sales and operations process of a manufacturing enterprise to analyze deviations in the actual and planned output. The key performing indicators are percentage deviation, dollar deviation, inventory in hand etc.Pitch your topic with ease and precision using this KPI Dashboard To Track Sales And Operations Process Of Manufacturing Enterprise Brochure PDF. This layout presents information on Planned Output, Yearly Growth, Inventory Hand. It is also available for immediate download and adjustment. So, changes can be made in the color, design, graphics or any other component to create a unique layout.

System Deployment Project Customer Relationship Management Software Kpi Dashboard Rules PDF
This slide represents the dashboard showing details related to customer relationship management software. It includes details related to outbound sales, contracts closed, average contract value etc. Present like a pro with System Deployment Project Customer Relationship Management Software Kpi Dashboard Rules PDF Create beautiful presentations together with your team, using our easy-to-use presentation slides. Share your ideas in real-time and make changes on the fly by downloading our templates. So whether youre in the office, on the go, or in a remote location, you can stay in sync with your team and present your ideas with confidence. With Slidegeeks presentation got a whole lot easier. Grab these presentations today.
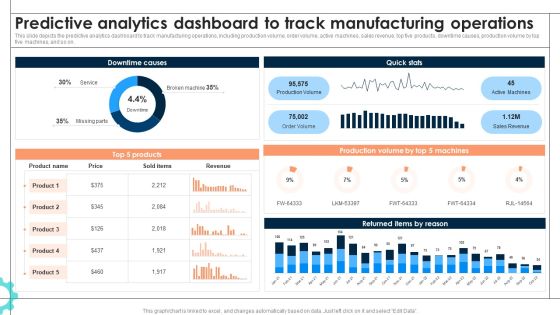
Intelligent Manufacturing Predictive Analytics Dashboard To Track Manufacturing Operations Information PDF
This slide depicts the predictive analytics dashboard to track manufacturing operations, including production volume, order volume, active machines, sales revenue, top five products, downtime causes, production volume by top five machines, and so on. If you are looking for a format to display your unique thoughts, then the professionally designed Intelligent Manufacturing Predictive Analytics Dashboard To Track Manufacturing Operations Information PDF is the one for you. You can use it as a Google Slides template or a PowerPoint template. Incorporate impressive visuals, symbols, images, and other charts. Modify or reorganize the text boxes as you desire. Experiment with shade schemes and font pairings. Alter, share or cooperate with other people on your work. Download Intelligent Manufacturing Predictive Analytics Dashboard To Track Manufacturing Operations Information PDF and find out how to give a successful presentation. Present a perfect display to your team and make your presentation unforgettable.

Iot Integration In Manufacturing Predictive Analytics Dashboard To Track Manufacturing Operations Background PDF
This slide depicts the predictive analytics dashboard to track manufacturing operations, including production volume, order volume, active machines, sales revenue, top five products, downtime causes, production volume by top five machines, and so on. If you are looking for a format to display your unique thoughts, then the professionally designed Iot Integration In Manufacturing Predictive Analytics Dashboard To Track Manufacturing Operations Background PDF is the one for you. You can use it as a Google Slides template or a PowerPoint template. Incorporate impressive visuals, symbols, images, and other charts. Modify or reorganize the text boxes as you desire. Experiment with shade schemes and font pairings. Alter, share or cooperate with other people on your work. Download Iot Integration In Manufacturing Predictive Analytics Dashboard To Track Manufacturing Operations Background PDF and find out how to give a successful presentation. Present a perfect display to your team and make your presentation unforgettable.

Amazon Business Strategies To Gain Competitive Advantage KPI Dashboard To Track Amazon Background PDF
This slide provides information regarding dashboard to monitor Amazon performance. The KPIs include tracking of product sales, conversion rate, advertising spends, session, organic sales, etc. Do you have to make sure that everyone on your team knows about any specific topic I yes, then you should give Amazon Business Strategies To Gain Competitive Advantage KPI Dashboard To Track Amazon Background PDF a try. Our experts have put a lot of knowledge and effort into creating this impeccable Amazon Business Strategies To Gain Competitive Advantage KPI Dashboard To Track Amazon Background PDF. You can use this template for your upcoming presentations, as the slides are perfect to represent even the tiniest detail. You can download these templates from the Slidegeeks website and these are easy to edit. So grab these today.

Amazon Strategic Growth Initiative On Global Scale KPI Dashboard To Track Amazon Performance Themes PDF
This slide provides information regarding dashboard to monitor Amazon performance. The KPIs include tracking of product sales, conversion rate, advertising spends, session, organic sales, etc. Do you have to make sure that everyone on your team knows about any specific topic I yes, then you should give Amazon Strategic Growth Initiative On Global Scale KPI Dashboard To Track Amazon Performance Themes PDF a try. Our experts have put a lot of knowledge and effort into creating this impeccable Amazon Strategic Growth Initiative On Global Scale KPI Dashboard To Track Amazon Performance Themes PDF. You can use this template for your upcoming presentations, as the slides are perfect to represent even the tiniest detail. You can download these templates from the Slidegeeks website and these are easy to edit. So grab these today.

Creating New Product Launch Campaign Strategy Dashboard To Measure Sales Rep Performance Introduction PDF
This slide illustrates sales representative performance measurement dashboard with key metrics such as average first contact resolution rate, occupancy rate, NPS and top agents by solved tickets. Make sure to capture your audiences attention in your business displays with our gratis customizable Creating New Product Launch Campaign Strategy Dashboard To Measure Sales Rep Performance Introduction PDF. These are great for business strategies, office conferences, capital raising or task suggestions. If you desire to acquire more customers for your tech business and ensure they stay satisfied, create your own sales presentation with these plain slides.

Kpi Dashboard To Evaluate The New Retail Store Performance Opening Retail Store In Untapped Download PDF
The following slide showcases key performance indicator dashboard which can be used to measure the performance of new store. It covers information about net sales, sales per square foot, average basket size ABS, total visitors count etc.Create an editable Kpi Dashboard To Evaluate The New Retail Store Performance Opening Retail Store In Untapped Download PDF that communicates your idea and engages your audience. Whether you are presenting a business or an educational presentation, pre-designed presentation templates help save time. Kpi Dashboard To Evaluate The New Retail Store Performance Opening Retail Store In Untapped Download PDF is highly customizable and very easy to edit, covering many different styles from creative to business presentations. Slidegeeks has creative team members who have crafted amazing templates. So, go and get them without any delay.

Sales Dashboard With Average Real Estate Size And Inquiry Referrals Ppt PowerPoint Presentation Gallery Slides PDF
This slide showcases property dashboard to keep track of units sold by each agent and profitability of the business. It includes information about advertised and actual sales, monthly inventory, rented by agent, etc. Showcasing this set of slides titled Sales Dashboard With Average Real Estate Size And Inquiry Referrals Ppt PowerPoint Presentation Gallery Slides PDF. The topics addressed in these templates are Month Inventory. All the content presented in this PPT design is completely editable. Download it and make adjustments in color, background, font etc. as per your unique business setting.

Customer Deal Tracking In Sales Pipeline Dashboard Managing Sales Pipeline Health Formats PDF
This slide covers information regarding dashboard for tracking various customer deals in sales pipeline. Take your projects to the next level with our ultimate collection of Customer Deal Tracking In Sales Pipeline Dashboard Managing Sales Pipeline Health Formats PDF. Slidegeeks has designed a range of layouts that are perfect for representing task or activity duration, keeping track of all your deadlines at a glance. Tailor these designs to your exact needs and give them a truly corporate look with your own brand colors they well make your projects stand out from the rest.
Nft Transaction Analysis And Tracking Dashboard Ppt PowerPoint Presentation File Layouts PDF
This slide demonstrates the dashboard for tracking NFT transactions and analysis based on daily sales, ETH volume collections, and so on. Present like a pro with Nft Transaction Analysis And Tracking Dashboard Ppt PowerPoint Presentation File Layouts PDF Create beautiful presentations together with your team, using our easy to use presentation slides. Share your ideas in real time and make changes on the fly by downloading our templates. So whether you are in the office, on the go, or in a remote location, you can stay in sync with your team and present your ideas with confidence. With Slidegeeks presentation got a whole lot easier. Grab these presentations today.
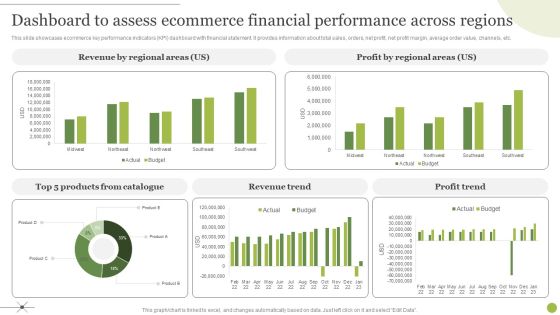
Managing E Commerce Business Accounting Dashboard To Assess Ecommerce Financial Performance Across Regions Graphics PDF
This slide showcases ecommerce key performance indicators KPI dashboard with financial statement. It provides information about total sales, orders, net profit, net profit margin, average order value, channels, etc. Do you have to make sure that everyone on your team knows about any specific topic I yes, then you should give Managing E Commerce Business Accounting Dashboard To Assess Ecommerce Financial Performance Across Regions Graphics PDF a try. Our experts have put a lot of knowledge and effort into creating this impeccable Managing E Commerce Business Accounting Dashboard To Assess Ecommerce Financial Performance Across Regions Graphics PDF. You can use this template for your upcoming presentations, as the slides are perfect to represent even the tiniest detail. You can download these templates from the Slidegeeks website and these are easy to edit. So grab these today.

Agile Team Member Customer Relationship Management Dashboard With Deals Funnel Mockup PDF
This slide illustrates graphical representation of CRM sales team member data. It includes pipeline, business components and activity level, categories etc. Pitch your topic with ease and precision using this Agile Team Member Customer Relationship Management Dashboard With Deals Funnel Mockup PDF. This layout presents information on Funnel Of Deals, Sent Campaigns Emails, Sales Chart. It is also available for immediate download and adjustment. So, changes can be made in the color, design, graphics or any other component to create a unique layout.

Dashboard To Evaluate Marketing Campaign Performance Ecommerce Marketing Plan To Enhance Microsoft PDF
This slide represents dashboard to evaluate marketing campaign performance. It includes revenue, sales, total orders, order value, conversion rate etc.Do you have to make sure that everyone on your team knows about any specific topic I yes, then you should give Dashboard To Evaluate Marketing Campaign Performance Ecommerce Marketing Plan To Enhance Microsoft PDF a try. Our experts have put a lot of knowledge and effort into creating this impeccable Dashboard To Evaluate Marketing Campaign Performance Ecommerce Marketing Plan To Enhance Microsoft PDF. You can use this template for your upcoming presentations, as the slides are perfect to represent even the tiniest detail. You can download these templates from the Slidegeeks website and these are easy to edit. So grab these today.
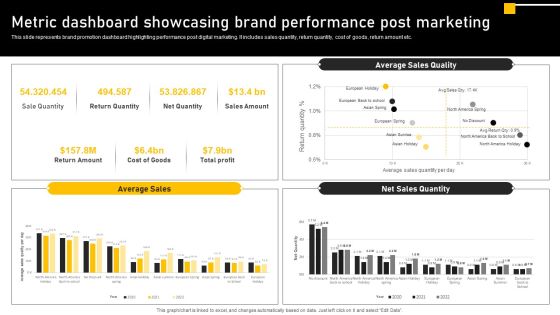
Online Ads Strategic Plan For Effective Marketing Metric Dashboard Showcasing Brand Performance Post Themes PDF
This slide represents brand promotion dashboard highlighting performance post digital marketing. It includes sales quantity, return quantity, cost of goods, return amount etc. Do you have to make sure that everyone on your team knows about any specific topic I yes, then you should give Online Ads Strategic Plan For Effective Marketing Metric Dashboard Showcasing Brand Performance Post Themes PDF a try. Our experts have put a lot of knowledge and effort into creating this impeccable Online Ads Strategic Plan For Effective Marketing Metric Dashboard Showcasing Brand Performance Post Themes PDF. You can use this template for your upcoming presentations, as the slides are perfect to represent even the tiniest detail. You can download these templates from the Slidegeeks website and these are easy to edit. So grab these today.

Coffeehouse Promotion Techniques To Boost Revenue Dashboard To Track Sales Expenses Restaurant Clipart PDF
This slide showcases dashboard that can help restaurant to keep track of sales and expenses. Its key elements are total sales, average transactions, non labor margin, expenses by category etc. If your project calls for a presentation, then Slidegeeks is your go-to partner because we have professionally designed, easy-to-edit templates that are perfect for any presentation. After downloading, you can easily edit Coffeehouse Promotion Techniques To Boost Revenue Dashboard To Track Sales Expenses Restaurant Clipart PDF and make the changes accordingly. You can rearrange slides or fill them with different images. Check out all the handy templates
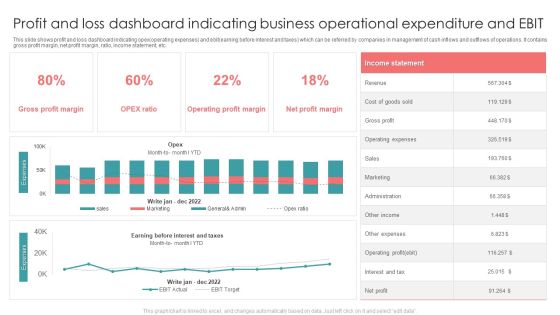
Profit And Loss Dashboard Indicating Business Operational Expenditure And EBIT Formats PDF
This slide shows profit and loss dashboard indicating opex operating expenses and ebit earning before interest and taxes which can be referred by companies in management of cash inflows and outflows of operations. It contains gross profit margin, net profit margin, ratio, income statement, etc. Showcasing this set of slides titled Profit And Loss Dashboard Indicating Business Operational Expenditure And EBIT Formats PDF. The topics addressed in these templates are Revenue, Gross Profit, Sales. All the content presented in this PPT design is completely editable. Download it and make adjustments in color, background, font etc. as per your unique business setting.

Multiple Point Of Sale System Dashboard Depicting Restaurants Daily Performance Mockup PDF
This Slide represents point of sale system dashboard depicting restaurants daily performance which can be beneficial for eateries to manage their regular sales. It includes information about sales, expenditure, menu, customer data, bookings and reports. Persuade your audience using this Multiple Point Of Sale System Dashboard Depicting Restaurants Daily Performance Mockup PDF. This PPT design covers four stages, thus making it a great tool to use. It also caters to a variety of topics including Expenditure, Sales, Customer Data. Download this PPT design now to present a convincing pitch that not only emphasizes the topic but also showcases your presentation skills.

Deploying Revitalization Strategy Enhance Product And Service Sales Reposition Dashboard With Product Slides PDF
This slide highlights product reposition dashboard which showcases product attributes, advertising awareness, market share, product commitment, repeat purchase and message association. If your project calls for a presentation, then Slidegeeks is your go to partner because we have professionally designed, easy to edit templates that are perfect for any presentation. After downloading, you can easily edit Deploying Revitalization Strategy Enhance Product And Service Sales Reposition Dashboard With Product Slides PDF and make the changes accordingly. You can rearrange slides or fill them with different images. Check out all the handy templates
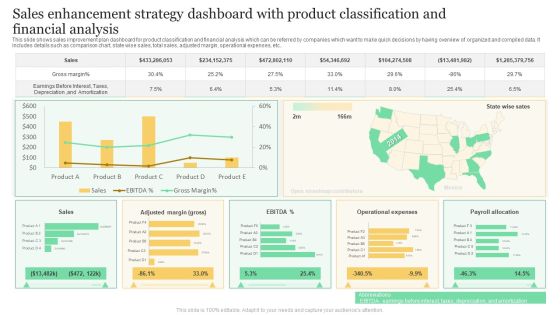
Sales Enhancement Strategy Dashboard With Product Classification And Financial Analysis Formats PDF
This slide shows sales improvement plan dashboard for product classification and financial analysis which can be referred by companies which want to make quick decisions by having overview of organized and compiled data. It includes details such as comparison chart, state wise sales, total sales, adjusted margin, operational expenses, etc. Showcasing this set of slides titled Sales Enhancement Strategy Dashboard With Product Classification And Financial Analysis Formats PDF. The topics addressed in these templates are Gross Margin, Sales, Operational Expenses. All the content presented in this PPT design is completely editable. Download it and make adjustments in color, background, font etc. as per your unique business setting.
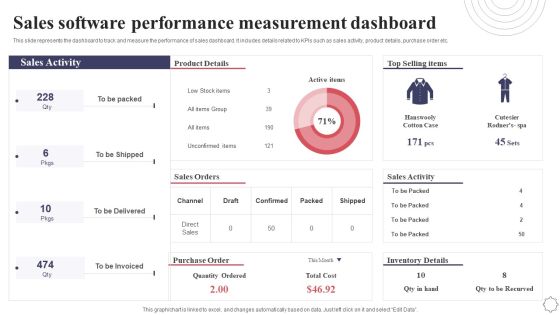
Sales Software Performance Measurement Dashboard Application Deployment Project Plan Introduction PDF
This slide represents the dashboard to track and measure the performance of sales dashboard. It includes details related to KPIs such as sales activity, product details, purchase order etc. Welcome to our selection of the Sales Software Performance Measurement Dashboard Application Deployment Project Plan Introduction PDF. These are designed to help you showcase your creativity and bring your sphere to life. Planning and Innovation are essential for any business that is just starting out. This collection contains the designs that you need for your everyday presentations. All of our PowerPoints are 100 percent editable, so you can customize them to suit your needs. This multi purpose template can be used in various situations. Grab these presentation templates today.

Strategic Plan For Enterprise Sales Software Performance Measurement Dashboard Template PDF
This slide represents the dashboard to track and measure the performance of sales dashboard. It includes details related to KPIs such as sales activity, product details, purchase order etc. Welcome to our selection of the Strategic Plan For Enterprise Sales Software Performance Measurement Dashboard Template PDF. These are designed to help you showcase your creativity and bring your sphere to life. Planning and Innovation are essential for any business that is just starting out. This collection contains the designs that you need for your everyday presentations. All of our PowerPoints are 100 percent editable, so you can customize them to suit your needs. This multi-purpose template can be used in various situations. Grab these presentation templates today.
Sales L2RM System Tracking Key Metrics Dashboard Ppt Professional Format Ideas PDF
This slide represents the dashboard for tracking the key performance indicators of sales lead to revenue management. It includes key metrics such as leads by campaign, ratings, lead generation rate, top accounts by revenue and top owners by number of accounts. Showcasing this set of slides titled Sales L2RM System Tracking Key Metrics Dashboard Ppt Professional Format Ideas PDF. The topics addressed in these templates are Leads By Campaign, Leads By Rating, Leads Generation Rate. All the content presented in this PPT design is completely editable. Download it and make adjustments in color, background, font etc. as per your unique business setting.
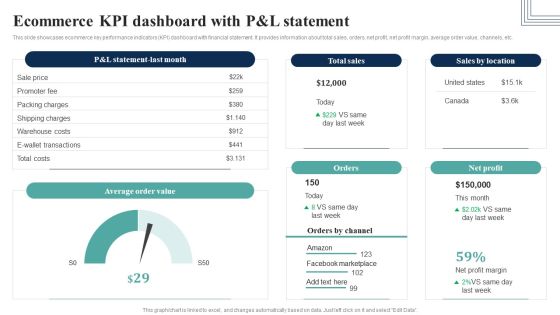
How Electronic Commerce Financial Procedure Can Be Enhanced Ecommerce Kpi Dashboard Slides PDF
This slide showcases ecommerce key performance indicators KPI dashboard with financial statement. It provides information about total sales, orders, net profit, net profit margin, average order value, channels, etc.Create an editable How Electronic Commerce Financial Procedure Can Be Enhanced Ecommerce Kpi Dashboard Slides PDF that communicates your idea and engages your audience. Whether you are presenting a business or an educational presentation, pre-designed presentation templates help save time. How Electronic Commerce Financial Procedure Can Be Enhanced Ecommerce Kpi Dashboard Slides PDF is highly customizable and very easy to edit, covering many different styles from creative to business presentations. Slidegeeks has creative team members who have crafted amazing templates. So, go and get them without any delay.
Providing Efficient Client Services Kpi Dashboard For Tracking Customer Retention Diagrams PDF
This slide covers the dashboard for analyzing customer loyalty with metrics such as NPS, loyal customer rate, premium users, CLV, customer churn, revenue churn, net retention, MRR growth, etc. Take your projects to the next level with our ultimate collection of Providing Efficient Client Services Kpi Dashboard For Tracking Customer Retention Diagrams PDF. Slidegeeks has designed a range of layouts that are perfect for representing task or activity duration, keeping track of all your deadlines at a glance. Tailor these designs to your exact needs and give them a truly corporate look with your own brand colors they will make your projects stand out from the rest.

Cognitive Analytics Strategy And Techniques Tracking Customer Data Insights Dashboard Demonstration PDF
This slide provides information regarding customer data insights dashboard in terms of average churn risk, segments, high earner, highly engaged customers, etc. Take your projects to the next level with our ultimate collection of Cognitive Analytics Strategy And Techniques Tracking Customer Data Insights Dashboard Demonstration PDF. Slidegeeks has designed a range of layouts that are perfect for representing task or activity duration, keeping track of all your deadlines at a glance. Tailor these designs to your exact needs and give them a truly corporate look with your own brand colors they will make your projects stand out from the rest.

Real Estate Business Monthly Sales Forecast Dashboard Ppt Layouts Grid PDF
This slide represents the dashboard showing the data related to sales forecasting for the real estate business. It shows details related to the set target, sales targets won, open and forecasted and also shows the graph representing the sales pipeline for the year. Showcasing this set of slides titled Real Estate Business Monthly Sales Forecast Dashboard Ppt Layouts Grid PDF. The topics addressed in these templates are Next Billing Data, Pipeline, Current Fiscal Year. All the content presented in this PPT design is completely editable. Download it and make adjustments in color, background, font etc. as per your unique business setting.

Cloud Kitchen Business Financials Management Dashboard Analyzing Global Commissary Rules PDF
This slide presents a dashboard for tracking and managing business income and expenditure. It includes key components such as method of payment, voids, discounts, refunds, top menu items, cost by staff type and percentage of revenue.Get a simple yet stunning designed Cloud Kitchen Business Financials Management Dashboard Analyzing Global Commissary Rules PDF. It is the best one to establish the tone in your meetings. It is an excellent way to make your presentations highly effective. So, download this PPT today from Slidegeeks and see the positive impacts. Our easy-to-edit Cloud Kitchen Business Financials Management Dashboard Analyzing Global Commissary Rules PDF can be your go-to option for all upcoming conferences and meetings. So, what are you waiting for Grab this template today.

Financial Services Organization Monthly Sales Forecast Dashboard Ppt Summary Slideshow PDF
This slide shows the dashboard representing data related to monthly sales forecast of the organization offering financial services to its clients. It includes information related to forecasted data, sales forecast, total sales, forecast projection etc. Showcasing this set of slides titled Financial Services Organization Monthly Sales Forecast Dashboard Ppt Summary Slideshow PDF. The topics addressed in these templates are Forecasts Sales, Time Series View, Forecast Projection. All the content presented in this PPT design is completely editable. Download it and make adjustments in color, background, font etc. as per your unique business setting.

Optimizing Production Process Smart Manufacturing Dashboard To Track Production Diagrams PDF
This slide represents smart manufacturing dashboard. It covers production volume, downtime causes, top product sold item, sales revenue, active machinery etc. If you are looking for a format to display your unique thoughts, then the professionally designed Optimizing Production Process Smart Manufacturing Dashboard To Track Production Diagrams PDF is the one for you. You can use it as a Google Slides template or a PowerPoint template. Incorporate impressive visuals, symbols, images, and other charts. Modify or reorganize the text boxes as you desire. Experiment with shade schemes and font pairings. Alter, share or cooperate with other people on your work. Download Optimizing Production Process Smart Manufacturing Dashboard To Track Production Diagrams PDF and find out how to give a successful presentation. Present a perfect display to your team and make your presentation unforgettable.

Successful Risk Administration KPI Dashboard To Track Effectiveness Of Real Estate Business Template PDF
The following slide exhibits key performance indicator KPI dashboard which can be used to measure the financial performance of the real estate company. It covers various kpis such as sales vs target per agent, top 10 projects, top 5 agencies etc. If your project calls for a presentation, then Slidegeeks is your go-to partner because we have professionally designed, easy-to-edit templates that are perfect for any presentation. After downloading, you can easily edit Successful Risk Administration KPI Dashboard To Track Effectiveness Of Real Estate Business Template PDF and make the changes accordingly. You can rearrange slides or fill them with different images. Check out all the handy templates.

Business To Business Digital Channel Management B2B Sales Performance Tracking Dashboard Template PDF
This slide represents metric dashboard to track sales performance on e-commerce website. It cover performance indicators such as sales breakdown, order breakdown, recurring sales etc. Take your projects to the next level with our ultimate collection of Business To Business Digital Channel Management B2B Sales Performance Tracking Dashboard Template PDF. Slidegeeks has designed a range of layouts that are perfect for representing task or activity duration, keeping track of all your deadlines at a glance. Tailor these designs to your exact needs and give them a truly corporate look with your own brand colors they will make your projects stand out from the rest.

KPI Dashboard To Evaluate Growth In Sales Funnel Reporting Topics PDF
This slide represents the KPI dashboard to measure sales pipeline reporting for increasing customer conversion rate. It includes activity by representative, forecast by month and monthly growth. Pitch your topic with ease and precision using this KPI Dashboard To Evaluate Growth In Sales Funnel Reporting Topics PDF. This layout presents information on Pipeline Requirement, Key Activities, Pipeline Closed Date. It is also available for immediate download and adjustment. So, changes can be made in the color, design, graphics or any other component to create a unique layout.

Marketing And Sales Qualified Lead MQL Dashboard Of Telecom Industry Ppt Outline PDF
This slide represents dashboard showing marketing and sales qualified leads generation for telecom industry. It shows details related to average daily opportunities by role, by representatives etc. Presenting Marketing And Sales Qualified Lead MQL Dashboard Of Telecom Industry Ppt Outline PDF to dispense important information. This template comprises one stages. It also presents valuable insights into the topics including Average Daily, Opportunities By Role, Select Users, Committed Deals. This is a completely customizable PowerPoint theme that can be put to use immediately. So, download it and address the topic impactfully.
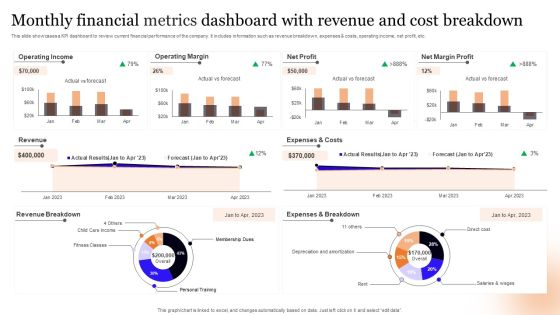
Monthly Financial Metrics Dashboard With Revenue And Cost Breakdown Information PDF
This slide showcases a KPI dashboard to review current financial performance of the company. It includes information such as revenue breakdown, expenses and costs, operating income, net profit, etc. Pitch your topic with ease and precision using this Monthly Financial Metrics Dashboard With Revenue And Cost Breakdown Information PDF. This layout presents information on Operating Income, Operating Margin, Net Profit. It is also available for immediate download and adjustment. So, changes can be made in the color, design, graphics or any other component to create a unique layout.

Dashboard To Track Product Sales Performance Implementing Focus Strategy To Improve Designs PDF
This slide showcases dashboard that can help organization to analyse the sales of product after entering into niche market. Its key elements are sales, sales target, sales growth, sales by channel, inventory days outstanding etc.Take your projects to the next level with our ultimate collection of Dashboard To Track Product Sales Performance Implementing Focus Strategy To Improve Designs PDF. Slidegeeks has designed a range of layouts that are perfect for representing task or activity duration, keeping track of all your deadlines at a glance. Tailor these designs to your exact needs and give them a truly corporate look with your own brand colors they all make your projects stand out from the rest.

Strategic Ecommerce Plan For B2B Enterprises B2b Sales Performance Tracking Dashboard Demonstration PDF
This slide represents metric dashboard to track sales performance on e-commerce website. It cover performance indicators such as sales breakdown, order breakdown, recurring sales etc. Slidegeeks has constructed Strategic Ecommerce Plan For B2B Enterprises B2b Sales Performance Tracking Dashboard Demonstration PDF after conducting extensive research and examination. These presentation templates are constantly being generated and modified based on user preferences and critiques from editors. Here, you will find the most attractive templates for a range of purposes while taking into account ratings and remarks from users regarding the content. This is an excellent jumping-off point to explore our content and will give new users an insight into our top-notch PowerPoint Templates.

Automobile Company Actual And Forecasted Monthly Sales Dashboard Ppt Infographic Template Aids PDF
This slide shows the dashboard for forecasting the sales of an automobile company for the current month. It represents details related to revenue by pipeline, new deals, sales forecast, revenue goal attainment by owner for the current month and pipeline coverage by next month. Showcasing this set of slides titled Automobile Company Actual And Forecasted Monthly Sales Dashboard Ppt Infographic Template Aids PDF. The topics addressed in these templates are Forecast Month, Revenue Goal Attainment, Revenue Goal Attainment. All the content presented in this PPT design is completely editable. Download it and make adjustments in color, background, font etc. as per your unique business setting.
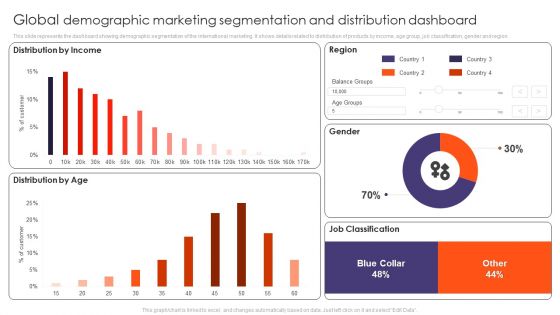
Global Demographic Marketing Segmentation And Distribution Dashboard Ppt Gallery Tips PDF
This slide represents the dashboard showing demographic segmentation of the international marketing. It shows details related to distribution of products by income, age group, job classification, gender and region. Pitch your topic with ease and precision using this Global Demographic Marketing Segmentation And Distribution Dashboard Ppt Gallery Tips PDF. This layout presents information on Distribution Income, Distribution Age, Region, Gender, Job Classification. It is also available for immediate download and adjustment. So, changes can be made in the color, design, graphics or any other component to create a unique layout.

Marketing And Operation Planning Dashboard To Drive Better Performance Graphics PDF
This slide covers sales and operations planning dashboard to improve performance. It involves bookings plan, year on year growth, bookings plan per year and total growth and sales made by sales manager. Showcasing this set of slides titled Marketing And Operation Planning Dashboard To Drive Better Performance Graphics PDF. The topics addressed in these templates are Sales Manager, Growth Made, Bookings Plan By Year. All the content presented in this PPT design is completely editable. Download it and make adjustments in color, background, font etc. as per your unique business setting.

E Commerce Operations In B2b B2b Ecommerce Dashboard To Track Website Infographics PDF
This slide represents metric dashboard to track and analyze b2b ecommerce website performance. It covers total user visits, sales, average return per user etc. Find a pre designed and impeccable E Commerce Operations In B2b B2b Ecommerce Dashboard To Track Website Infographics PDF. The templates can ace your presentation without additional effort. You can download these easy to edit presentation templates to make your presentation stand out from others. So, what are you waiting for Download the template from Slidegeeks today and give a unique touch to your presentation.

KPI Dashboard To Track Effectiveness Of Real Estate Business Performance Guidelines PDF
The following slide exhibits key performance indicator KPI dashboard which can be used to measure the financial performance of the real estate company. It covers various kpis such as sales vs target per agent, top 10 projects, top 5 agencies etc.Deliver an awe inspiring pitch with this creative KPI Dashboard To Track Effectiveness Of Real Estate Business Performance Guidelines PDF bundle. Topics like Top Projects, Sales Amount, Sales Amount can be discussed with this completely editable template. It is available for immediate download depending on the needs and requirements of the user.

Executing Risk Mitigation KPI Dashboard To Track Effectiveness Of Real Estate Rules PDF
The following slide exhibits key performance indicator KPI dashboard which can be used to measure the financial performance of the real estate company. It covers various KPIs such as sales vs target per agent, top 10 projects, top 5 agencies etc. Find highly impressive Executing Risk Mitigation KPI Dashboard To Track Effectiveness Of Real Estate Rules PDF on Slidegeeks to deliver a meaningful presentation. You can save an ample amount of time using these presentation templates. No need to worry to prepare everything from scratch because Slidegeeks experts have already done a huge research and work for you. You need to download Executing Risk Mitigation Kpi Dashboard To Track Effectiveness Of Real Estate Rules PDF for your upcoming presentation. All the presentation templates are 100 percent editable and you can change the color and personalize the content accordingly. Download now.
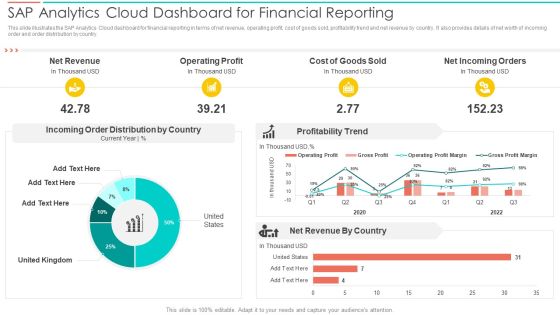
SAC Planning And Implementation SAP Analytics Cloud Dashboard For Financial Reporting Introduction PDF
This slide illustrates the SAP Analytics Cloud dashboard for financial reporting in terms of net revenue, operating profit, cost of goods sold, profitability trend and net revenue by country. It also provides details of net worth of incoming order and order distribution by country. Deliver an awe inspiring pitch with this creative SAC Planning And Implementation SAP Analytics Cloud Dashboard For Financial Reporting Introduction PDF bundle. Topics like Net Revenue, Operating Profit, Cost Goods Sold can be discussed with this completely editable template. It is available for immediate download depending on the needs and requirements of the user.

Channel Sales Taking Your Product To Market Channel Sales Plan Financials Dashboard Graphics PDF
Presenting this set of slides with name channel sales taking your product to market channel sales plan financials dashboard graphics pdf. The topics discussed in these slides are distribution, sales, representative, locations, revenue. This is a completely editable PowerPoint presentation and is available for immediate download. Download now and impress your audience.

Dashboard Highlighting CRM Ticketing Tool Operations Ppt PowerPoint Presentation File Professional PDF
This slide illustrates dashboard showcasing customer relationship management ticketing tool operations. It provides information about satisfaction, new tickets, chats, calls, invoicing, tech support, sales, engineers, replies, etc. Want to ace your presentation in front of a live audience Our Dashboard Highlighting CRM Ticketing Tool Operations Ppt PowerPoint Presentation File Professional PDF can help you do that by engaging all the users towards you. Slidegeeks experts have put their efforts and expertise into creating these impeccable powerpoint presentations so that you can communicate your ideas clearly. Moreover, all the templates are customizable, and easy to edit and downloadable. Use these for both personal and commercial use.

Implementing Advanced Service Help Desk Administration Program Dashboard Highlighting CRM Ticketing Tool Operations Mockup PDF
This slide illustrates dashboard showcasing customer relationship management ticketing tool operations. It provides information about satisfaction, new tickets, chats, calls, invoicing, tech support, sales, engineers, replies, etc. Want to ace your presentation in front of a live audience Our Implementing Advanced Service Help Desk Administration Program Dashboard Highlighting CRM Ticketing Tool Operations Mockup PDF can help you do that by engaging all the users towards you.. Slidegeeks experts have put their efforts and expertise into creating these impeccable powerpoint presentations so that you can communicate your ideas clearly. Moreover, all the templates are customizable, and easy-to-edit and downloadable. Use these for both personal and commercial use.

Net Banking Channel And Service Management Online Banking Dashboard To Track Transactions Professional PDF
This slide represents online banking dashboard for tracking financial transactions. It includes account balance, saving account, current account, income, expenses etc. Boost your pitch with our creative Net Banking Channel And Service Management Online Banking Dashboard To Track Transactions Professional PDF. Deliver an awe inspiring pitch that will mesmerize everyone. Using these presentation templates you will surely catch everyones attention. You can browse the ppts collection on our website. We have researchers who are experts at creating the right content for the templates. So you dont have to invest time in any additional work. Just grab the template now and use them.

Introduction To Artificial Intelligence In Operation Management Industry Customer Service Dashboard Through AI Topics PDF
The following slide highlights the customer service dashboard that shows the use of AI in customer satisfaction. Slidegeeks is here to make your presentations a breeze with Introduction To Artificial Intelligence In Operation Management Industry Customer Service Dashboard Through AI Topics PDF With our easy-to-use and customizable templates, you can focus on delivering your ideas rather than worrying about formatting. With a variety of designs to choose from, you are sure to find one that suits your needs. And with animations and unique photos, illustrations, and fonts, you can make your presentation pop. So whether you are giving a sales pitch or presenting to the board, make sure to check out Slidegeeks first.
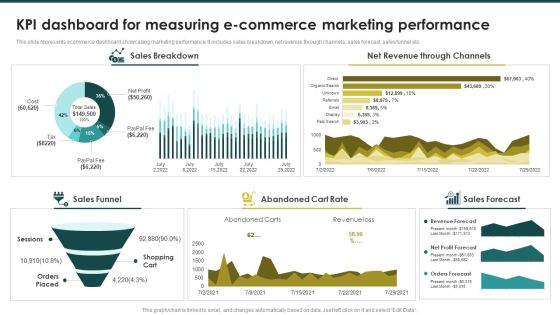
KPI Dashboard For Measuring Ecommerce Marketing Ecommerce Marketing Plan To Enhance Brochure PDF
This slide represents ecommerce dashboard showcasing marketing performance. It includes sales breakdown, net revenue through channels, sales forecast, sales funnel etc.Find highly impressive KPI Dashboard For Measuring Ecommerce Marketing Ecommerce Marketing Plan To Enhance Brochure PDF on Slidegeeks to deliver a meaningful presentation. You can save an ample amount of time using these presentation templates. No need to worry to prepare everything from scratch because Slidegeeks experts have already done a huge research and work for you. You need to download KPI Dashboard For Measuring Ecommerce Marketing Ecommerce Marketing Plan To Enhance Brochure PDF for your upcoming presentation. All the presentation templates are 100precent editable and you can change the color and personalize the content accordingly. Download now.

Sales Operations Metrics Dashboard Example Ppt PowerPoint Presentation Gallery Inspiration PDF
Presenting this set of slides with name sales operations metrics dashboard example ppt powerpoint presentation gallery inspiration pdf. The topics discussed in these slides are sales, marketing, expenses. This is a completely editable PowerPoint presentation and is available for immediate download. Download now and impress your audience.

Optimizing The Marketing Operations To Drive Efficiencies Marketing Management Dashboard Sales Mockup Guidelines PDF
Deliver an awe inspiring pitch with this creative optimizing the marketing operations to drive efficiencies marketing management dashboard sales mockup guidelines pdf bundle. Topics like customers, revenue, profit, sales can be discussed with this completely editable template. It is available for immediate download depending on the needs and requirements of the user.
Planning Transnational Technique To Improve International Scope Dashboard Tracking Post Expansion Revenue Structure PDF
This slide covers the dashboard for analyzing fast food business sales by location. It includes KPIs such as the companys revenue by location, by type, top 5 expenses by account, top 5 expenses by department, cost of revenue year to date, etc. If your project calls for a presentation, then Slidegeeks is your go to partner because we have professionally designed, easy to edit templates that are perfect for any presentation. After downloading, you can easily edit Planning Transnational Technique To Improve International Scope Dashboard Tracking Post Expansion Revenue Structure PDF and make the changes accordingly. You can rearrange slides or fill them with different images. Check out all the handy templates
SFA Dashboard To Track Performance Ppt PowerPoint Presentation Icon Example File PDF
This Slide visually represents sales force automation dashboard to track performance which can be utilized by marketing managers to streamline the process of automated selling. It includes information about sales pipeline, competitors, opportunities, key competitors, etc. Pitch your topic with ease and precision using this sfa dashboard to track performance ppt powerpoint presentation icon example file pdf. This layout presents information on sales pipeline, sales pipeline by sales rep, key competitors, forecast by month, key opportunities. It is also available for immediate download and adjustment. So, changes can be made in the color, design, graphics or any other component to create a unique layout.
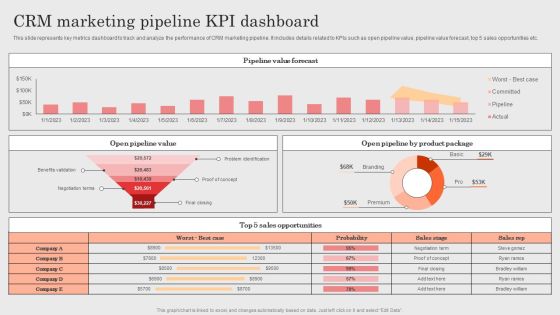
Integrating CRM Solution To Acquire Potential Customers CRM Marketing Pipeline KPI Dashboard Background PDF
This slide represents key metrics dashboard to track and analyze the performance of CRM marketing pipeline. It includes details related to KPIs such as open pipeline value, pipeline value forecast, top 5 sales opportunities etc. Crafting an eye catching presentation has never been more straightforward. Let your presentation shine with this tasteful yet straightforward Integrating CRM Solution To Acquire Potential Customers CRM Marketing Pipeline KPI Dashboard Background PDF template. It offers a minimalistic and classy look that is great for making a statement. The colors have been employed intelligently to add a bit of playfulness while still remaining professional. Construct the ideal Integrating CRM Solution To Acquire Potential Customers CRM Marketing Pipeline KPI Dashboard Background PDF that effortlessly grabs the attention of your audience. Begin now and be certain to wow your customers.
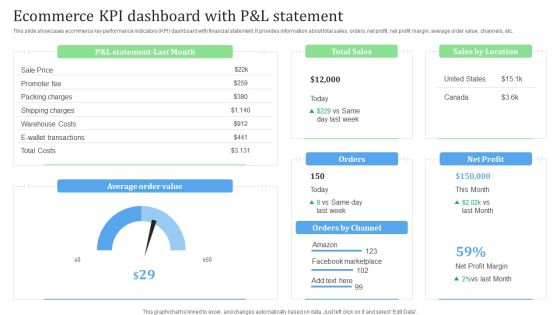
Ecommerce KPI Dashboard With P And L Statement Financial Management Strategies Background PDF
This slide showcases ecommerce key performance indicators KPI dashboard with financial statement. It provides information about total sales, orders, net profit, net profit margin, average order value, channels, etc.Whether you have daily or monthly meetings, a brilliant presentation is necessary. Ecommerce KPI Dashboard With P And L Statement Financial Management Strategies Background PDF can be your best option for delivering a presentation. Represent everything in detail using Ecommerce KPI Dashboard With P And L Statement Financial Management Strategies Background PDF and make yourself stand out in meetings. The template is versatile and follows a structure that will cater to your requirements. All the templates prepared by Slidegeeks are easy to download and edit. Our research experts have taken care of the corporate themes as well. So, give it a try and see the results.

Degree Of Operational Leverage Dashboard With Income Statement Ppt Infographics Layout PDF
This slide illustrates graphical representation of company revenue and income statement. It includes monthly revenue, revenue by products, revenue by country etc. Pitch your topic with ease and precision using this Degree Of Operational Leverage Dashboard With Income Statement Ppt Infographics Layout PDF. This layout presents information on Monthly Revenue, Income Statement, Product. It is also available for immediate download and adjustment. So, changes can be made in the color, design, graphics or any other component to create a unique layout.

Performance Measurement KPI Dashboard For Fintech Firm Investment In Latest Technology To Ensure Portrait PDF
Following slide portrays performance measurement dashboard for FinTech companies with KPIs namely available cash, cash flow, ROA, working capital ratio, days sales outstanding and days payable outstanding.Whether you have daily or monthly meetings, a brilliant presentation is necessary. Performance Measurement KPI Dashboard For Fintech Firm Investment In Latest Technology To Ensure Portrait PDF can be your best option for delivering a presentation. Represent everything in detail using Performance Measurement KPI Dashboard For Fintech Firm Investment In Latest Technology To Ensure Portrait PDF and make yourself stand out in meetings. The template is versatile and follows a structure that will cater to your requirements. All the templates prepared by Slidegeeks are easy to download and edit. Our research experts have taken care of the corporate themes as well. So, give it a try and see the results.
