Employee Turnover Dashboard
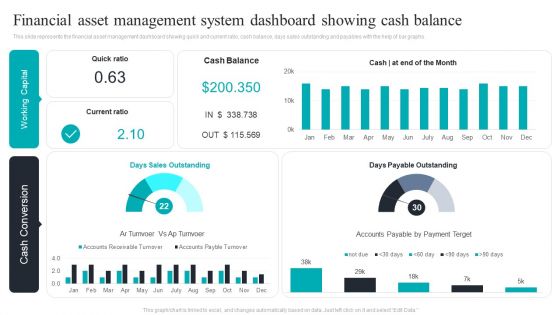
Financial Asset Management System Dashboard Showing Cash Balance Download PDF
This slide represents the financial asset management dashboard showing quick and current ratio, cash balance, days sales outstanding and payables with the help of bar graphs. Pitch your topic with ease and precision using this Financial Asset Management System Dashboard Showing Cash Balance Download PDF. This layout presents information on Financial Asset, Management System, Dashboard Showing, Cash Balance. It is also available for immediate download and adjustment. So, changes can be made in the color, design, graphics or any other component to create a unique layout.

Manufactured Products Sales Performance Monitoring Dashboard Information PDF
This slide shows the dashboard the data related to the sales performance of the products manufactured by the organization in order to effectively measure and monitor the performance of the sales team. It shows details related to revenue generated and units sold etc.Pitch your topic with ease and precision using this Manufactured Products Sales Performance Monitoring Dashboard Information PDF. This layout presents information on Monthly Revenue, Manufactured Products, Sales Performance Monitoring. It is also available for immediate download and adjustment. So, changes can be made in the color, design, graphics or any other component to create a unique layout.
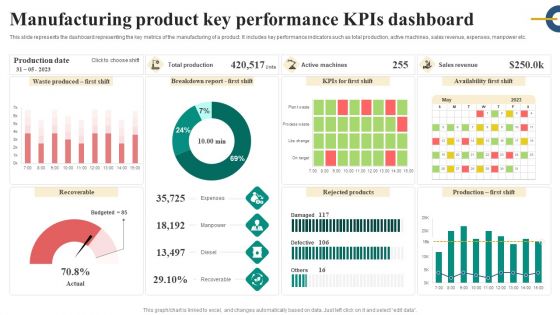
Manufacturing Product Key Performance Kpis Dashboard Inspiration PDF
This slide represents the dashboard representing the key metrics of the manufacturing of a product. It includes key performance indicators such as total production, active machines, sales revenue, expenses, manpower etc. Showcasing this set of slides titled Manufacturing Product Key Performance Kpis Dashboard Inspiration PDF. The topics addressed in these templates are Expenses, Manpower, Diesel, Recoverable. All the content presented in this PPT design is completely editable. Download it and make adjustments in color, background, font etc. as per your unique business setting.
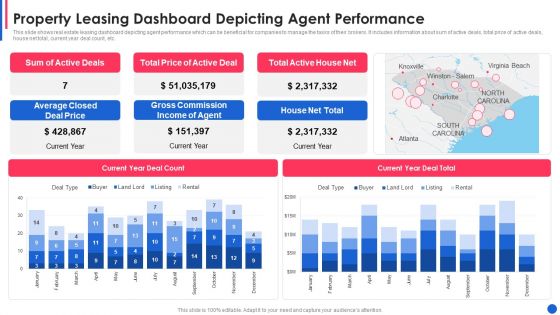
Property Leasing Dashboard Depicting Agent Performance Guidelines PDF
This slide shows real estate leasing dashboard depicting agent performance which can be beneficial for companies to manage the tasks of their brokers. It includes information about sum of active deals, total price of active deals, house net total, current year deal count, etc.Pitch your topic with ease and precision using this property leasing dashboard depicting agent performance guidelines pdf This layout presents information on average closed deal price, gross commission income, total active house net It is also available for immediate download and adjustment. So, changes can be made in the color, design, graphics or any other component to create a unique layout.

Agile Crystal Techniques Crystal Methodology Implementation Dashboard Themes PDF
This slide represents the crystal methodology implementation dashboard by covering annual gross revenue, product type comparison, sales rep comparison and top 10 clients. Deliver an awe inspiring pitch with this creative Agile Crystal Techniques Crystal Methodology Implementation Dashboard Themes PDF bundle. Topics like Monthly Sales Trend, Sales Rep Comparison, Product Type Comparison can be discussed with this completely editable template. It is available for immediate download depending on the needs and requirements of the user.
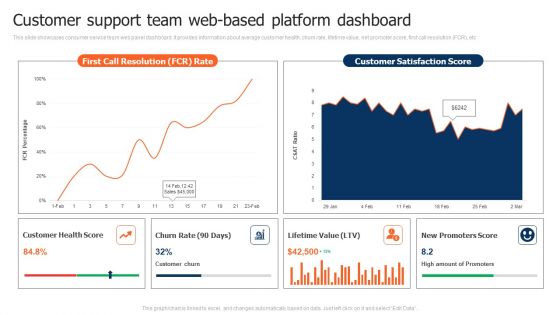
Customer Support Team Web Based Platform Dashboard Demonstration PDF
This slide showcases consumer service team web panel dashboard. It provides information about average customer health, churn rate, lifetime value, net promoter score, first call resolution FCR, etc. Pitch your topic with ease and precision using this Customer Support Team Web Based Platform Dashboard Demonstration PDF. This layout presents information on Churn Rate, Lifetime Value, Customer Health Score. It is also available for immediate download and adjustment. So, changes can be made in the color, design, graphics or any other component to create a unique layout.
Marketing And Operations Dashboard For Performance Management Icons PDF
This slide covers sales and operation dashboard for performance management. It involves details such as number of new buyers, sales revenue, average revenue per unit etc. Pitch your topic with ease and precision using this Marketing And Operations Dashboard For Performance Management Icons PDF. This layout presents information on Average Revenue Per Unit, Customer Acquisition Cost, Customer Lifetime Value. It is also available for immediate download and adjustment. So, changes can be made in the color, design, graphics or any other component to create a unique layout.
Marketing And Operations Dashboard For Ecommerce Business Icons PDF
This slide covers sales and operations dashboard for ecommerce business. It involves details such as total sales generated, number of brands, total revenue generated, number of units sold and gender and age range breakdown. Showcasing this set of slides titled Marketing And Operations Dashboard For Ecommerce Business Icons PDF. The topics addressed in these templates are Total Sales Generated, Total Revenue Generated, Returning Consumers. All the content presented in this PPT design is completely editable. Download it and make adjustments in color, background, font etc. as per your unique business setting.

B2B Ecommerce Dashboard To Track Website Performance Designs PDF
This slide represents metric dashboard to track and analyze b2b ecommerce website performance. It covers total user visits, sales, average return per user etc. Presenting this PowerPoint presentation, titled B2B Ecommerce Dashboard To Track Website Performance Designs PDF, with topics curated by our researchers after extensive research. This editable presentation is available for immediate download and provides attractive features when used. Download now and captivate your audience. Presenting this B2B Ecommerce Dashboard To Track Website Performance Designs PDF. Our researchers have carefully researched and created these slides with all aspects taken into consideration. This is a completely customizable B2B Ecommerce Dashboard To Track Website Performance Designs PDF that is available for immediate downloading. Download now and make an impact on your audience. Highlight the attractive features available with our PPTs.

Annual Business Performance Assessment And Evaluation Dashboard Brochure PDF
This slide represents a dashboard highlighting performance of a business concern in various segments. It includes average revenue per unit, customer lifetime value, customer acquisition cost, etc. Showcasing this set of slides titled Annual Business Performance Assessment And Evaluation Dashboard Brochure PDF. The topics addressed in these templates are Profit, Sales Revenue, New Customer. All the content presented in this PPT design is completely editable. Download it and make adjustments in color, background, font etc. as per your unique business setting.
Fundamentals Of Reinforcement Performance Tracking Dashboard For Reinforcement Elements PDF
This slide represents the performance tracking dashboard for the reinforcement learning model based on different time frames and categories. Make sure to capture your audiences attention in your business displays with our gratis customizable Fundamentals Of Reinforcement Performance Tracking Dashboard For Reinforcement Elements PDF. These are great for business strategies, office conferences, capital raising or task suggestions. If you desire to acquire more customers for your tech business and ensure they stay satisfied, create your own sales presentation with these plain slides.

Smart Manufacturing Dashboard To Track Production Quality Professional PDF
This slide represents smart manufacturing dashboard. It covers production volume, downtime causes, top product sold item, sales revenue, active machinery etc. Find a pre-designed and impeccable Smart Manufacturing Dashboard To Track Production Quality Professional PDF. The templates can ace your presentation without additional effort. You can download these easy-to-edit presentation templates to make your presentation stand out from others. So, what are you waiting for. Download the template from Slidegeeks today and give a unique touch to your presentation.

KPI Dashboard To Track Amazon Performance Template PDF
This slide provides information regarding dashboard to monitor Amazon performance. The KPIs include tracking of product sales, conversion rate, advertising spends, session, organic sales, etc. Do you have to make sure that everyone on your team knows about any specific topic I yes, then you should give KPI Dashboard To Track Amazon Performance Template PDF a try. Our experts have put a lot of knowledge and effort into creating this impeccable KPI Dashboard To Track Amazon Performance Template PDF. You can use this template for your upcoming presentations, as the slides are perfect to represent even the tiniest detail. You can download these templates from the Slidegeeks website and these are easy to edit. So grab these today

Action Plan To Enhance Customer Engagement Analytical Dashboard Elements PDF
This slide shows customer engagement analytical dashboard that covers total sales, total transaction, email received, links clicked, unique customer sales, sales comparison, customers name, product list. Present like a pro with Action Plan To Enhance Customer Engagement Analytical Dashboard Elements PDF Create beautiful presentations together with your team, using our easy-to-use presentation slides. Share your ideas in real-time and make changes on the fly by downloading our templates. So whether youre in the office, on the go, or in a remote location, you can stay in sync with your team and present your ideas with confidence. With Slidegeeks presentation got a whole lot easier. Grab these presentations today.
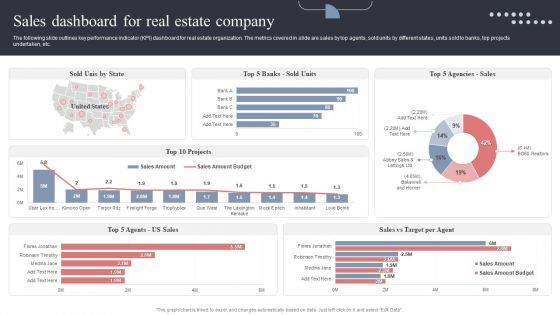
Sales Dashboard For Real Estate Company Topics PDF
The following slide outlines key performance indicator KPI dashboard for real estate organization. The metrics covered in slide are sales by top agents, sold units by different states, units sold to banks, top projects undertaken, etc. This Sales Dashboard For Real Estate Company Topics PDF is perfect for any presentation, be it in front of clients or colleagues. It is a versatile and stylish solution for organizing your meetings. The Sales Dashboard For Real Estate Company Topics PDF features a modern design for your presentation meetings. The adjustable and customizable slides provide unlimited possibilities for acing up your presentation. Slidegeeks has done all the homework before launching the product for you. So, do not wait, grab the presentation templates today

Sales And Revenue Assessment Kpi Dashboard Brochure PDF
Following slide exhibits dashboard that determine impact of environmental assessment on business performance. It includes indicators such as average operative cost, product model performance etc. If your project calls for a presentation, then Slidegeeks is your go-to partner because we have professionally designed, easy-to-edit templates that are perfect for any presentation. After downloading, you can easily edit Sales And Revenue Assessment Kpi Dashboard Brochure PDF and make the changes accordingly. You can rearrange slides or fill them with different images. Check out all the handy templates

System Deployment Project Sales Software Performance Measurement Dashboard Summary PDF
This slide represents the dashboard to track and measure the performance of sales dashboard. It includes details related to KPIs such as sales activity, product details, purchase order etc. Welcome to our selection of the System Deployment Project Sales Software Performance Measurement Dashboard Summary PDF. These are designed to help you showcase your creativity and bring your sphere to life. Planning and Innovation are essential for any business that is just starting out. This collection contains the designs that you need for your everyday presentations. All of our PowerPoints are 100 percent editable, so you can customize them to suit your needs. This multi-purpose template can be used in various situations. Grab these presentation templates today.
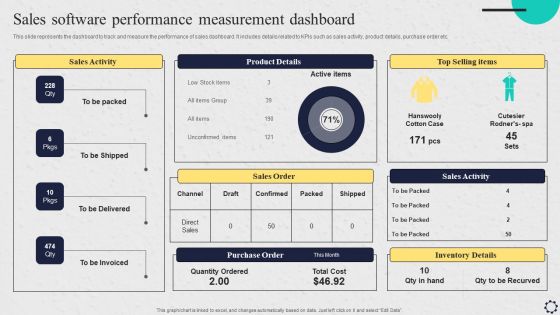
Software Implementation Strategy Sales Software Performance Measurement Dashboard Template PDF
This slide represents the dashboard to track and measure the performance of sales dashboard. It includes details related to KPIs such as sales activity, product details, purchase order etc. Coming up with a presentation necessitates that the majority of the effort goes into the content and the message you intend to convey. The visuals of a PowerPoint presentation can only be effective if it supplements and supports the story that is being told. Keeping this in mind our experts created Software Implementation Strategy Sales Software Performance Measurement Dashboard Template PDF to reduce the time that goes into designing the presentation. This way, you can concentrate on the message while our designers take care of providing you with the right template for the situation.
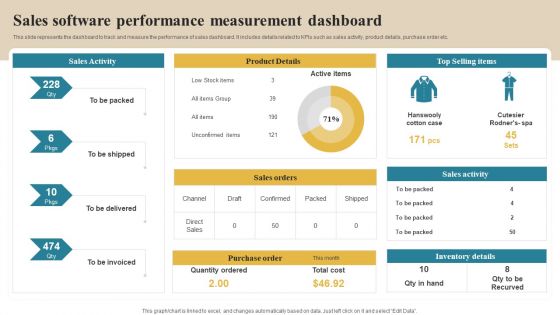
Software Implementation Technique Sales Software Performance Measurement Dashboard Slides PDF
This slide represents the dashboard to track and measure the performance of sales dashboard. It includes details related to KPIs such as sales activity, product details, purchase order etc. This modern and well arranged Software Implementation Technique Sales Software Performance Measurement Dashboard Slides PDF provides lots of creative possibilities. It is very simple to customize and edit with the Powerpoint Software. Just drag and drop your pictures into the shapes. All facets of this template can be edited with Powerpoint no extra software is necessary. Add your own material, put your images in the places assigned for them, adjust the colors, and then you can show your slides to the world, with an animated slide included.
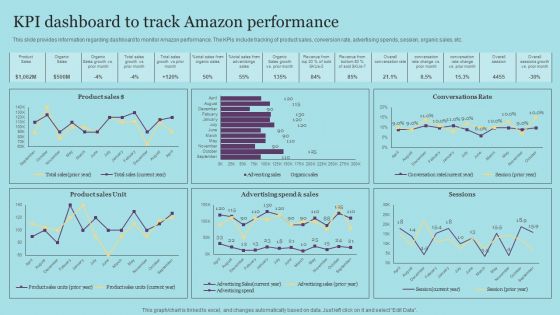
KPI Dashboard To Track Amazon Performance Designs PDF
This slide provides information regarding dashboard to monitor Amazon performance. The KPIs include tracking of product sales, conversion rate, advertising spends, session, organic sales, etc. Do you have to make sure that everyone on your team knows about any specific topic I yes, then you should give KPI Dashboard To Track Amazon Performance Designs PDF a try. Our experts have put a lot of knowledge and effort into creating this impeccable KPI Dashboard To Track Amazon Performance Designs PDF. You can use this template for your upcoming presentations, as the slides are perfect to represent even the tiniest detail. You can download these templates from the Slidegeeks website and these are easy to edit. So grab these today

Dashboard To Evaluate The Hospital Operations Performance Diagrams PDF
The following slide showcases dashboard which can be used by the healthcare professionals to measure the performance of operational department. The KPIs covered in the slide are total patients, operational cost, available staff per division etc. Make sure to capture your audiences attention in your business displays with our gratis customizable Dashboard To Evaluate The Hospital Operations Performance Diagrams PDF. These are great for business strategies, office conferences, capital raising or task suggestions. If you desire to acquire more customers for your tech business and ensure they stay satisfied, create your own sales presentation with these plain slides.

Sales Work Action Plan Analysis Dashboard Brochure PDF
This slide covers the dashboard for analyzing the sales plan implemented in an organization. The purpose of this template is to assess strategical and operational aspects of the company. It includes key performance indicators such as number of sales, revenue, profit, cost, etc. Showcasing this set of slides titled Sales Work Action Plan Analysis Dashboard Brochure PDF. The topics addressed in these templates are Sales Revenue, Cost Breakdown, Accumulated Revenue. All the content presented in this PPT design is completely editable. Download it and make adjustments in color, background, font etc. as per your unique business setting.

Enterprise Budget Analysis Dashboard Highlighting Net Profit Margin Clipart PDF
This slide represents dashboard of the organization showing the analysis of the corporate budget. It shows income and expenses, net profit margin, income statement, accounts receivable and payable, quick and current ratio of the business etc. Showcasing this set of slides titled Enterprise Budget Analysis Dashboard Highlighting Net Profit Margin Clipart PDF. The topics addressed in these templates are Income And Expenses, Net Profit Margin, Income Budget. All the content presented in this PPT design is completely editable. Download it and make adjustments in color, background, font etc. as per your unique business setting.
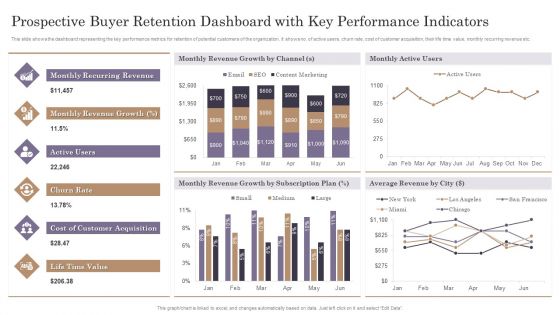
Prospective Buyer Retention Dashboard With Key Performance Indicators Themes PDF
This slide shows the dashboard representing the key performance metrics for retention of potential customers of the organization. It shows no. of active users, churn rate, cost of customer acquisition, their life time value, monthly recurring revenue etc.Pitch your topic with ease and precision using this Prospective Buyer Retention Dashboard With Key Performance Indicators Themes PDF. This layout presents information on Recurring Revenue, Revenue Growth, Customer Acquisition. It is also available for immediate download and adjustment. So, changes can be made in the color, design, graphics or any other component to create a unique layout.
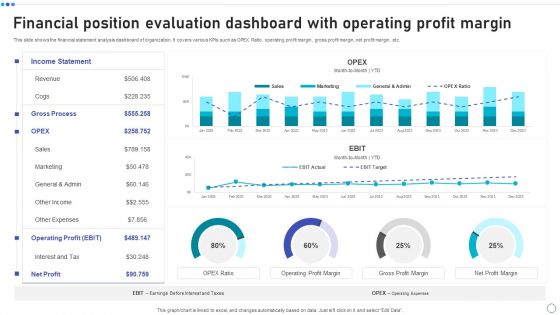
Financial Position Evaluation Dashboard With Operating Profit Margin Elements PDF
This slide shows the financial statement analysis dashboard of organization. It covers various KPIs such as OPEX Ratio, operating profit margin, gross profit margin, net profit margin, etc. Pitch your topic with ease and precision using this Financial Position Evaluation Dashboard With Operating Profit Margin Elements PDF. This layout presents information on Income Statement, Revenue, Operating Profit, Net Profit. It is also available for immediate download and adjustment. So, changes can be made in the color, design, graphics or any other component to create a unique layout.
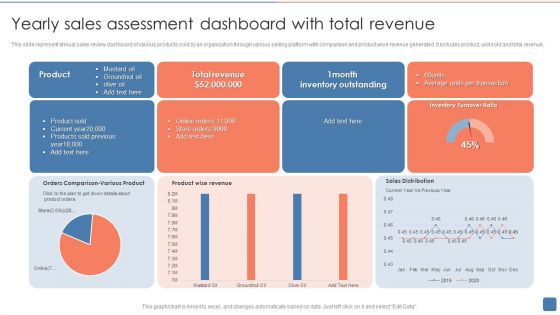
Yearly Sales Assessment Dashboard With Total Revenue Introduction PDF
This slide represent annual sales review dashboard of various products sold by an organization through various selling platform with comparison and product wise revenue generated .It includes product, unit sold and total revenue. Showcasing this set of slides titled Yearly Sales Assessment Dashboard With Total Revenue Introduction PDF. The topics addressed in these templates are Product Sold, Inventory Outstanding, Average. All the content presented in this PPT design is completely editable. Download it and make adjustments in color, background, font etc. as per your unique business setting.
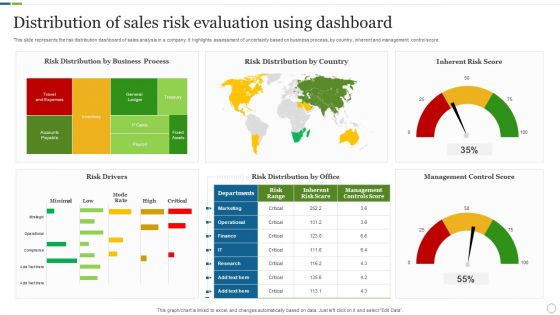
Distribution Of Sales Risk Evaluation Using Dashboard Brochure PDF
This slide represents the risk distribution dashboard of sales analysis in a company. It highlights assessment of uncertainty based on business process, by country , inherent and management control score. Showcasing this set of slides titled Distribution Of Sales Risk Evaluation Using Dashboard Brochure PDF. The topics addressed in these templates are Risk Drivers, Management Control Score, Inherent Risk Score. All the content presented in this PPT design is completely editable. Download it and make adjustments in color, background, font etc. as per your unique business setting.

KPI Dashboard To Monitor Land Asset Management Practices Clipart PDF
Following slide demonstrate KPI dashboard for tracking expenses incurred on real estate asset maintenance and to reduce operational cost. It includes elements such as net income, monthly income and expenses, last quarter rent collection status, rental revenue , budget, etc. Pitch your topic with ease and precision using this KPI Dashboard To Monitor Land Asset Management Practices Clipart PDF. This layout presents information on Revenue, Budget, Income. It is also available for immediate download and adjustment. So, changes can be made in the color, design, graphics or any other component to create a unique layout.
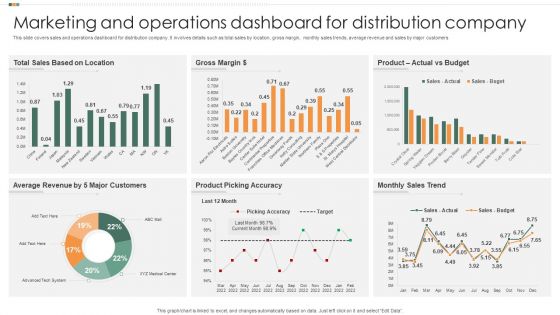
Marketing And Operations Dashboard For Distribution Company Guidelines PDF
This slide covers sales and operations dashboard for distribution company. It involves details such as total sales by location, gross margin, monthly sales trends, average revenue and sales by major customers. Pitch your topic with ease and precision using this Marketing And Operations Dashboard For Distribution Company Guidelines PDF. This layout presents information on Gross Margin, Actual Vs Budget, Product. It is also available for immediate download and adjustment. So, changes can be made in the color, design, graphics or any other component to create a unique layout.
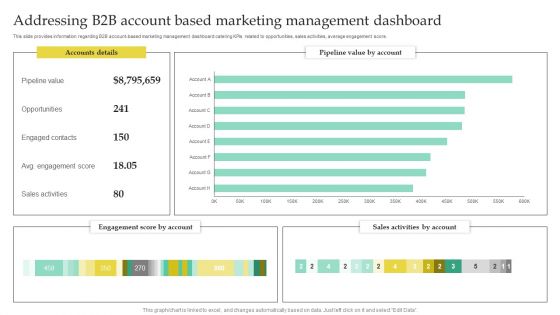
Addressing B2B Account Based Marketing Management Dashboard Elements PDF
This slide provides information regarding B2B account-based marketing management dashboard catering KPIs related to opportunities, sales activities, average engagement score. If you are looking for a format to display your unique thoughts, then the professionally designed Addressing B2B Account Based Marketing Management Dashboard Elements PDF is the one for you. You can use it as a Google Slides template or a PowerPoint template. Incorporate impressive visuals, symbols, images, and other charts. Modify or reorganize the text boxes as you desire. Experiment with shade schemes and font pairings. Alter, share or cooperate with other people on your work. Download Addressing B2B Account Based Marketing Management Dashboard Elements PDF and find out how to give a successful presentation. Present a perfect display to your team and make your presentation unforgettable.
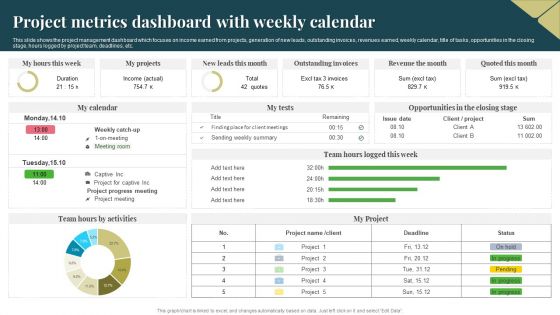
Project Metrics Dashboard With Weekly Calendar Download PDF
This slide shows the project management dashboard which focuses on income earned from projects, generation of new leads, outstanding invoices, revenues earned, weekly calendar, title of tasks, opportunities in the closing stage, hours logged by project team, deadlines, etc. Pitch your topic with ease and precision using this Project Metrics Dashboard With Weekly Calendar Download PDF. This layout presents information on Income, Revenue, Project. It is also available for immediate download and adjustment. So, changes can be made in the color, design, graphics or any other component to create a unique layout.
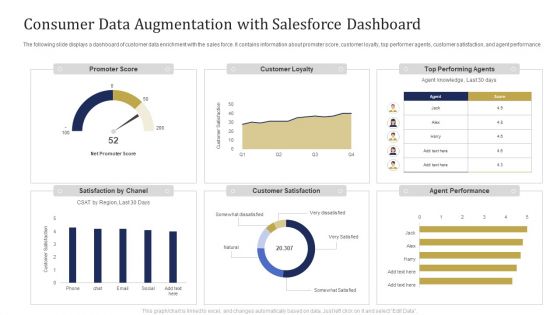
Consumer Data Augmentation With Salesforce Dashboard Ppt Pictures Portrait PDF
The following slide displays a dashboard of customer data enrichment with the sales force. It contains information about promoter score, customer loyalty, top performer agents, customer satisfaction, and agent performance. Showcasing this set of slides titled Consumer Data Augmentation With Salesforce Dashboard Ppt Pictures Portrait PDF. The topics addressed in these templates are Promoter Score, Customer Loyalty, Top Performing Agents. All the content presented in this PPT design is completely editable. Download it and make adjustments in color, background, font etc. as per your unique business setting.

Digital Marketing Dashboard To Improve Performance Visibility Brochure PDF
This slide covers digital marketing dashboard to improve performance visibility and sales. It involves details such as total number of sessions, bounce rate, goal completions and major channels over time. If you are looking for a format to display your unique thoughts, then the professionally designed Digital Marketing Dashboard To Improve Performance Visibility Brochure PDF is the one for you. You can use it as a Google Slides template or a PowerPoint template. Incorporate impressive visuals, symbols, images, and other charts. Modify or reorganize the text boxes as you desire. Experiment with shade schemes and font pairings. Alter, share or cooperate with other people on your work. Download Digital Marketing Dashboard To Improve Performance Visibility Brochure PDF and find out how to give a successful presentation. Present a perfect display to your team and make your presentation unforgettable.
Product And Customer Performance Tracking Dashboard Summary PDF
This slide provides information regarding dashboard utilized by firm to monitor performance of products offered and customer associated. The performance is tracked through revenues generated, new customer acquired, customer satisfaction, sales comparison, etc. If you are looking for a format to display your unique thoughts, then the professionally designed Product And Customer Performance Tracking Dashboard Summary PDF is the one for you. You can use it as a Google Slides template or a PowerPoint template. Incorporate impressive visuals, symbols, images, and other charts. Modify or reorganize the text boxes as you desire. Experiment with shade schemes and font pairings. Alter, share or cooperate with other people on your work. Download Product And Customer Performance Tracking Dashboard Summary PDF and find out how to give a successful presentation. Present a perfect display to your team and make your presentation unforgettable.
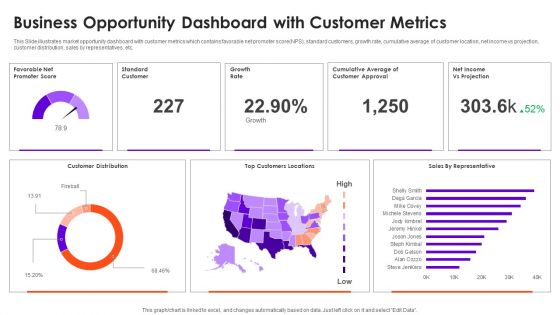
Business Opportunity Dashboard With Customer Metrics Information PDF
This Slide illustrates market opportunity dashboard with customer metrics which contains favorable net promoter score NPS, standard customers, growth rate, cumulative average of customer location, net income vs projection, customer distribution, sales by representatives, etc. Pitch your topic with ease and precision using this Business Opportunity Dashboard With Customer Metrics Information PDF. This layout presents information on Customer Distribution, Growth Rate, Top Customers Locations. It is also available for immediate download and adjustment. So, changes can be made in the color, design, graphics or any other component to create a unique layout.
CRM Pipeline Administration Tracking Customer Sales Funnel Dashboard Brochure PDF
This slide covers information regarding the customer sales funnel tracking with sales volume and total market. If you are looking for a format to display your unique thoughts, then the professionally designed CRM Pipeline Administration Tracking Customer Sales Funnel Dashboard Brochure PDF is the one for you. You can use it as a Google Slides template or a PowerPoint template. Incorporate impressive visuals, symbols, images, and other charts. Modify or reorganize the text boxes as you desire. Experiment with shade schemes and font pairings. Alter, share or cooperate with other people on your work. Download CRM Pipeline Administration Tracking Customer Sales Funnel Dashboard Brochure PDF and find out how to give a successful presentation. Present a perfect display to your team and make your presentation unforgettable.
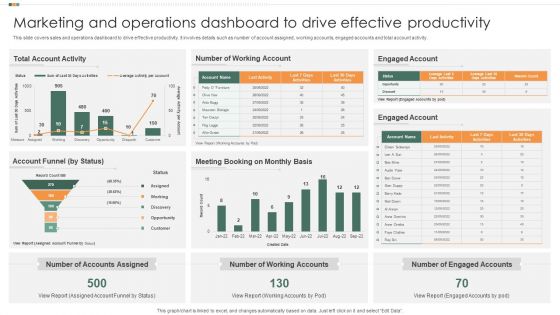
Marketing And Operations Dashboard To Drive Effective Productivity Background PDF
This slide covers sales and operations dashboard to drive effective productivity. It involves details such as number of account assigned, working accounts, engaged accounts and total account activity. Pitch your topic with ease and precision using this Marketing And Operations Dashboard To Drive Effective Productivity Background PDF. This layout presents information on Total Account Activity, Number Of Working Account, Engaged Account. It is also available for immediate download and adjustment. So, changes can be made in the color, design, graphics or any other component to create a unique layout.

Dashboard Highlighting CRM Ticketing Tool Operations Diagrams PDF
This slide illustrates dashboard showcasing customer relationship management ticketing tool operations. It provides information about satisfaction, new tickets, chats, calls, invoicing, tech support, sales, engineers, replies, etc. Want to ace your presentation in front of a live audience Our Dashboard Highlighting CRM Ticketing Tool Operations Diagrams PDF can help you do that by engaging all the users towards you. Slidegeeks experts have put their efforts and expertise into creating these impeccable powerpoint presentations so that you can communicate your ideas clearly. Moreover, all the templates are customizable, and easy to edit and downloadable. Use these for both personal and commercial use.

KPI Dashboard For Modernizing Hospitality Business Inspiration PDF
The following slide showcases dashboard to track data and perform analytics for managing staff, ordering supplies and to maintain customer satisfaction. It presents information related to expenses, sales, etc. Pitch your topic with ease and precision using this KPI Dashboard For Modernizing Hospitality Business Inspiration PDF. This layout presents information on Fiscal Year, Labor, Modernizing Hospitality. It is also available for immediate download and adjustment. So, changes can be made in the color, design, graphics or any other component to create a unique layout.

Business Scheme Management Synopsis Finance Dashboard Diagrams PDF
Deliver and pitch your topic in the best possible manner with this business scheme management synopsis finance dashboard diagrams pdf. Use them to share invaluable insights on operating, income, expenses, sales and impress your audience. This template can be altered and modified as per your expectations. So, grab it now.
Sales Techniques Playbook Sales Management Activities Tracking Dashboard Introduction PDF
This slide provides information regarding various metrics catered to track sales team performance in terms of average revenue per account, win rate, NPS, along with sales representative performance tracking through number of opportunities created, lead response time, etc. Deliver an awe inspiring pitch with this creative sales techniques playbook sales management activities tracking dashboard introduction pdf bundle. Topics like growth, sales can be discussed with this completely editable template. It is available for immediate download depending on the needs and requirements of the user.
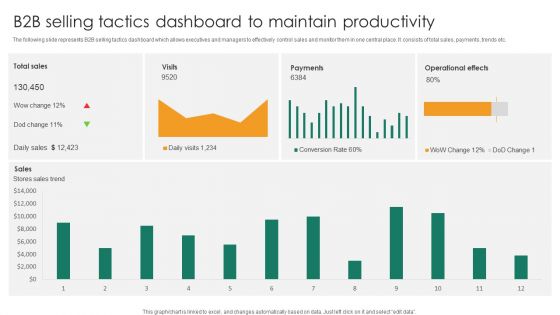
B2b Selling Tactics Dashboard To Maintain Productivity Introduction PDF
The following slide represents B2B selling tactics dashboard which allows executives and managers to effectively control sales and monitor them in one central place. It consists of total sales, payments, trends etc.Pitch your topic with ease and precision using this B2b Selling Tactics Dashboard To Maintain Productivity Introduction PDF. This layout presents information on Operational Effects, Stores Sales Trend, Conversion Rate. It is also available for immediate download and adjustment. So, changes can be made in the color, design, graphics or any other component to create a unique layout.

KPI Dashboard Of Real Estate Customer Relationship Management Pictures PDF
This slide represents the dashboard generated through CRM software used in a real estate company. It shows details related to key performance metrics such as leads by source, closed and pending transactions, projected monthly sales volume etc. Showcasing this set of slides titled KPI Dashboard Of Real Estate Customer Relationship Management Pictures PDF. The topics addressed in these templates are Projected Monthly Sales Volume, Leads By Source, Annual Commissions. All the content presented in this PPT design is completely editable. Download it and make adjustments in color, background, font etc. as per your unique business setting.

Vendor Management System Project Report Dashboard Template PDF
This slide shows the dashboard representing the project report of the Vendor management system of the organization. It shows details regarding no. of warehouses, contacts, accounts, suppliers , total sales and purchase of goods etc. Showcasing this set of slides titled Vendor Management System Project Report Dashboard Template PDF. The topics addressed in these templates are Purchase, Sales, Suppliers. All the content presented in this PPT design is completely editable. Download it and make adjustments in color, background, font etc. as per your unique business setting.

Dashboard Depicting Digital Advertising Marketing Campaign Ppt Summary Elements PDF
This slide represents dashboard for advertising campaign report .It includes social media costs , clicks , cost per action , conversions to help businesses in increasing sales of products and services. Showcasing this set of slides titled Dashboard Depicting Digital Advertising Marketing Campaign Ppt Summary Elements PDF. The topics addressed in these templates are Social Media Cost, Social Media Clicks, Adwords Clicks, Adwords Cost . All the content presented in this PPT design is completely editable. Download it and make adjustments in color, background, font etc. as per your unique business setting.
Storage Facility Productivity Tracking And Management System Dashboard Diagrams PDF
This slide showcases a dashboard for managing and tracking warehouse productivity to optimize operational process. It includes key components such as user registered, subscribers request, orders, sales, transaction summary and top profiles. Showcasing this set of slides titled Storage Facility Productivity Tracking And Management System Dashboard Diagrams PDF. The topics addressed in these templates are Transaction Summary, Registered Users, Tracking Management. All the content presented in this PPT design is completely editable. Download it and make adjustments in color, background, font etc. as per your unique business setting.
Dashboard For Tracking Business And IT Alignment Microsoft PDF
This slide depicts the dashboard for business and IT alignment by covering details of total sales, customer support service, percentage of business operations aligned IT, usage of communication channels, and top performer associates. Find a pre designed and impeccable Dashboard For Tracking Business And IT Alignment Microsoft PDF. The templates can ace your presentation without additional effort. You can download these easy to edit presentation templates to make your presentation stand out from others. So, what are you waiting for Download the template from Slidegeeks today and give a unique touch to your presentation.
KPI Dashboard For Tracking Supply Chain Costs Inspiration PDF
This slide represents the KPI dashboard to track the multiple cost associated with supply chain in food manufacturing industry. It includes information regarding cash to cash cycle in days, carry cost of inventory along with details of net sales. Deliver an awe inspiring pitch with this creative KPI Dashboard For Tracking Supply Chain Costs Inspiration PDF bundle. Topics like Supply Chain Costs, Average Cash, Service can be discussed with this completely editable template. It is available for immediate download depending on the needs and requirements of the user.
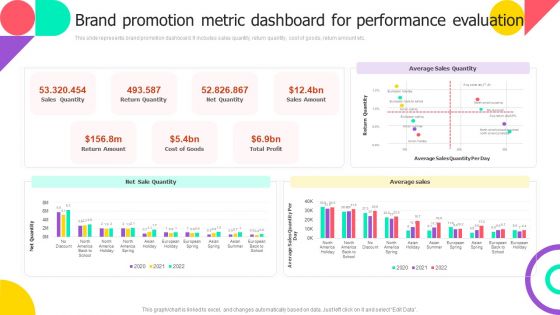
Brand Promotion Metric Dashboard For Performance Evaluation Sample PDF
This slide represents brand promotion dashboard. It includes sales quantity, return quantity, cost of goods, return amount etc. Slidegeeks is one of the best resources for PowerPoint templates. You can download easily and regulate Brand Promotion Metric Dashboard For Performance Evaluation Sample PDF for your personal presentations from our wonderful collection. A few clicks is all it takes to discover and get the most relevant and appropriate templates. Use our Templates to add a unique zing and appeal to your presentation and meetings. All the slides are easy to edit and you can use them even for advertisement purposes.
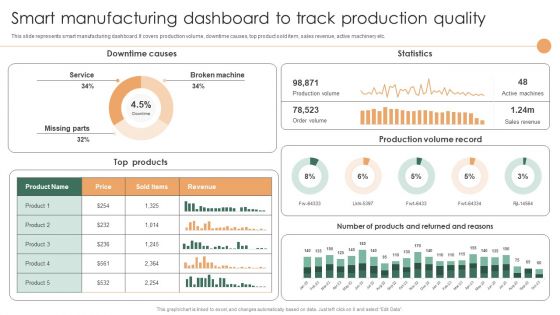
Smart Manufacturing Dashboard To Track Production Quality Rules PDF
This slide represents smart manufacturing dashboard. It covers production volume, downtime causes, top product sold item, sales revenue, active machinery etc.Boost your pitch with our creative Smart Manufacturing Dashboard To Track Production Quality Rules PDF. Deliver an awe-inspiring pitch that will mesmerize everyone. Using these presentation templates you will surely catch everyones attention. You can browse the ppts collection on our website. We have researchers who are experts at creating the right content for the templates. So you do not have to invest time in any additional work. Just grab the template now and use them.

Social Influencer Marketing Performance Monitoring Dashboard Slides PDF
This slide shows the dashboard representing the analytics of social media influencer marketing for the purpose of measurement and monitoring of its performance. It includes details regarding no. of page views, social shares, lead generation and sales etc. through the influencer marketing.Pitch your topic with ease and precision using this Social Influencer Marketing Performance Monitoring Dashboard Slides PDF. This layout presents information on Lead Generation, Pipeline Generated, Opportunities Influenced. It is also available for immediate download and adjustment. So, changes can be made in the color, design, graphics or any other component to create a unique layout.
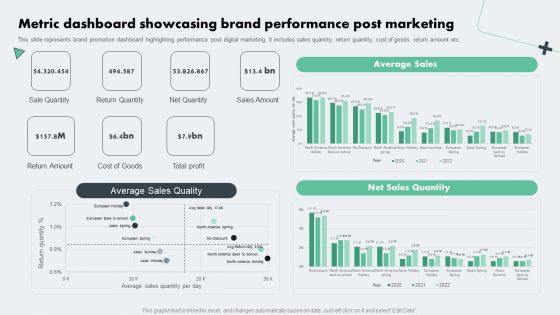
Deploying Online Marketing Metric Dashboard Showcasing Brand Performance Microsoft PDF
This slide represents brand promotion dashboard highlighting performance post digital marketing. It includes sales quantity, return quantity, cost of goods, return amount etc. From laying roadmaps to briefing everything in detail, our templates are perfect for you. You can set the stage with your presentation slides. All you have to do is download these easy-to-edit and customizable templates. Deploying Online Marketing Metric Dashboard Showcasing Brand Performance Microsoft PDF will help you deliver an outstanding performance that everyone would remember and praise you for. Do download this presentation today.

Driver Attention Monitoring Software Dashboard For Accidents Analysis Diagrams PDF
This slide demonstrates the dashboard representing the accidents analysis through driver monitoring system. It includes details related to accident count by sales and vehicle manufactured year, monthly accident numbers, contributing factors etc. Showcasing this set of slides titled Driver Attention Monitoring Software Dashboard For Accidents Analysis Diagrams PDF. The topics addressed in these templates are Contributing Factors,Vehicle Type, Monthly Accident Numbers. All the content presented in this PPT design is completely editable. Download it and make adjustments in color, background, font etc. as per your unique business setting.

Loyalty Program Performance Dashboard Ppt PowerPoint Presentation Summary Grid
This is a loyalty program performance dashboard ppt powerpoint presentation summary grid. This is a six stage process. The stages in this process are average sale by loyalty member type, average award by customer, all orders by promotions, average sale by loyalty segment, sales by channel.
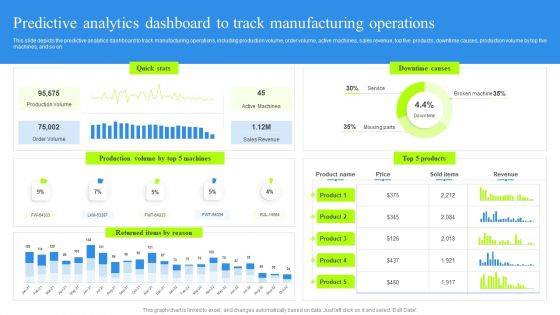
Predictive Analytics Dashboard To Track Manufacturing Operations Rules PDF
This slide depicts the predictive analytics dashboard to track manufacturing operations, including production volume, order volume, active machines, sales revenue, top five products, downtime causes, production volume by top five machines, and so on. Present like a pro with Predictive Analytics Dashboard To Track Manufacturing Operations Rules PDF Create beautiful presentations together with your team, using our easy-to-use presentation slides. Share your ideas in real-time and make changes on the fly by downloading our templates. So whether you are in the office, on the go, or in a remote location, you can stay in sync with your team and present your ideas with confidence. With Slidegeeks presentation got a whole lot easier. Grab these presentations today.

Departmental Goals And Progress Status Dashboard Ppt Portfolio Samples PDF
This slide illustrates statistics and graphical representation of team progress. It includes testing team, sales team, development team, members and progress status graphs etc. Pitch your topic with ease and precision using this Departmental Goals And Progress Status Dashboard Ppt Portfolio Samples PDF. This layout presents information on Testing Team, Sales Team, Development Team. It is also available for immediate download and adjustment. So, changes can be made in the color, design, graphics or any other component to create a unique layout.

B2B Marketing KPI Dashboard INSIGHT Ppt Ideas Information PDF
Deliver an awe-inspiring pitch with this creative b2b marketing kpi dashboard insight ppt ideas information pdf bundle. Topics like revenue breakdown, leads region, sales reps leads, sales representatives leads actual, sales results identify individual performance can be discussed with this completely editable template. It is available for immediate download depending on the needs and requirements of the user.

Improving Technology Based Dashboard Highlighting Candidate Onboarding Tasks Information PDF
This slide showcases dashboard helpful in measuring tasks and progress related to candidate onboarding. It provides information about monthly onboarding, onboarding by department, open tasks, overdue, accounts, human resource, etc. Slidegeeks is here to make your presentations a breeze with Improving Technology Based Dashboard Highlighting Candidate Onboarding Tasks Information PDF With our easy-to-use and customizable templates, you can focus on delivering your ideas rather than worrying about formatting. With a variety of designs to choose from, youre sure to find one that suits your needs. And with animations and unique photos, illustrations, and fonts, you can make your presentation pop. So whether youre giving a sales pitch or presenting to the board, make sure to check out Slidegeeks first.

KPI Dashboard To Measure Sales Divisional Strategy Growth Formats PDF
This slide signifies the key performance indicator to measure sales department strategy growth. It covers information regarding to the units sold, top 10 project, target per agent. Showcasing this set of slides titled KPI Dashboard To Measure Sales Divisional Strategy Growth Formats PDF. The topics addressed in these templates are Sales, Target. All the content presented in this PPT design is completely editable. Download it and make adjustments in color, background, font etc. as per your unique business setting.
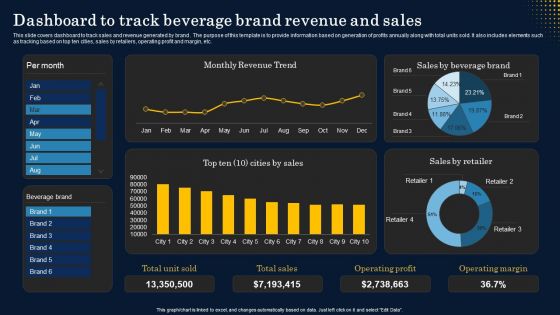
Dashboard To Track Beverage Brand Revenue And Sales Structure PDF
This slide covers dashboard to track sales and revenue generated by brand . The purpose of this template is to provide information based on generation of profits annually along with total units sold. It also includes elements such as tracking based on top ten cities, sales by retailers, operating profit and margin, etc. Are you in need of a template that can accommodate all of your creative concepts This one is crafted professionally and can be altered to fit any style. Use it with Google Slides or PowerPoint. Include striking photographs, symbols, depictions, and other visuals. Fill, move around, or remove text boxes as desired. Test out color palettes and font mixtures. Edit and save your work, or work with colleagues. Download Dashboard To Track Beverage Brand Revenue And Sales Structure PDF and observe how to make your presentation outstanding. Give an impeccable presentation to your group and make your presentation unforgettable.

 Home
Home