Employee Net Promoter Score

Business Overview Of A Technology Firm Companys Major Statistics From Financial Statements 2022 Structure PDF
The slide provides key stats Revenue, Operating Income, net income, Employee count, Assets, Operating expenses etc. of the company, for the year 2022. Presenting Business Overview Of A Technology Firm Companys Major Statistics From Financial Statements 2022 Structure PDF to provide visual cues and insights. Share and navigate important information on tweleve stages that need your due attention. This template can be used to pitch topics like Operating Income, Net Income, Marketing Expenses. In addtion, this PPT design contains high resolution images, graphics, etc, that are easily editable and available for immediate download.

Business Overview Of An Information Technology Company Companys Major Statements 2020 Icons PDF
The slide provides key stats Revenue, Operating Income, net income, Employee count, Assets, Operating expenses etc. of the company, for the year 2020.Presenting Business Overview Of An Information Technology Company Companys Major Statements 2020 Icons PDF to provide visual cues and insights. Share and navigate important information on twelve stages that need your due attention. This template can be used to pitch topics like Operating Income, Marketing Expenses, Employee In addtion, this PPT design contains high resolution images, graphics, etc, that are easily editable and available for immediate download.
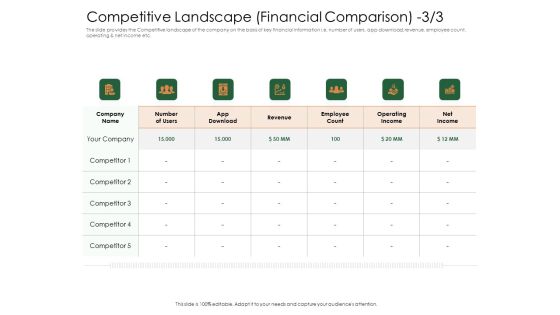
Substitute Financing Pitch Deck Competitive Landscape Financial Comparison Revenue Ideas PDF
The Slide Provides The Competitive Landscape Of The Company On The Basis Of Key Financial Information I.E. Number Of Users, App Download, Revenue, Employee Count, Operating And Net Income Etc. Deliver an awe inspiring pitch with this creative substitute financing pitch deck competitive landscape financial comparison revenue ideas pdf bundle. Topics like competitive landscape financial comparison can be discussed with this completely editable template. It is available for immediate download depending on the needs and requirements of the user.
Key Product Distribution Channels Partner Growth Goals Ppt Infographic Template Icons PDF
Presenting this set of slides with name key product distribution channels partner growth goals ppt infographic template icons pdf. The topics discussed in these slides are revenue, profit margin, net new customers, customer satisfaction, net promoter. This is a completely editable PowerPoint presentation and is available for immediate download. Download now and impress your audience.
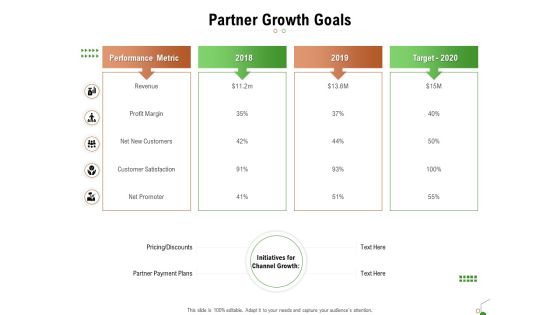
Selecting Appropriate Distribution Channel New Product Partner Growth Goals Ppt Model Outfit PDF
Presenting this set of slides with name selecting appropriate distribution channel new product partner growth goals ppt model outfit pdf. The topics discussed in these slides are revenue, profit margin, net new customers, customer satisfaction, net promoter. This is a completely editable PowerPoint presentation and is available for immediate download. Download now and impress your audience.
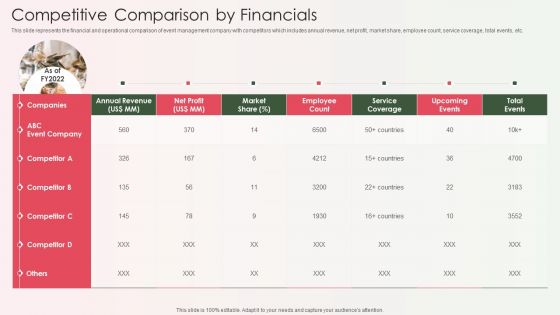
Event Organizer And Coordinator Company Profile Competitive Comparison By Financials Download PDF
This slide represents the financial and operational comparison of event management company with competitors which includes annual revenue, net profit, market share, employee count, service coverage, total events, etc.Deliver an awe inspiring pitch with this creative Event Organizer And Coordinator Company Profile Competitive Comparison By Financials Download PDF bundle. Topics like Annual Revenue, Service Coverage, Upcoming Events can be discussed with this completely editable template. It is available for immediate download depending on the needs and requirements of the user.

Customer Satisfaction Presentation Powerpoint Example
This is a customer satisfaction presentation powerpoint example. This is a five stage process. The stages in this process are customer satisfaction, employee satisfaction, customer loyalty, employee productivity, better service.
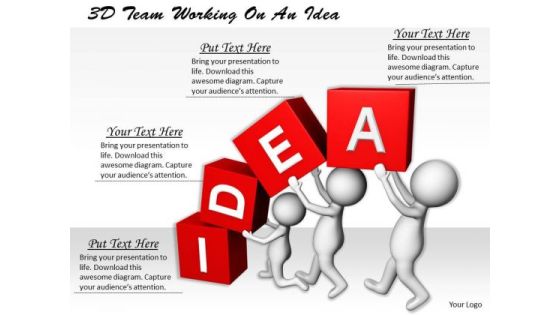
Business Strategy Examples 3d Team Working On An Idea Adaptable Concepts
Our business strategy examples 3d team working on an idea adaptable concepts Powerpoint Templates And Your Ideas Make A Great Doubles Pair. Play The Net With Assured Hands.

Finance Dashboard Ppt PowerPoint Presentation Clipart
This is a finance dashboard ppt powerpoint presentation clipart. This is a four stage process. The stages in this process are sales, operating expenses, operating income, net income.
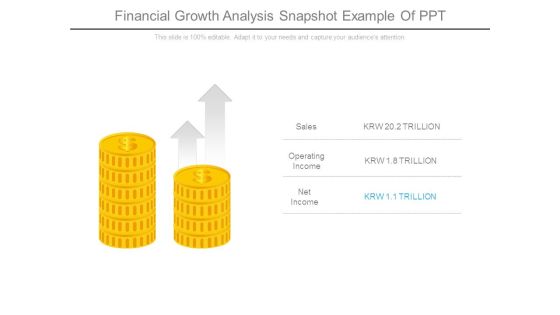
Financial Growth Analysis Snapshot Example Of Ppt
This is a financial growth analysis snapshot example of ppt. This is a two stage process. The stages in this process are sales, operating income, net income.
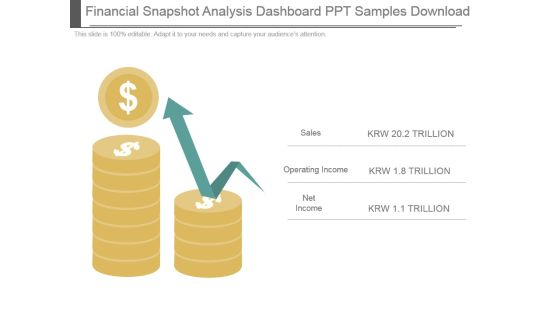
Financial Snapshot Analysis Dashboard Ppt Samples Download
This is a financial snapshot analysis dashboard ppt samples download. This is a two stage process. The stages in this process are sales, operating income, net income.
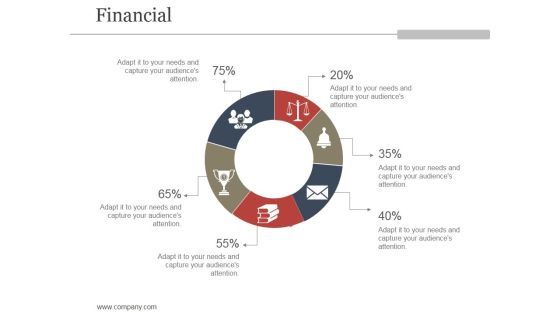
Financial Ppt PowerPoint Presentation Shapes
This is a financial ppt powerpoint presentation shapes. This is a two stage process. The stages in this process are sale, operating income, net income.
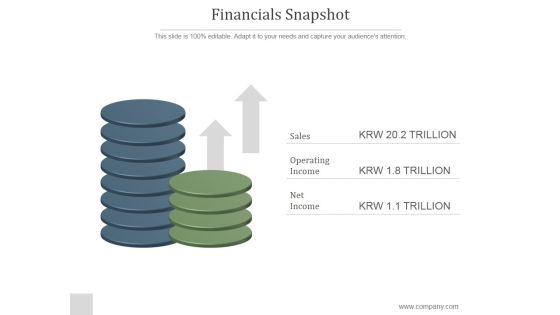
Financials Snapshot Ppt PowerPoint Presentation Show
This is a financials snapshot ppt powerpoint presentation show. This is a two stage process. The stages in this process are sales, operating income, net income.

Analyzing And Improving Staff Work Satisfaction Set Milestones To Review Engagement Progress Topics PDF
The following slide presents some milestones to track and monitor employee engagement status. It includes elements such as optimizing survey participation rate, enhancing employee net promotor score, decreasing absenteeism rate, increasing retention rate etc. Present like a pro with Analyzing And Improving Staff Work Satisfaction Set Milestones To Review Engagement Progress Topics PDF Create beautiful presentations together with your team, using our easy to use presentation slides. Share your ideas in real time and make changes on the fly by downloading our templates. So whether you are in the office, on the go, or in a remote location, you can stay in sync with your team and present your ideas with confidence. With Slidegeeks presentation got a whole lot easier. Grab these presentations today.

Effective Workforce Participation Action Planning Set Milestones To Review Engagement Progress Infographics PDF
The following slide presents some milestones to track and monitor employee engagement status. It includes elements such as optimizing survey participation rate, enhancing employee net promotor score, decreasing absenteeism rate, increasing retention rate etc. Slidegeeks is here to make your presentations a breeze with Effective Workforce Participation Action Planning Set Milestones To Review Engagement Progress Infographics PDF With our easy to use and customizable templates, you can focus on delivering your ideas rather than worrying about formatting. With a variety of designs to choose from, you are sure to find one that suits your needs. And with animations and unique photos, illustrations, and fonts, you can make your presentation pop. So whether you are giving a sales pitch or presenting to the board, make sure to check out Slidegeeks first.
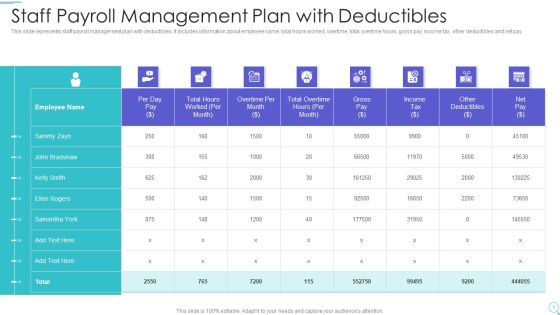
Staff Payroll Management Plan With Deductibles Ideas PDF
This slide represents staff payroll management plan with deductibles. It includes information about employee name, total hours worked, overtime, total overtime hours, gross pay, income tax, other deductibles and net pay. Pitch your topic with ease and precision using this staff payroll management plan with deductibles ideas pdf. This layout presents information on staff payroll management plan with deductibles. It is also available for immediate download and adjustment. So, changes can be made in the color, design, graphics or any other component to create a unique layout.

Implementing Human Resources HR Best Practices Strategy Statement Of Operations Ppt Summary Slide PDF
Presenting this set of slides with name implementing human resources hr best practices strategy statement of operations ppt summary slide pdf. The topics discussed in these slides are net product sales, net service sales, operating expenses, cost sales, marketing, technology, content . This is a completely editable PowerPoint presentation and is available for immediate download. Download now and impress your audience.
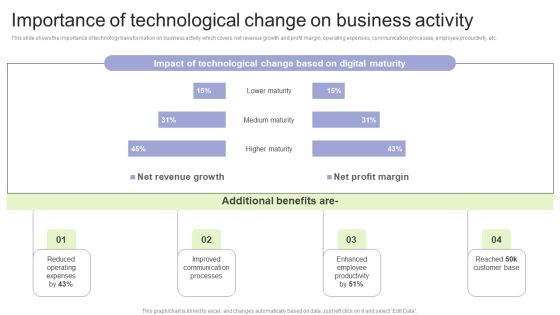
Implementing Change Management Strategy To Transform Business Processes Importance Of Technological Change Introduction PDF
This slide shows the importance of technology transformation on business activity which covers net revenue growth and profit margin, operating expenses, communication processes, employee productivity, etc. Slidegeeks is one of the best resources for PowerPoint templates. You can download easily and regulate Implementing Change Management Strategy To Transform Business Processes Importance Of Technological Change Introduction PDF for your personal presentations from our wonderful collection. A few clicks is all it takes to discover and get the most relevant and appropriate templates. Use our Templates to add a unique zing and appeal to your presentation and meetings. All the slides are easy to edit and you can use them even for advertisement purposes.

Private Equity Fund Pitch Deck To Raise Series C Funding Current Business Statistics Of The Company Clipart PDF
Presenting private equity fund pitch deck to raise series c funding current business statistics of the company clipart pdf to provide visual cues and insights. Share and navigate important information on three stages that need your due attention. This template can be used to pitch topics like revenue, operating income, net income, employee count, rent expenses, gross profit, social media followers, number brands, stores worldwide, distribution channels, advertising expenses. In addtion, this PPT design contains high-resolution images, graphics, etc, that are easily editable and available for immediate download.

Knowledge Process Outsourcing Company Profile Competitive Analysis Of Companies Portrait PDF
This slide highlights the competitive analysis of call center companies on the basis of total languages supported, total industries covered, call resolution rate, employee count, revenue and net profit. Presenting Knowledge Process Outsourcing Company Profile Competitive Analysis Of Companies Portrait PDF to provide visual cues and insights. Share and navigate important information on one stage that need your due attention. This template can be used to pitch topics like Languages Supported, Total Industries, Total Countries. In addtion, this PPT design contains high resolution images, graphics, etc, that are easily editable and available for immediate download.

Global Construction Sector Industry Report Comparative Assessment For Market Player Financials Elements PDF
This slide represents comparative assessment for market player financials. It highlights annual revenue, net profit, employee count, number of construction project etc. Boost your pitch with our creative Global Construction Sector Industry Report Comparative Assessment For Market Player Financials Elements PDF. Deliver an awe-inspiring pitch that will mesmerize everyone. Using these presentation templates you will surely catch everyones attention. You can browse the ppts collection on our website. We have researchers who are experts at creating the right content for the templates. So you do not have to invest time in any additional work. Just grab the template now and use them.

Information Technology Firm Report Example Companys Major Statistics Statements 2022 Portrait PDF
The slide provides key stats Revenue, Operating Income, net income, Employee count, Assets, Operating expenses etc. of the company, for the year 2022Presenting Information Technology Firm Report Example Companys Major Statistics Statements 2022 Portrait PDF to provide visual cues and insights. Share and navigate important information on six stages that need your due attention. This template can be used to pitch topics like Operating Income, Marketing Expenses, Connected Device In addtion, this PPT design contains high resolution images, graphics, etc, that are easily editable and available for immediate download.

Customer Relationship Management In Freehold Property Financial Summary Of The Company Brochure PDF
Presenting this set of slides with name customer relationship management in freehold property financial summary of the company brochure pdf. The topics discussed in these slides are revenue trend, operating and net income trend, revenue geographical segment 2020, operating income, net income, product revenue, service revenue. This is a completely editable PowerPoint presentation and is available for immediate download. Download now and impress your audience.

Extending Brand To Introduce New Commodities And Offerings Analyzing Major Performance Indicators Demonstration PDF
This slide showcases analyzing major performance indicators which can help branding managers to assess extension strategy KPIs. It provides details about market share, product line, launch, variants, color, size, net promotor score NPS, etc. Create an editable Extending Brand To Introduce New Commodities And Offerings Analyzing Major Performance Indicators Demonstration PDF that communicates your idea and engages your audience. Whether youre presenting a business or an educational presentation, pre designed presentation templates help save time. Extending Brand To Introduce New Commodities And Offerings Analyzing Major Performance Indicators Demonstration PDF is highly customizable and very easy to edit, covering many different styles from creative to business presentations. Slidegeeks has creative team members who have crafted amazing templates. So, go and get them without any delay.

Implementing Brand Extension Initiatives For Apple Company Analyzing Major Performance Indicators Post Extension Topics PDF
This slide showcases analyzing major performance indicators which can help branding managers to assess extension strategy KPIs. It provides details about market share, product line, launch, variants, color, size, net promotor score NPS, etc. If you are looking for a format to display your unique thoughts, then the professionally designed Implementing Brand Extension Initiatives For Apple Company Analyzing Major Performance Indicators Post Extension Topics PDF is the one for you. You can use it as a Google Slides template or a PowerPoint template. Incorporate impressive visuals, symbols, images, and other charts. Modify or reorganize the text boxes as you desire. Experiment with shade schemes and font pairings. Alter, share or cooperate with other people on your work. Download Implementing Brand Extension Initiatives For Apple Company Analyzing Major Performance Indicators Post Extension Topics PDF and find out how to give a successful presentation. Present a perfect display to your team and make your presentation unforgettable.
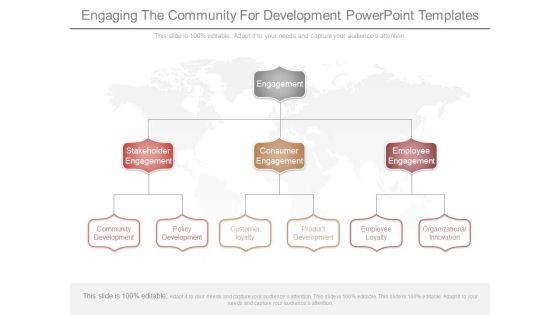
Engaging The Community For Development Powerpoint Templates
This is a engaging the community for development powerpoint templates. This is a three stage process. The stages in this process are engagement, stakeholder engagement, consumer engagement, employee engagement, community development, policy development, customer loyalty, product development, employee loyalty, organizational innovation.

Executive Summary Health And Property Insurance Company Profile Professional PDF
The slide highlights brief company details which depict company outline, key statistics, brand value and global market share. The major statistics covered are CAGR, revenue, combined ratio, net profit, employees count, countries presence, and policyholder count. Deliver and pitch your topic in the best possible manner with this Executive Summary Health And Property Insurance Company Profile Professional PDF. Use them to share invaluable insights on Revenue, Combined Ratio, Net Profit, Countries Presence and impress your audience. This template can be altered and modified as per your expectations. So, grab it now.

Business Operations Summary Ppt PowerPoint Presentation Model Graphics Template
This is a business operations summary ppt powerpoint presentation model graphics template. This is a eight stage process. The stages in this process are net operating margin, productivity customer, retention rate.

Finance Dashboard Ppt PowerPoint Presentation Design Ideas
This is a finance dashboard ppt powerpoint presentation design ideas. This is a two stage process. The stages in this process are sales, operating expenses, operating income, net income.
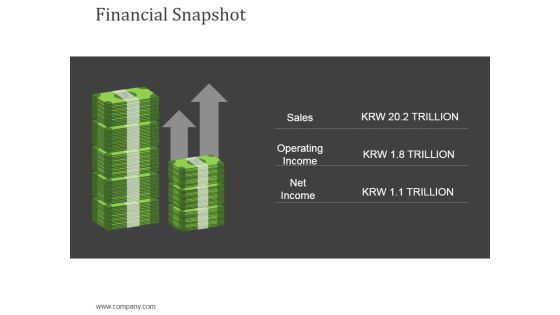
Financial Snapshot Ppt Powerpoint Presentation Layouts Slides
This is a financial snapshot ppt powerpoint presentation layouts slides. This is a two stage process. The stages in this process are sales, operating income, net income, currency, finance.
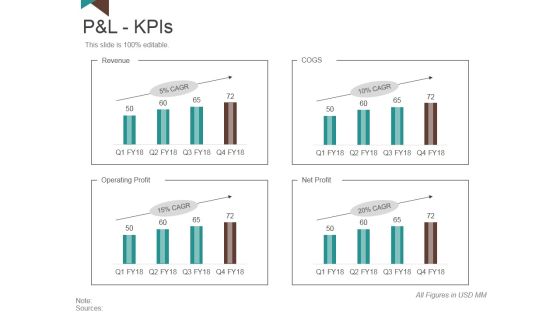
P And L Kpis Template 1 Ppt PowerPoint Presentation Slides Model
This is a p and l kpis template 1 ppt powerpoint presentation slides model. This is a four stage process. The stages in this process are revenue, operating profit, net profit, cogs.

P And L Kpis Template 2 Ppt PowerPoint Presentation Styles Objects
This is a p and l kpis template 2 ppt powerpoint presentation styles objects. This is a four stage process. The stages in this process are revenue, cogs, operating profit, net profit.

P And L Kpis Template 1 Ppt PowerPoint Presentation Model Inspiration
This is a p and l kpis template 1 ppt powerpoint presentation model inspiration. This is a four stage process. The stages in this process are revenue, cogs, operating profit, net profit.
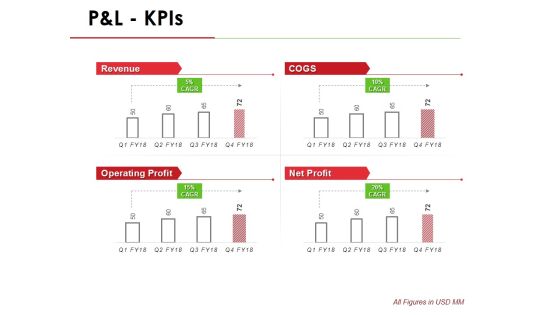
P And L Kpis Template 1 Ppt PowerPoint Presentation Infographic Template Outline
This is a p and l kpis template 1 ppt powerpoint presentation infographic template outline. This is a four stage process. The stages in this process are revenue, operating profit, cogs, net profit.

Cash Flow Statement Kpis Tabular Form Ppt PowerPoint Presentation Gallery Good
This is a cash flow statement kpis tabular form ppt powerpoint presentation gallery good. This is a four stage process. The stages in this process are operations, financing activities, investing activities, net increase in cash.
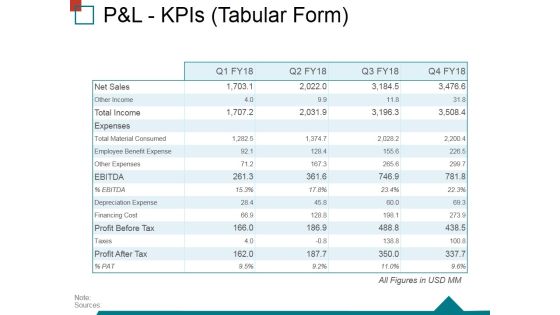
Pandl Kpis Tabular Form Ppt PowerPoint Presentation Ideas Structure
This is a pandl kpis tabular form ppt powerpoint presentation ideas structure. This is a four stage process. The stages in this process are operating profit, revenue, cogs, net profit.

Financial Highlights Growth Analysis Dashboard Powerpoint Slide
This is a financial highlights growth analysis dashboard powerpoint slide. This is a four stage process. The stages in this process are profit and loss, sales, operating expenses, operating income, net income, profitability.
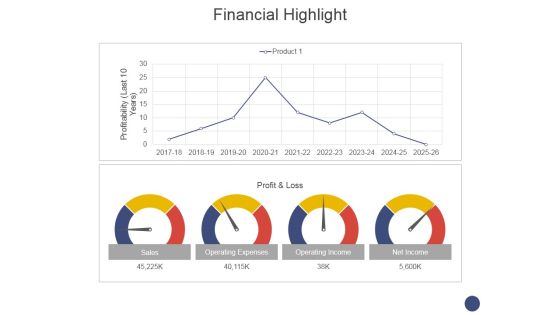
Financial Highlight Template 1 Ppt PowerPoint Presentation Model Deck
This is a financial highlight template 1 ppt powerpoint presentation model deck. This is a two stage process. The stages in this process are sales, operating expenses, operating income, net income.
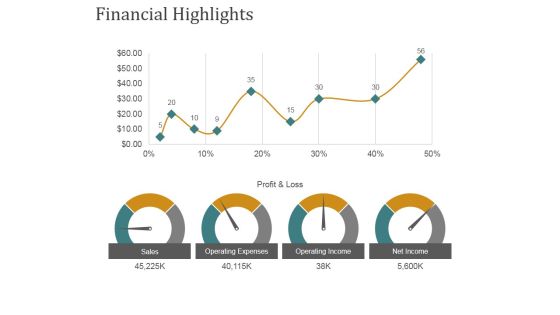
Financial Highlights Template 1 Ppt PowerPoint Presentation Gallery Templates
This is a financial highlights template 1 ppt powerpoint presentation gallery templates. This is a four stage process. The stages in this process are sales, operating expenses, operating income, net income.
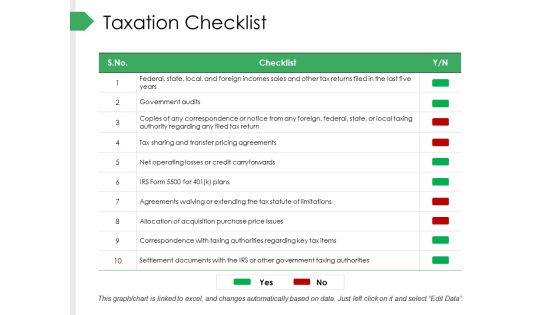
Taxation Checklist Ppt PowerPoint Presentation Summary Layout Ideas
This is a taxation checklist ppt powerpoint presentation summary layout ideas. This is a ten stage process. The stages in this process are business, marketing, tax sharing and transfer pricing agreements, planning, net operating losses or credit carryforwards.
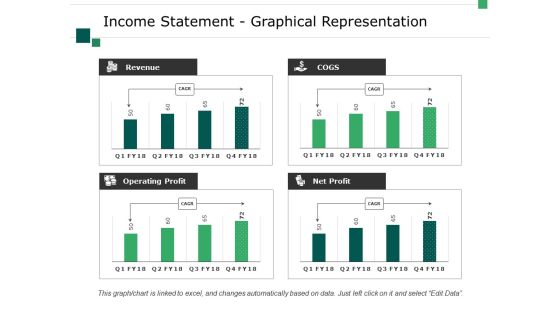
Income Statement Graphical Representation Ppt PowerPoint Presentation Visual Aids Layouts
This is a income statement graphical representation ppt powerpoint presentation visual aids layouts. This is a four stage process. The stages in this process are business, marketing, revenue, operating profit, net profit, cogs.

Cash Flow Statement Kpis Ppt PowerPoint Presentation Deck
This is a cash flow statement kpis ppt powerpoint presentation deck. This is a four stage process. The stages in this process are operations, financing activities, investing activities, net increase in cash.

Cash Flow Statement Kpis Tabular Form Ppt PowerPoint Presentation Infographics File Formats
This is a cash flow statement kpis tabular form ppt powerpoint presentation infographics file formats. This is a four stage process. The stages in this process are operations, investing activities, financing activities, net increase in cash.

Cash Flow Statement Kpis Template 1 Ppt PowerPoint Presentation Pictures Microsoft
This is a cash flow statement kpis template 1 ppt powerpoint presentation pictures microsoft. This is a four stage process. The stages in this process are operations, financing activities, investing activities, net increase in cash.

Cash Flow Statement Kpis Template 1 Ppt PowerPoint Presentation Icon Elements
This is a cash flow statement kpis template 1 ppt powerpoint presentation icon elements. This is a four stage process. The stages in this process are operations, financing activities, investing activities, net increase in cash.

Cash Flow Statement Kpis Tabular Form Ppt PowerPoint Presentation Infographics Professional
This is a cash flow statement kpis tabular form ppt powerpoint presentation infographics professional. This is a four stage process. The stages in this process are operations, financing activities, investing activities, net increase in cash.
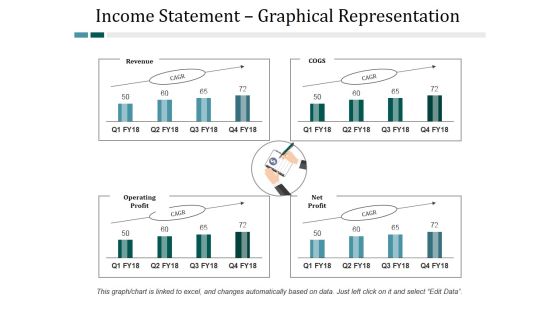
Income Statement Graphical Representation Ppt PowerPoint Presentation Layouts Designs Download
This is a income statement graphical representation ppt powerpoint presentation layouts designs download. This is a four stage process. The stages in this process are revenue, cogs, operating profit, net profit.

Cash Flow Statement Kpis Tabular Form Ppt PowerPoint Presentation Inspiration Master Slide
This is a cash flow statement kpis tabular form ppt powerpoint presentation inspiration master slide. This is a four stage process. The stages in this process are operations, financing activities, investing activities, net increase in cash.

Cash Flow Statement Kpis Ppt PowerPoint Presentation Ideas Graphics
This is a cash flow statement kpis ppt powerpoint presentation ideas graphics. This is a four stage process. The stages in this process are operation, financing activities, net increase in cash, investing activities, business.
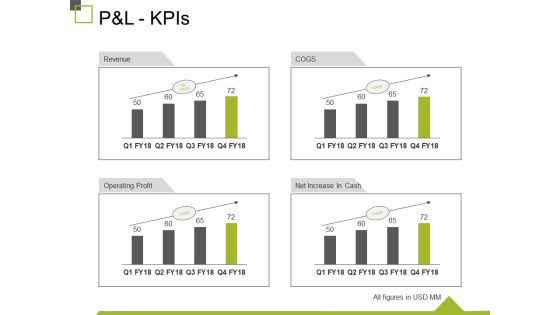
P And L Kpis Ppt PowerPoint Presentation Show Design Inspiration
This is a p and l kpis ppt powerpoint presentation show design inspiration. This is a four stage process. The stages in this process are revenue, operating profit, cogs, net increase in cash, business.

Cash Flow Statement Kpis Template 2 Ppt PowerPoint Presentation Layouts Visuals
This is a cash flow statement kpis template 2 ppt powerpoint presentation layouts visuals. This is a four stage process. The stages in this process are operations, financial activities, investing activities, net increase in cash.
P And L Kpis Template 2 Ppt PowerPoint Presentation Summary Icon
This is a p and l kpis template 2 ppt powerpoint presentation summary icon. This is a four stage process. The stages in this process are revenue, cogs, operating profit, net profit.
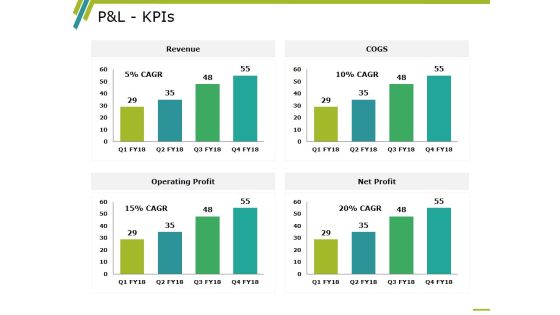
P And L Kpis Template 2 Ppt PowerPoint Presentation Professional Information
This is a p and l kpis template 2 ppt powerpoint presentation professional information. This is a four stage process. The stages in this process are revenue, operating profit, cogs, net profit, business.

Cash Flow Statement - Kpis Ppt PowerPoint Presentation Layouts Graphics Template
This is a cash flow statement - kpis ppt powerpoint presentation layouts graphics template. This is a four stage process. The stages in this process are operations, financing activities, investing activities, net increase in cash.
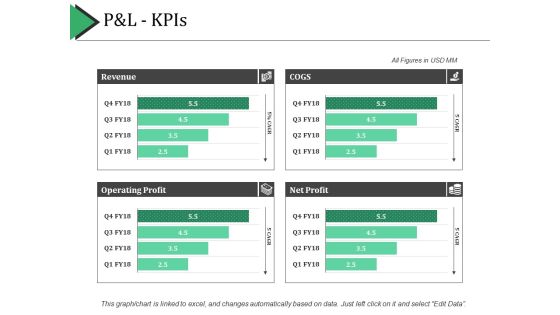
P And L Kpis Ppt PowerPoint Presentation Show Example Introduction
This is a p and l kpis ppt powerpoint presentation show example introduction. This is a four stage process. The stages in this process are revenue, cogs, net profit, operating profit.

Pandl Kpis Ppt PowerPoint Presentation Professional Backgrounds
This is a pandl kpis ppt powerpoint presentation professional backgrounds. This is a four stage process. The stages in this process are business, revenue, operating profit, cogs, net profit.

Cash Flow Statement Graphical Representation Ppt PowerPoint Presentation Professional Graphics Tutorials
This is a cash flow statement graphical representation ppt powerpoint presentation professional graphics tutorials. This is a four stage process. The stages in this process are business, operations, financing activities, net increase in cash, investing activities.

Income Statement Graphical Representation Ppt PowerPoint Presentation Pictures Design Templates
This is a income statement graphical representation ppt powerpoint presentation pictures design templates. This is a four stage process. The stages in this process are revenue, operating profit, net profit, cogs, business.

Cash Flow Statement Graphical Representation Ppt PowerPoint Presentation Professional Show
This is a cash flow statement graphical representation ppt powerpoint presentation professional show. This is a four stage process. The stages in this process are business, operations, investing activities, net increase in cash, financing activities.

Cash Flow Statement Kpis Tabular Form Ppt PowerPoint Presentation Model Graphic Tips
This is a cash flow statement kpis tabular form ppt powerpoint presentation model graphic tips. This is a four stage process. The stages in this process are operations, investing activities, net increase in cash, financing activities.

 Home
Home