AI PPT Maker
Templates
PPT Bundles
Design Services
Business PPTs
Business Plan
Management
Strategy
Introduction PPT
Roadmap
Self Introduction
Timelines
Process
Marketing
Agenda
Technology
Medical
Startup Business Plan
Cyber Security
Dashboards
SWOT
Proposals
Education
Pitch Deck
Digital Marketing
KPIs
Project Management
Product Management
Artificial Intelligence
Target Market
Communication
Supply Chain
Google Slides
Research Services
 One Pagers
All Categories
-
Home
- Customer Favorites
- Employee Kpi Dashboard
Employee Kpi Dashboard

Annual B2C Business Review Dashboard Microsoft PDF
The following slide shows dashboard to help organizations arrange financial business indicators and communicate important companys information to key stakeholders. It includes sales, gross, operating and net profit and other major performance indicators. Showcasing this set of slides titled Annual B2C Business Review Dashboard Microsoft PDF. The topics addressed in these templates are Gross Profit, Sales, Operating Profit. All the content presented in this PPT design is completely editable. Download it and make adjustments in color, background, font etc. as per your unique business setting.

Creating A Recruitment Dashboard Powerpoint Sample
This is a creating a recruitment dashboard powerpoint sample. This is a two stage process. The stages in this process are critical success factors, sourcing channels, recruiter efficiency, acceptance rate, key performance indicators, candidate, manager satisfaction, quality of hire, efficiency ratio.

Instagram Influencer Marketing Campaign Dashboard Background PDF
This slide represents key metrics dashboard to track and measure progress of Instagram influencer marketing campaign. It includes details related to KPIs such as impressions, likes, engagement rates etc. Whether you have daily or monthly meetings, a brilliant presentation is necessary. Instagram Influencer Marketing Campaign Dashboard Background PDF can be your best option for delivering a presentation. Represent everything in detail using Instagram Influencer Marketing Campaign Dashboard Background PDF and make yourself stand out in meetings. The template is versatile and follows a structure that will cater to your requirements. All the templates prepared by Slidegeeks are easy to download and edit. Our research experts have taken care of the corporate themes as well. So, give it a try and see the results.

Tiktok Advertising Campaign Management Dashboard Pictures PDF
This slide represents the key metrics dashboard to track and monitor the performance TikTok advertising campaign of enterprise. It includes details related to KPIs such as impressions, clicks, spend, CPC, CPM etc. Crafting an eye catching presentation has never been more straightforward. Let your presentation shine with this tasteful yet straightforward Tiktok Advertising Campaign Management Dashboard Pictures PDF template. It offers a minimalistic and classy look that is great for making a statement. The colors have been employed intelligently to add a bit of playfulness while still remaining professional. Construct the ideal Tiktok Advertising Campaign Management Dashboard Pictures PDF that effortlessly grabs the attention of your audience Begin now and be certain to wow your customers.

Dashboard To Track Extensive Diversity Training Status For Employees Developement Elements PDF
This slide showcases the dashboard to track current diversity training status in the organization. Key metrics included here are training cost actual and budgeted, cost per partcipant, number of participants every month, hours of training provided etc. Showcasing this set of slides titled Dashboard To Track Extensive Diversity Training Status For Employees Developement Elements PDF. The topics addressed in these templates are Training Cost, Budget, Occupancy Rate. All the content presented in this PPT design is completely editable. Download it and make adjustments in color, background, font etc. as per your unique business setting.
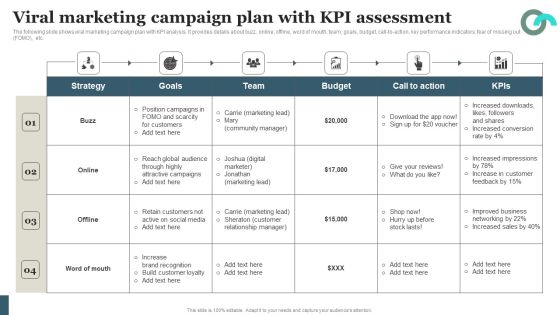
Viral Marketing Techniques To Increase Annual Business Sales Viral Marketing Campaign Plan With KPI Assessment Demonstration PDF
The following slide shows viral marketing campaign plan with KPI analysis. It provides details about buzz, online, offline, word of mouth, team, goals, budget, call-to-action, key performance indicators, fear of missing out FOMO, etc. Slidegeeks is here to make your presentations a breeze with Viral Marketing Techniques To Increase Annual Business Sales Viral Marketing Campaign Plan With KPI Assessment Demonstration PDF With our easy-to-use and customizable templates, you can focus on delivering your ideas rather than worrying about formatting. With a variety of designs to choose from, you are sure to find one that suits your needs. And with animations and unique photos, illustrations, and fonts, you can make your presentation pop. So whether you are giving a sales pitch or presenting to the board, make sure to check out Slidegeeks first

Debt Retrieval Techniques Understanding Our Cash Flow Statements Kpi Fy 20 21 Ppt Infographic Template Background Images PDF
Purpose of the following slide is to show the major key performing indicators of the organization , these KPIs can be the operation activities, cash flow from financing activities, investing activities and the net decrease in cash flow This is a debt retrieval techniques understanding our cash flow statements kpi fy 20 21 ppt infographic template background images pdf template with various stages. Focus and dispense information on four stages using this creative set, that comes with editable features. It contains large content boxes to add your information on topics like cash flow from operations, cash flow from investing activities, cash flow from financing activities, change in cash and cash equivalents. You can also showcase facts, figures, and other relevant content using this PPT layout. Grab it now.
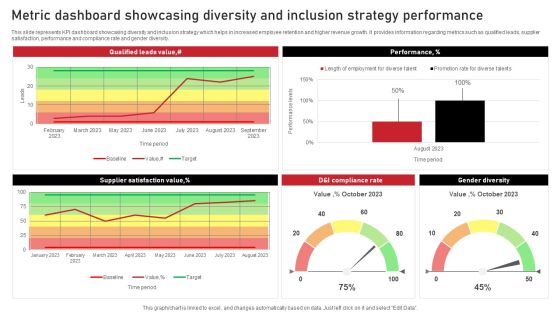
Metric Dashboard Showcasing Diversity And Inclusion Strategy Performance Background PDF
This slide represents KPI dashboard showcasing diversity and inclusion strategy which helps in increased employee retention and higher revenue growth. It provides information regarding metrics such as qualified leads, supplier satisfaction, performance and compliance rate and gender diversity. Showcasing this set of slides titled Metric Dashboard Showcasing Diversity And Inclusion Strategy Performance Background PDF. The topics addressed in these templates are Performance, Gender Diversity, Performance. All the content presented in this PPT design is completely editable. Download it and make adjustments in color, background, font etc. as per your unique business setting.

People Engagement Performance Dashboard With Variables Ppt Professional Styles PDF
This slide shows a People Engagement Performance Dashboard with variables such as engagement score, recognition rate, satisfaction rate, company knowledge rate and other key metrics of employee engagement. Deliver an awe-inspiring pitch with this creative people engagement performance dashboard with variables ppt professional styles pdf. bundle. Topics like 10 key metrics of employee engagement, employee engagement score can be discussed with this completely editable template. It is available for immediate download depending on the needs and requirements of the user.
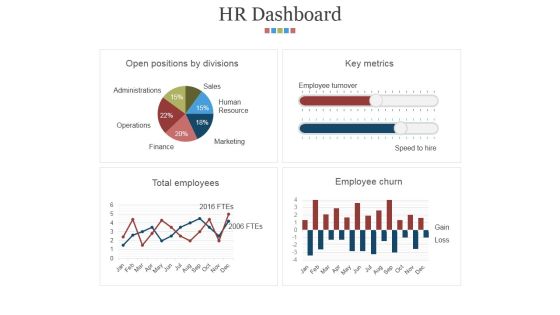
Hr Dashboard Template 2 Ppt PowerPoint Presentation Microsoft
This is a hr dashboard template 2 ppt powerpoint presentation microsoft. This is a four stage process. The stages in this process are open positions by divisions, key metrics, total employees, employee churn.
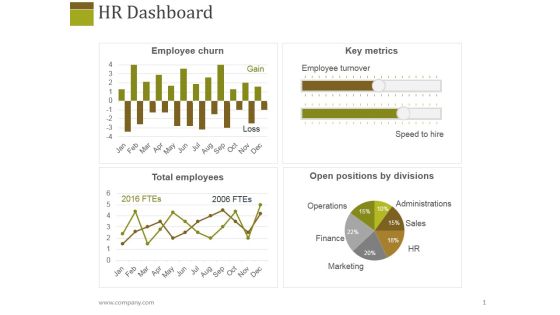
Hr Dashboard Template 1 Ppt PowerPoint Presentation Layouts Slideshow
This is a hr dashboard template 1 ppt powerpoint presentation layouts slideshow. This is a four stage process. The stages in this process are employee churn, key metrics, total employees, open positions by divisions.
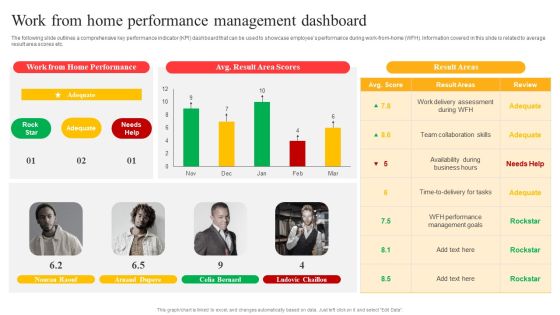
Flexible Working Policies And Guidelines Work From Home Performance Management Dashboard Introduction PDF
The following slide outlines a comprehensive key performance indicator KPI dashboard that can be used to showcase employees performance during work from home WFH. Information covered in this slide is related to average result area scores etc. There are so many reasons you need a Flexible Working Policies And Guidelines Work From Home Performance Management Dashboard Introduction PDF. The first reason is you cannot spend time making everything from scratch, Thus, Slidegeeks has made presentation templates for you too. You can easily download these templates from our website easily.

Call Center Metrics Dashboard With Average Queue Time Topics PDF
Mentioned slide outlines call center KPI dashboard which gives insights into customer agent performance. The KPI covered in the slide are total voicemail, average talk time, queue time, average quality rate, agent performance, etc. Pitch your topic with ease and precision using this Call Center Metrics Dashboard With Average Queue Time Topics PDF. This layout presents information on Efficiency, Quality, Activity. It is also available for immediate download and adjustment. So, changes can be made in the color, design, graphics or any other component to create a unique layout.

Human Resources Related Risk Metrics Dashboard Information PDF
This slide illustrates graphical representation of people key risk indicators. It includes indicators namely staff turnover, employee satisfaction, employee absenteeism etc. Pitch your topic with ease and precision using this Human Resources Related Risk Metrics Dashboard Information PDF. This layout presents information on Human Resources Related Risk Metrics Dashboard. It is also available for immediate download and adjustment. So, changes can be made in the color, design, graphics or any other component to create a unique layout.
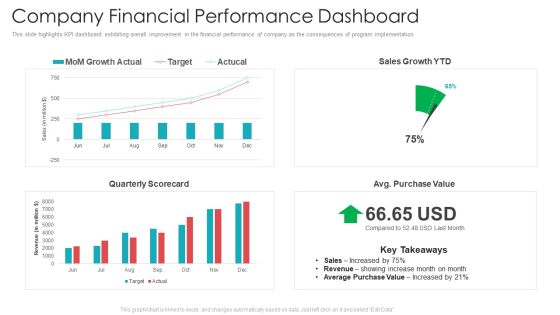
Official Team Collaboration Plan Company Financial Performance Dashboard Summary PDF
This slide highlights KPI dashboard exhibiting overall improvement in the financial performance of company as the consequences of program implementation. Deliver an awe-inspiring pitch with this creative official team collaboration plan company financial performance dashboard summary pdf bundle. Topics like company financial performance dashboard can be discussed with this completely editable template. It is available for immediate download depending on the needs and requirements of the user.
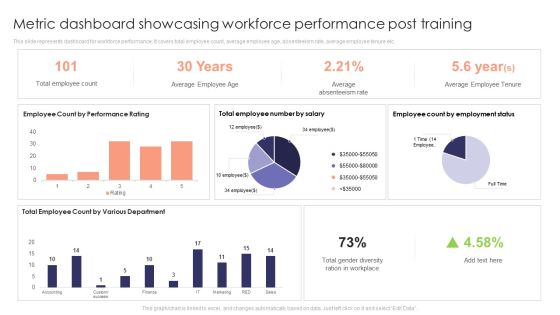
Metric Dashboard Showcasing Workforce Performance Post Training Ideas PDF
This slide represents dashboard for workforce performance. It covers total employee count, average employee age, absenteeism rate, average employee tenure etc. If you are looking for a format to display your unique thoughts, then the professionally designed Metric Dashboard Showcasing Workforce Performance Post Training Ideas PDF is the one for you. You can use it as a Google Slides template or a PowerPoint template. Incorporate impressive visuals, symbols, images, and other charts. Modify or reorganize the text boxes as you desire. Experiment with shade schemes and font pairings. Alter, share or cooperate with other people on your work. Download Metric Dashboard Showcasing Workforce Performance Post Training Ideas PDF and find out how to give a successful presentation. Present a perfect display to your team and make your presentation unforgettable.

Data Driven Marketing Campaigns Key Metrics Dashboard Microsoft PDF
This slide represents the KPI dashboard to track and monitor performance of data driven marketing campaigns launched by the marketing team. It includes details related to conversions by google ads, Facebook and Instagram etc. There are so many reasons you need a Data Driven Marketing Campaigns Key Metrics Dashboard Microsoft PDF. The first reason is you can not spend time making everything from scratch, Thus, Slidegeeks has made presentation templates for you too. You can easily download these templates from our website easily.

Product Engineering Performance And Development Metrics Dashboard Topics PDF
This slide covers product engineering and development KPI dashboard to improve effectiveness. It involves data such as product development team, average result area scores and key result areas. Showcasing this set of slides titled Product Engineering Performance And Development Metrics Dashboard Topics PDF. The topics addressed in these templates are Product Development Team, Average, Cost. All the content presented in this PPT design is completely editable. Download it and make adjustments in color, background, font etc. as per your unique business setting.
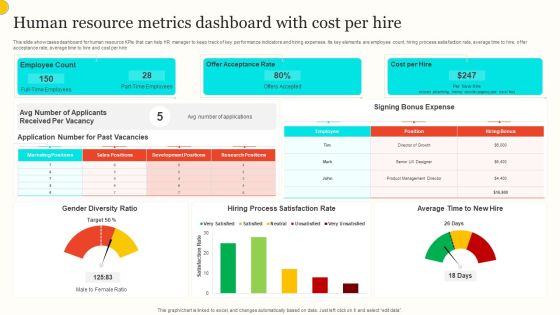
Human Resource Metrics Dashboard With Cost Per Hire Portrait PDF
This slide showcases dashboard for human resource KPIs that can help HR manager to keep track of key performance indicators and hiring expenses. Its key elements are employee count, hiring process satisfaction rate, average time to hire, offer acceptance rate, average time to hire and cost per hire. Showcasing this set of slides titled Human Resource Metrics Dashboard With Cost Per Hire Portrait PDF. The topics addressed in these templates are Employee Count, Offer Acceptance Rate, Cost Per Hire. All the content presented in this PPT design is completely editable. Download it and make adjustments in color, background, font etc. as per your unique business setting.

Call Center Kpis Dashboard With Routine Tasks Structure PDF
This slide covers contact center daily operational metrics KPI dashboard. It involves metrics such as ticket status, ticket solved by agents, response time and full resolution time. Pitch your topic with ease and precision using this Call Center Kpis Dashboard With Routine Tasks Structure PDF. This layout presents information on Agent, Response Time, Routine Tasks. It is also available for immediate download and adjustment. So, changes can be made in the color, design, graphics or any other component to create a unique layout.

Call Center Kpis Dashboard With Data Graphics PDF
This slide covers contact center team performance metrics KPI dashboard. It involves details such as resolutions, response time, call data management and daily response time. Showcasing this set of slides titled Call Center Kpis Dashboard With Data Graphics PDF. The topics addressed in these templates are Response Time, Data Management, Resolution Rate. All the content presented in this PPT design is completely editable. Download it and make adjustments in color, background, font etc. as per your unique business setting.
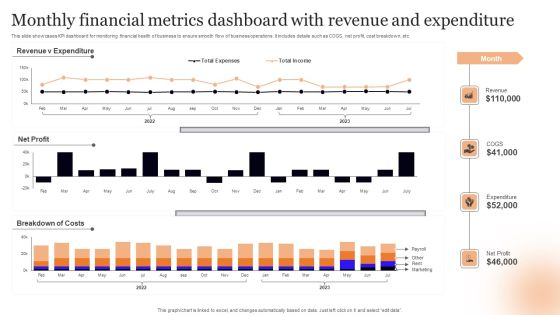
Monthly Financial Metrics Dashboard With Revenue And Expenditure Rules PDF
This slide showcases KPI dashboard for monitoring financial health of business to ensure smooth flow of business operations. It includes details such as COGS, net profit, cost breakdown, etc. Showcasing this set of slides titled Monthly Financial Metrics Dashboard With Revenue And Expenditure Rules PDF. The topics addressed in these templates are Net Profit, Costs, Expenditure. All the content presented in this PPT design is completely editable. Download it and make adjustments in color, background, font etc. as per your unique business setting.

Metric Dashboard Showcasing Workplace Gender Diversity Microsoft PDF
This slide represents KPI dashboard showcasing workplace gender diversity which helps uncover potential inequalities in workplace . It provides information regarding marital status, ethnicity, average tenure by gender and age. Showcasing this set of slides titled Metric Dashboard Showcasing Workplace Gender Diversity Microsoft PDF. The topics addressed in these templates are Marital Status, Ethnicity, Average. All the content presented in this PPT design is completely editable. Download it and make adjustments in color, background, font etc. as per your unique business setting.
Online Customer Interaction Loyalty Program Performance Tracking Dashboard Rules PDF
This slide covers the KPI dashboard for analyzing customer loyalty campaign results. It includes metrics such as revenue, liability, NQP accrued, transaction count, members, redemption ratio, etc.Deliver an awe inspiring pitch with this creative Online Customer Interaction Loyalty Program Performance Tracking Dashboard Rules PDF bundle. Topics like Revenue Liability, Transaction Count, Redemption Ratio can be discussed with this completely editable template. It is available for immediate download depending on the needs and requirements of the user.
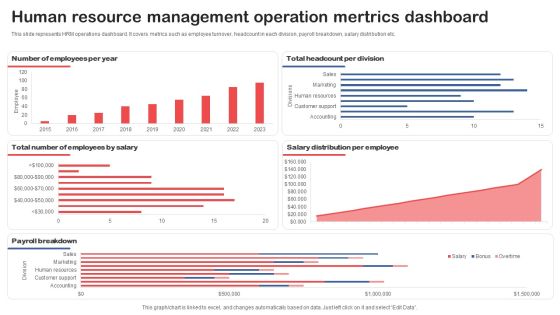
Human Resource Management Operation Mertrics Dashboard Background PDF
This slide represents HRM operations dashboard. It covers metrics such as employee turnover, headcount in each division, payroll breakdown, salary distribution etc. Pitch your topic with ease and precision using thisHuman Resource Management Operation Mertrics Dashboard Background PDF. This layout presents information on Number Of Employees, Headcount Per Division, Employees By Salary. It is also available for immediate download and adjustment. So, changes can be made in the color, design, graphics or any other component to create a unique layout.
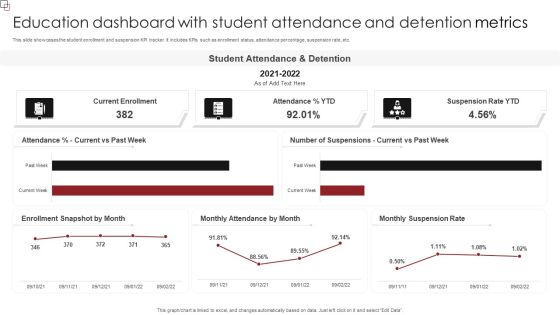
Education Dashboard With Student Attendance And Detention Metrics Inspiration PDF
This slide showcases the student enrollment and suspension KPI tracker. It includes KPIs such as enrollment status, attendance percentage, suspension rate, etc. Pitch your topic with ease and precision using this Education Dashboard With Student Attendance And Detention Metrics Inspiration PDF. This layout presents information on Student Attendance, Suspension Rate YTD, Current Enrollment. It is also available for immediate download and adjustment. So, changes can be made in the color, design, graphics or any other component to create a unique layout.
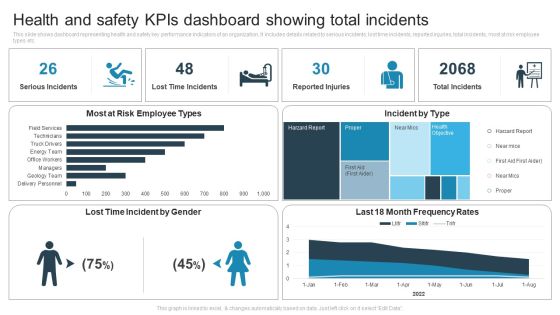
Health And Safety Kpis Dashboard Showing Total Incidents Pictures PDF
This slide shows dashboard representing health and safety key performance indicators of an organization. It includes details related to serious incidents, lost time incidents, reported injuries, total incidents, most at risk employee types etc. Showcasing this set of slides titled Health And Safety Kpis Dashboard Showing Total Incidents Pictures PDF. The topics addressed in these templates are Lost Time Incident, Most At Risk Employee, Incident By Type. All the content presented in this PPT design is completely editable. Download it and make adjustments in color, background, font etc. as per your unique business setting.
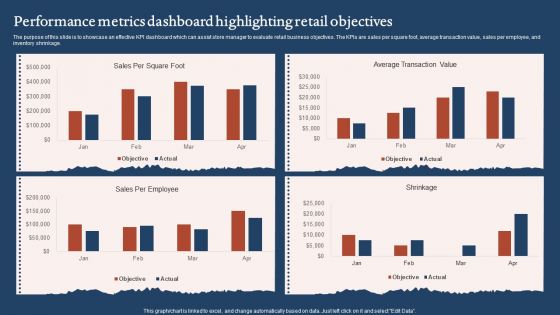
Performance Metrics Dashboard Highlighting Retail Objectives Sample PDF
The purpose of this slide is to showcase an effective KPI dashboard which can assist store manager to evaluate retail business objectives. The KPIs are sales per square foot, average transaction value, sales per employee, and inventory shrinkage. Pitch your topic with ease and precision using this Performance Metrics Dashboard Highlighting Retail Objectives Sample PDF. This layout presents information on Average Transaction Value, Sales Per Employee. It is also available for immediate download and adjustment. So, changes can be made in the color, design, graphics or any other component to create a unique layout.

Call Center Kpis Dashboard For Chat Management Graphics PDF
This slide covers contact center KPI dashboard for chat management. It involves details such as chats over time by site, location and language, total number of chats, average response time by employees. Showcasing this set of slides titled Call Center Kpis Dashboard For Chat Management Graphics PDF. The topics addressed in these templates are Management, Employees, Chats. All the content presented in this PPT design is completely editable. Download it and make adjustments in color, background, font etc. as per your unique business setting.

Dashboard For Tracking Customer Service Team Performance Clipart PDF
This slide covers the KPI dashboard for analyzing the performance of client support department. It includes metrics such as first call resolution, unresolved calls, average response rate, the best day to call, average time to solve issues, etc. Deliver an awe inspiring pitch with this creative Dashboard For Tracking Customer Service Team Performance Clipart PDF bundle. Topics like Dashboard For Tracking Customer, Service Team Performance can be discussed with this completely editable template. It is available for immediate download depending on the needs and requirements of the user.

Dashboard For Tracking Customer Service Team Performance Information PDF
This slide covers the KPI dashboard for analyzing the performance of client support department. It includes metrics such as first call resolution, unresolved calls, average response rate, the best day to call, average time to solve issues, etc. Deliver an awe inspiring pitch with this creative Dashboard For Tracking Customer Service Team Performance Information PDF bundle. Topics like Dashboard For Tracking Customer, Service Team Performance can be discussed with this completely editable template. It is available for immediate download depending on the needs and requirements of the user.

Call Center Metrics Dashboard With Average Response Time Inspiration PDF
Mentioned slide outlines KPI dashboard which can be used by call center to measure the performance of their agents. The key metrics highlighted in the dashboard are first call resolution, daily abandonment rate, total number of calls by topic, top performing call agents etc. Showcasing this set of slides titled Call Center Metrics Dashboard With Average Response Time Inspiration PDF. The topics addressed in these templates are Efficiency, Quality, Activity, Daily Average Response, Daily Average Transfer. All the content presented in this PPT design is completely editable. Download it and make adjustments in color, background, font etc. as per your unique business setting.

Dashboard For Tracking Aftersales Customer Services Team Performance Designs PDF
This slide covers the KPI dashboard for ticket tracking. It includes metrics such as tickets by month, service level, and details of customer service department agents. Boost your pitch with our creative Dashboard For Tracking Aftersales Customer Services Team Performance Designs PDF. Deliver an awe inspiring pitch that will mesmerize everyone. Using these presentation templates you will surely catch everyones attention. You can browse the ppts collection on our website. We have researchers who are experts at creating the right content for the templates. So you do not have to invest time in any additional work. Just grab the template now and use them.
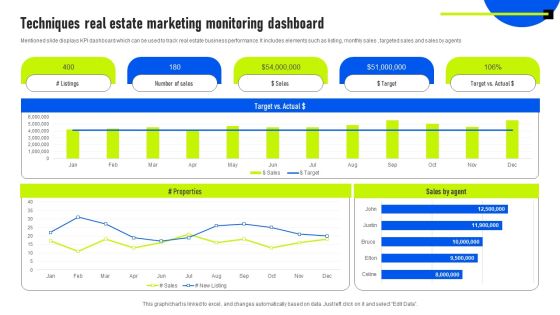
Techniques Real Estate Marketing Monitoring Dashboard Guidelines PDF
Mentioned slide displays KPI dashboard which can be used to track real estate business performance. It includes elements such as listing, monthly sales , targeted sales and sales by agents. Pitch your topic with ease and precision using this Techniques Real Estate Marketing Monitoring Dashboard Guidelines PDF. This layout presents information on Sales By Agent, Target, Marketing Monitoring Dashboard. It is also available for immediate download and adjustment. So, changes can be made in the color, design, graphics or any other component to create a unique layout.

Enterprise Workforce Performance Dashboard With Sprint Review Themes PDF
This slide illustrates project extended team KPI dashboard with sprints evaluation. It provides information about average cycle time, velocity history, sprint variance, capacity variance, committed variance, etc. Showcasing this set of slides titled Enterprise Workforce Performance Dashboard With Sprint Review Themes PDF. The topics addressed in these templates are Velocity History, Sprint Variance, Average Cycle, Time Per State. All the content presented in this PPT design is completely editable. Download it and make adjustments in color, background, font etc. as per your unique business setting.

Call Center Kpis Agent Performance Dashboard Clipart PDF
This slide covers contact center agent performance metrics KPI dashboard. It involves metrics such as number of calls, average response time, average hold time, daily average transfer rate and agents with most hold time and transfer rate. Showcasing this set of slides titled Call Center Kpis Agent Performance Dashboard Clipart PDF. The topics addressed in these templates are Transfer Rate, Call Center, Hold Time. All the content presented in this PPT design is completely editable. Download it and make adjustments in color, background, font etc. as per your unique business setting.
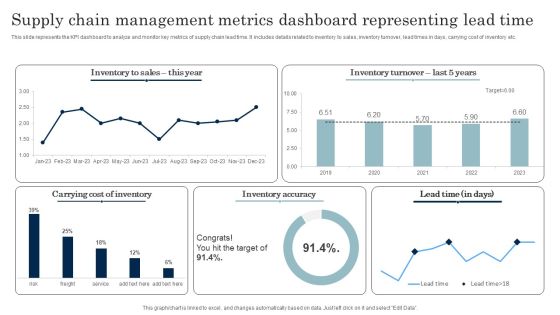
Supply Chain Management Metrics Dashboard Representing Lead Time Download PDF
This slide represents the KPI dashboard to analyze and monitor key metrics of supply chain lead time. It includes details related to inventory to sales, inventory turnover, lead times in days, carrying cost of inventory etc. Pitch your topic with ease and precision using this Supply Chain Management Metrics Dashboard Representing Lead Time Download PDF. This layout presents information on Inventory Accuracy, Carrying Cost Of Inventory. It is also available for immediate download and adjustment. So, changes can be made in the color, design, graphics or any other component to create a unique layout.

Metrics Dashboard Depicting Call Center Performance Pictures PDF
Mentioned slide outlines key performance indicator KPI dashboard which can be used by call center to optimize the agents performance. The major metrics covered in the template are total calls, average speed of answer, abandon rate, service level agreement SLA limit etc. Pitch your topic with ease and precision using this Metrics Dashboard Depicting Call Center Performance Pictures PDF. This layout presents information on Overall Satisfaction Score, Satisfaction Score, Performance. It is also available for immediate download and adjustment. So, changes can be made in the color, design, graphics or any other component to create a unique layout.
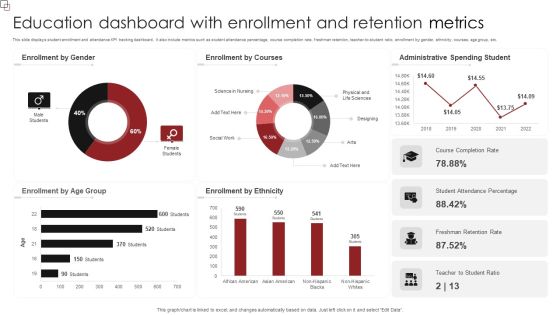
Education Dashboard With Enrollment And Retention Metrics Sample PDF
This slide displays student enrollment and attendance KPI tracking dashboard. It also include metrics such as student attendance percentage, course completion rate, freshman retention, teacher-to-student ratio, enrollment by gender, ethnicity, courses, age group, etc. Pitch your topic with ease and precision using this Education Dashboard With Enrollment And Retention Metrics Sample PDF. This layout presents information on Enrollment Gender, Enrollment Courses, Administrative Spending Student. It is also available for immediate download and adjustment. So, changes can be made in the color, design, graphics or any other component to create a unique layout.

Call Center Metrics Dashboard With First Response Time Background PDF
Mentioned slide outlines a KPI dashboard which can be used by call centers for the ticket system. Tickets created, unassigned, open, solved, escalated, tickets solved by agents, first response and full resolution time are the key metrics highlighted in the slide. Pitch your topic with ease and precision using this Call Center Metrics Dashboard With First Response Time Background PDF. This layout presents information on First Response Time, First Resolution Time, Response Time. It is also available for immediate download and adjustment. So, changes can be made in the color, design, graphics or any other component to create a unique layout.

Call Center Metrics Dashboard Highlighting Service Level Infographics PDF
Mentioned slide outlines comprehensive call center KPI dashboard. Information covered in this slide is related to various metrics such as queue calls, support and billing service level, inbound volume, outbound volume etc. Pitch your topic with ease and precision using this Call Center Metrics Dashboard Highlighting Service Level Infographics PDF. This layout presents information on All Agents, Queue Calls, Billing Service Level. It is also available for immediate download and adjustment. So, changes can be made in the color, design, graphics or any other component to create a unique layout.

Work Order Management Metric Dashboard Organization Physical Assets Template PDF
This slide represents KPI dashboard for work tracking and management. It covers metrics such as project health, time status, tasks, cost, progress and workload. Boost your pitch with our creative Work Order Management Metric Dashboard Organization Physical Assets Template PDF. Deliver an awe-inspiring pitch that will mesmerize everyone. Using these presentation templates you will surely catch everyones attention. You can browse the ppts collection on our website. We have researchers who are experts at creating the right content for the templates. So you do not have to invest time in any additional work. Just grab the template now and use them.

Metric Dashboard To Track Supplier Diversity And Performance Designs PDF
This slide represents KPI dashboard for tracking supplier diversity in organization and measure performance. It provides information regarding organization spending cost, supplier count, diversity type, status etc. Pitch your topic with ease and precision using this Metric Dashboard To Track Supplier Diversity And Performance Designs PDF. This layout presents information on Diversity Type, Diversity Status, Diverse Supplier. It is also available for immediate download and adjustment. So, changes can be made in the color, design, graphics or any other component to create a unique layout.
Facebook Ad Campaign Performance Tracking Dashboard Microsoft PDF
This slide represents the KPI dashboard to effectively measure and monitor performance of Facebook marketing campaign conducted by the organization to enhance customer engagement. It includes details related to KPIs such as ad impressions, ad reach etc. From laying roadmaps to briefing everything in detail, our templates are perfect for you. You can set the stage with your presentation slides. All you have to do is download these easy-to-edit and customizable templates. Facebook Ad Campaign Performance Tracking Dashboard Microsoft PDF will help you deliver an outstanding performance that everyone would remember and praise you for. Do download this presentation today.

Hospital Management System Dashboard With Clinical Trials Background PDF
This slide covers hospital management system KPI dashboard with clinical trials. It involves details such as phase trials, trials by year and trials by status. Take your projects to the next level with our ultimate collection of Hospital Management System Dashboard With Clinical Trials Background PDF. Slidegeeks has designed a range of layouts that are perfect for representing task or activity duration, keeping track of all your deadlines at a glance. Tailor these designs to your exact needs and give them a truly corporate look with your own brand colors they will make your projects stand out from the rest.
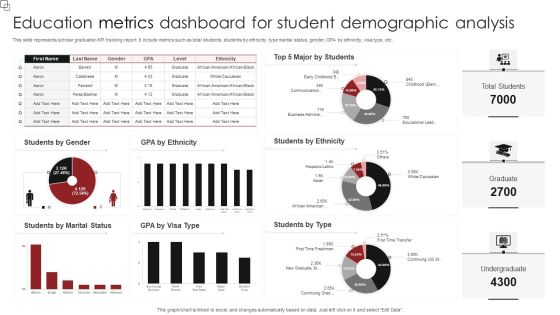
Education Metrics Dashboard For Student Demographic Analysis Diagrams PDF
This slide represents scholar graduation KPI tracking report. It include metrics such as total students, students by ethnicity, type marital status, gender, GPA by ethnicity, visa type, etc. Showcasing this set of slides titled Education Metrics Dashboard For Student Demographic Analysis Diagrams PDF. The topics addressed in these templates are Students Ethnicity, Students Type, Students Marital Status. All the content presented in this PPT design is completely editable. Download it and make adjustments in color, background, font etc. as per your unique business setting.
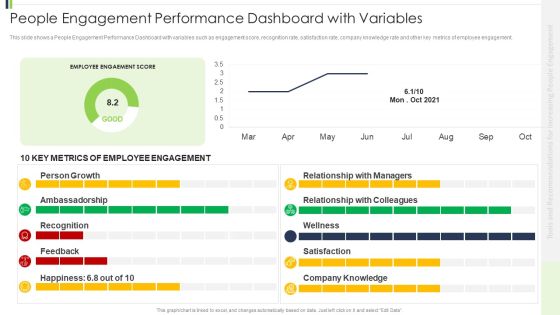
People Engagement Performance Dashboard With Variables Sample PDF
This slide shows a People Engagement Performance Dashboard with variables such as engagement score, recognition rate, satisfaction rate, company knowledge rate and other key metrics of employee engagement. Deliver an awe inspiring pitch with this creative people engagement performance dashboard with variables sample pdf bundle. Topics likeperson growth, ambassadorship, recognition can be discussed with this completely editable template. It is available for immediate download depending on the needs and requirements of the user.

Project Metrics Dashboard With Monthly Workload Topics PDF
This slide shows the project management dashboard which covers the number of tasks completed in last one week, return on investment on overall project, milestones covered, performance of employees, tasks created, competed, work in progress, started, etc. Pitch your topic with ease and precision using this Project Metrics Dashboard With Monthly Workload Topics PDF. This layout presents information on Investment, Employee Performance, Project Metrics Dashboard. It is also available for immediate download and adjustment. So, changes can be made in the color, design, graphics or any other component to create a unique layout.
Year End HR Attrition Dashboard With Major Kpis Demonstration PDF
Following dashboard presents the current status of employee turnover which can be used by managers to plan for new recruitments beforehand. The key performance indicators are current employees, newly hired, transfers, offboarding, turnover rate, retention rate etc. Persuade your audience using this Year End HR Attrition Dashboard With Major Kpis Demonstration PDF. This PPT design covers one stages, thus making it a great tool to use. It also caters to a variety of topics including Retention Rate, Turnover Rate, Offboarding. Download this PPT design now to present a convincing pitch that not only emphasizes the topic but also showcases your presentation skills.

Staff Turnover Key Performance Indicators Dashboard Sample PDF
The following slide highlights the staff turnover key performance Indicators dashboard illustrating employee turn over, turn over rate, average tenure, turnover per quarter, turnover per department, turnover type, turnover time period, turnover per position and turnover reasons Deliver and pitch your topic in the best possible manner with this Staff Turnover Key Performance Indicators Dashboard Sample PDF Use them to share invaluable insights on Management Goals, Subjective Appraisal, Product Defects and impress your audience. This template can be altered and modified as per your expectations. So, grab it now.

Enterprise Sustainability Performance Metrics Real Time Utilization Dashboard Portrait PDF
This slide covers real time utilization dashboard covering logged time such as billable, non-billable, estimated time and scheduled. It also include details of allotted hours to each employee and weekly hours for the assignment.Deliver and pitch your topic in the best possible manner with this Enterprise Sustainability Performance Metrics Real Time Utilization Dashboard Portrait PDF. Use them to share invaluable insights on Real Time, Utilization Dashboard and impress your audience. This template can be altered and modified as per your expectations. So, grab it now.

Dashboard For Tracking Aftersales Customer Services Team Performance Pictures PDF
This slide covers the KPI dashboard for ticket tracking. It includes metrics such as tickets by month, service level, and details of customer service department agents. Here you can discover an assortment of the finest PowerPoint and Google Slides templates. With these templates, you can create presentations for a variety of purposes while simultaneously providing your audience with an eye catching visual experience. Download Dashboard For Tracking Aftersales Customer Services Team Performance Pictures PDF to deliver an impeccable presentation. These templates will make your job of preparing presentations much quicker, yet still, maintain a high level of quality. Slidegeeks has experienced researchers who prepare these templates and write high quality content for you. Later on, you can personalize the content by editing the Dashboard For Tracking Aftersales Customer Services Team Performance Pictures PDF.

Revenue Performance And Risk Metrics Dashboard Demonstration PDF
This slide illustrates graphical representation of risk key performance indicators. It includes revenue performance of business units with their risk expenditure and people KRIs like employee job satisfaction, customer satisfaction etc. Showcasing this set of slides titled Revenue Performance And Risk Metrics Dashboard Demonstration PDF. The topics addressed in these templates are Total Risk Expenditure, Risk Management, Revenue Performance . All the content presented in this PPT design is completely editable. Download it and make adjustments in color, background, font etc. as per your unique business setting.

Customer Service Metrics Dashboard With Average Response Time Formats PDF
This slide showcases KPI dashboard for customer service that can help to evaluate the performance of call center agents and identify issues arising from different channels. Its key components are number of issues in last 1 day, average time to closes, first call resolution, daily average response time, average time to close by channel and top performing call agents. Pitch your topic with ease and precision using this Customer Service Metrics Dashboard With Average Response Time Formats PDF. This layout presents information on Customer Service, Metrics Dashboard, Average Response Time. It is also available for immediate download and adjustment. So, changes can be made in the color, design, graphics or any other component to create a unique layout.
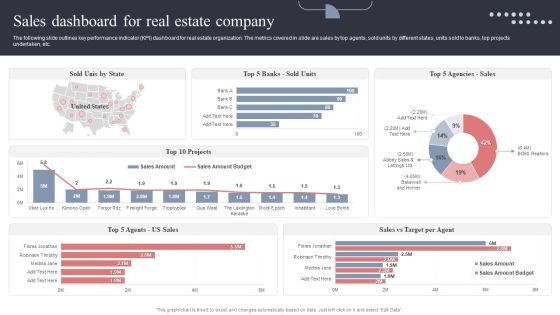
Sales Dashboard For Real Estate Company Topics PDF
The following slide outlines key performance indicator KPI dashboard for real estate organization. The metrics covered in slide are sales by top agents, sold units by different states, units sold to banks, top projects undertaken, etc. This Sales Dashboard For Real Estate Company Topics PDF is perfect for any presentation, be it in front of clients or colleagues. It is a versatile and stylish solution for organizing your meetings. The Sales Dashboard For Real Estate Company Topics PDF features a modern design for your presentation meetings. The adjustable and customizable slides provide unlimited possibilities for acing up your presentation. Slidegeeks has done all the homework before launching the product for you. So, do not wait, grab the presentation templates today

Human Resource Recruitment Funnel Dashboard With Metrics Summary PDF
This slide showcases KPIs dashboard of human resource recruitment that can help to track the employee hiring process using funnel. Its key components are time to hire, time to fill days and recruitment cost. Showcasing this set of slides titled Human Resource Recruitment Funnel Dashboard With Metrics Summary PDF. The topics addressed in these templates are Recruitment Funnel, Male Female Ratio, Age Applicants. All the content presented in this PPT design is completely editable. Download it and make adjustments in color, background, font etc. as per your unique business setting.

Dashboard For Tracking Aftersales Customer Services Team Performance Portrait PDF
This slide covers the KPI dashboard for ticket tracking. It includes metrics such as tickets by month, service level, and details of customer service department agents. Retrieve professionally designed Dashboard For Tracking Aftersales Customer Services Team Performance Portrait PDF to effectively convey your message and captivate your listeners. Save time by selecting pre-made slideshows that are appropriate for various topics, from business to educational purposes. These themes come in many different styles, from creative to corporate, and all of them are easily adjustable and can be edited quickly. Access them as PowerPoint templates or as Google Slides themes. You do not have to go on a hunt for the perfect presentation because Slidegeeks got you covered from everywhere.
Tiktok Marketing Campaign Performance Tracking Dashboard Background PDF
This slide represents the KPI dashboard to effective track and monitor TikTok marketing campaign conducted by the organization. It includes KPIs such as total cost, impressions, reach, clicks etc. Coming up with a presentation necessitates that the majority of the effort goes into the content and the message you intend to convey. The visuals of a PowerPoint presentation can only be effective if it supplements and supports the story that is being told. Keeping this in mind our experts created Tiktok Marketing Campaign Performance Tracking Dashboard Background PDF to reduce the time that goes into designing the presentation. This way, you can concentrate on the message while our designers take care of providing you with the right template for the situation.
Facebook Ad Campaign Performance Tracking Dashboard Ppt Show Picture PDF
This slide represents the KPI dashboard to effectively measure and monitor performance of Facebook marketing campaign conducted by the organization to enhance customer engagement. It includes details related to KPIs such as ad impressions, ad reach etc. Are you in need of a template that can accommodate all of your creative concepts This one is crafted professionally and can be altered to fit any style. Use it with Google Slides or PowerPoint. Include striking photographs, symbols, depictions, and other visuals. Fill, move around, or remove text boxes as desired. Test out color palettes and font mixtures. Edit and save your work, or work with colleagues. Download Facebook Ad Campaign Performance Tracking Dashboard Ppt Show Picture PDF and observe how to make your presentation outstanding. Give an impeccable presentation to your group and make your presentation unforgettable.
Facebook Ad Campaign Performance Tracking Dashboard Ppt Ideas Objects PDF
This slide represents the KPI dashboard to effectively measure and monitor performance of Facebook marketing campaign conducted by the organization to enhance customer engagement. It includes details related to KPIs such as ad impressions, ad reach etc. Are you in need of a template that can accommodate all of your creative concepts This one is crafted professionally and can be altered to fit any style. Use it with Google Slides or PowerPoint. Include striking photographs, symbols, depictions, and other visuals. Fill, move around, or remove text boxes as desired. Test out color palettes and font mixtures. Edit and save your work, or work with colleagues. Download Facebook Ad Campaign Performance Tracking Dashboard Ppt Ideas Objects PDF and observe how to make your presentation outstanding. Give an impeccable presentation to your group and make your presentation unforgettable.
