Efficiency Icons

Workplace Facility Management Services Company Facility Management Services Global Market Scenario Diagrams PDF
This slide highlights the facility management services market share and future growth rate in graphical format which showcases product life cycle of different countries and organized and unorganized sector future growth rate. Explore a selection of the finest Workplace Facility Management Services Company Facility Management Services Global Market Scenario Diagrams PDF here. With a plethora of professionally designed and pre made slide templates, you can quickly and easily find the right one for your upcoming presentation. You can use our Workplace Facility Management Services Company Facility Management Services Global Market Scenario Diagrams PDF to effectively convey your message to a wider audience. Slidegeeks has done a lot of research before preparing these presentation templates. The content can be personalized and the slides are highly editable. Grab templates today from Slidegeeks.

Kpi Dashboard To Monitor Sales Opportunities Strategic Promotion Plan To Improve Product Diagrams PDF
Mentioned slide shows the KPI dashboard that can be used to track win and lost sales opportunities. It includes metrics namely won opportunities, lost opportunities, pipeline by territory, total opportunities.Explore a selection of the finest Kpi Dashboard To Monitor Sales Opportunities Strategic Promotion Plan To Improve Product Diagrams PDF here. With a plethora of professionally designed and pre-made slide templates, you can quickly and easily find the right one for your upcoming presentation. You can use our Kpi Dashboard To Monitor Sales Opportunities Strategic Promotion Plan To Improve Product Diagrams PDF to effectively convey your message to a wider audience. Slidegeeks has done a lot of research before preparing these presentation templates. The content can be personalized and the slides are highly editable. Grab templates today from Slidegeeks.

Global Automotive Industry Research And Analysis Global Motor Vehicle Sales By Region Diagrams PDF
This slide covers a graphical representation of worldwide automobile sales for Europe, Asia, Africa, NAFTA, Central, and South America, etc. It also includes key insights about Chinese car sales expansion, USA sales, Indias sales, etc. Explore a selection of the finest Global Automotive Industry Research And Analysis Global Motor Vehicle Sales By Region Diagrams PDF here. With a plethora of professionally designed and pre made slide templates, you can quickly and easily find the right one for your upcoming presentation. You can use our Global Automotive Industry Research And Analysis Global Motor Vehicle Sales By Region Diagrams PDF to effectively convey your message to a wider audience. Slidegeeks has done a lot of research before preparing these presentation templates. The content can be personalized and the slides are highly editable. Grab templates today from Slidegeeks.
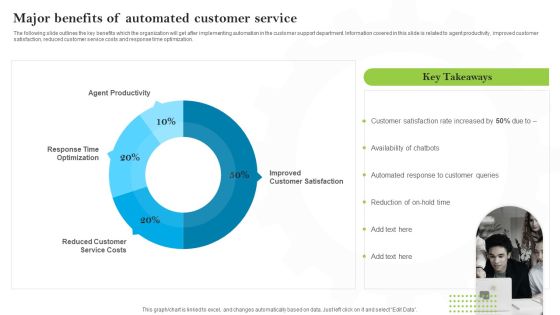
Introducing AI Tools Major Benefits Of Automated Customer Service Diagrams PDF
The following slide outlines the key benefits which the organization will get after implementing automation in the customer support department. Information covered in this slide is related to agent productivity, improved customer satisfaction, reduced customer service costs and response time optimization. Explore a selection of the finest Introducing AI Tools Major Benefits Of Automated Customer Service Diagrams PDF here. With a plethora of professionally designed and pre-made slide templates, you can quickly and easily find the right one for your upcoming presentation. You can use our Introducing AI Tools Major Benefits Of Automated Customer Service Diagrams PDF to effectively convey your message to a wider audience. Slidegeeks has done a lot of research before preparing these presentation templates. The content can be personalized and the slides are highly editable. Grab templates today from Slidegeeks.
Human Augmented Machine Learning IT Augmented Intelligence Information Tracking Dashboard Diagrams PDF
This slide depicts the information tracking dashboard by augmented intelligence model covering the data analysis. Data analysis includes image analysis, storage size, new users on the cloud platform, etc. Get a simple yet stunning designed Human Augmented Machine Learning IT Augmented Intelligence Information Tracking Dashboard Diagrams PDF. It is the best one to establish the tone in your meetings. It is an excellent way to make your presentations highly effective. So, download this PPT today from Slidegeeks and see the positive impacts. Our easy-to-edit Human Augmented Machine Learning IT Augmented Intelligence Information Tracking Dashboard Diagrams PDF can be your go-to option for all upcoming conferences and meetings. So, what are you waiting for. Grab this template today.
Performance Tracking Dashboard For 5G Architecture 5G Network Structure Diagrams PDF
This slide describes the performance tracking dashboard for 5G architecture by covering the details of subscribers, quality of experience, consumption, customer support, coverage, devices, and dimensions.Explore a selection of the finest Performance Tracking Dashboard For 5G Architecture 5G Network Structure Diagrams PDF here. With a plethora of professionally designed and pre-made slide templates, you can quickly and easily find the right one for your upcoming presentation. You can use our Performance Tracking Dashboard For 5G Architecture 5G Network Structure Diagrams PDF to effectively convey your message to a wider audience. Slidegeeks has done a lot of research before preparing these presentation templates. The content can be personalized and the slides are highly editable. Grab templates today from Slidegeeks.
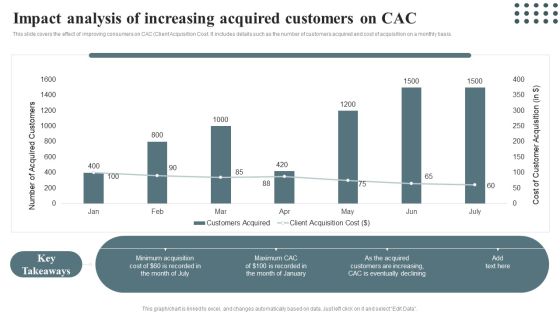
Techniques For Enhancing Buyer Acquisition Impact Analysis Of Increasing Acquired Customers Diagrams PDF
This slide covers the effect of improving consumers on CAC Client Acquisition Cost. It includes details such as the number of customers acquired and cost of acquisition on a monthly basis.Here you can discover an assortment of the finest PowerPoint and Google Slides templates. With these templates, you can create presentations for a variety of purposes while simultaneously providing your audience with an eye-catching visual experience. Download Techniques For Enhancing Buyer Acquisition Impact Analysis Of Increasing Acquired Customers Diagrams PDF to deliver an impeccable presentation. These templates will make your job of preparing presentations much quicker, yet still, maintain a high level of quality. Slidegeeks has experienced researchers who prepare these templates and write high-quality content for you. Later on, you can personalize the content by editing the Techniques For Enhancing Buyer Acquisition Impact Analysis Of Increasing Acquired Customers Diagrams PDF.

Omnichannel Distribution System To Satisfy Customer Needs Company Sales From Current Distribution Channels Diagrams PDF
This slide includes the graphical depiction of current distribution strategies of the company with revenue numbers from last 3 years. Company is currently using strategies like retail store based sales, personal selling, direct mail etc. Get a simple yet stunning designed Omnichannel Distribution System To Satisfy Customer Needs Company Sales From Current Distribution Channels Diagrams PDF. It is the best one to establish the tone in your meetings. It is an excellent way to make your presentations highly effective. So, download this PPT today from Slidegeeks and see the positive impacts. Our easy-to-edit Omnichannel Distribution System To Satisfy Customer Needs Company Sales From Current Distribution Channels Diagrams PDF can be your go-to option for all upcoming conferences and meetings. So, what are you waiting for Grab this template today.

Brand Awareness Metrics Social Or Non-Social Media Reach Comprehensive Guide For Brand Recognition Diagrams PDF
This slide provides information regarding social or non-social media reach as brand awareness metrics. It helps in assessing brand awareness and recall. The slide also include key initiatives to enhance brand reach. Get a simple yet stunning designed Brand Awareness Metrics Social Or Non-Social Media Reach Comprehensive Guide For Brand Recognition Diagrams PDF. It is the best one to establish the tone in your meetings. It is an excellent way to make your presentations highly effective. So, download this PPT today from Slidegeeks and see the positive impacts. Our easy-to-edit Brand Awareness Metrics Social Or Non-Social Media Reach Comprehensive Guide For Brand Recognition Diagrams PDF can be your go-to option for all upcoming conferences and meetings. So, what are you waiting for Grab this template today.
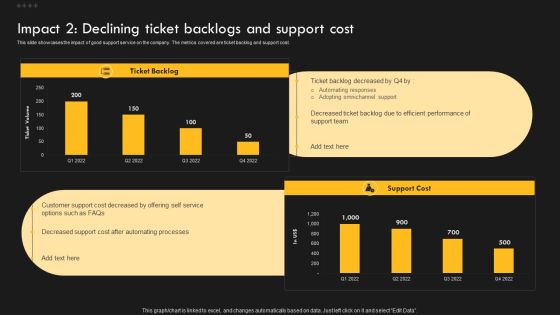
Service Improvement Techniques For Client Retention Impact 2 Declining Ticket Backlogs And Support Diagrams PDF
This slide showcases the impact of good support service on the company. The metrics covered are customer satisfaction and retention. Explore a selection of the finest Service Improvement Techniques For Client Retention Impact 2 Declining Ticket Backlogs And Support Diagrams PDF here. With a plethora of professionally designed and pre-made slide templates, you can quickly and easily find the right one for your upcoming presentation. You can use our Service Improvement Techniques For Client Retention Impact 2 Declining Ticket Backlogs And Support Diagrams PDF to effectively convey your message to a wider audience. Slidegeeks has done a lot of research before preparing these presentation templates. The content can be personalized and the slides are highly editable. Grab templates today from Slidegeeks.
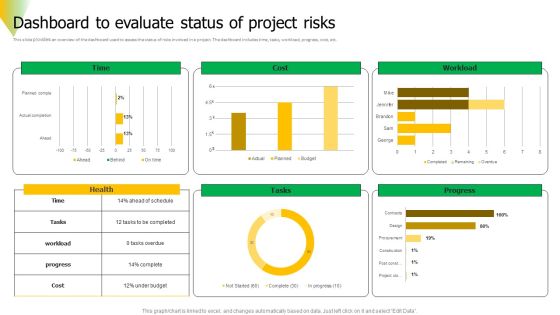
Risk Assessment Dashboard To Evaluate Status Of Project Risks Diagrams PDF
This slide provides an overview of the dashboard used to assess the status of risks involved in a project. The dashboard includes time, tasks, workload, progress, cost, etc. Get a simple yet stunning designed Risk Assessment Dashboard To Evaluate Status Of Project Risks Diagrams PDF. It is the best one to establish the tone in your meetings. It is an excellent way to make your presentations highly effective. So, download this PPT today from Slidegeeks and see the positive impacts. Our easy to edit Risk Assessment Dashboard To Evaluate Status Of Project Risks Diagrams PDF can be your go to option for all upcoming conferences and meetings. So, what are you waiting for Grab this template today.

Evaluating Current Marketing Performance Of Organization Ppt PowerPoint Presentation Diagram Templates PDF
This slide showcases overview of current marketing performance that can help organization to determine issues in current promotional campaigns. Its key elements are website traffic, marketing budget and product sales Explore a selection of the finest Evaluating Current Marketing Performance Of Organization Ppt PowerPoint Presentation Diagram Templates PDF here. With a plethora of professionally designed and pre made slide templates, you can quickly and easily find the right one for your upcoming presentation. You can use our Evaluating Current Marketing Performance Of Organization Ppt PowerPoint Presentation Diagram Templates PDF to effectively convey your message to a wider audience. Slidegeeks has done a lot of research before preparing these presentation templates. The content can be personalized and the slides are highly editable. Grab templates today from Slidegeeks.
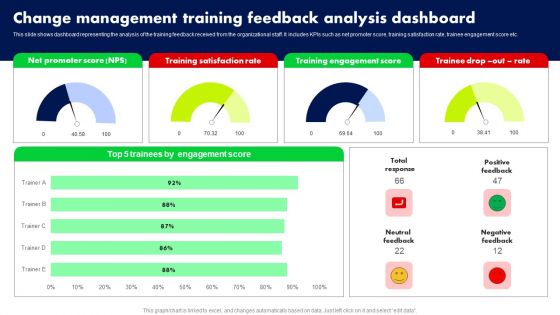
Change Management Training Feedback Analysis Dashboard Ppt PowerPoint Presentation File Diagrams PDF
This slide shows dashboard representing the analysis of the training feedback received from the organizational staff. It includes KPIs such as net promoter score, training satisfaction rate, trainee engagement score etc. Get a simple yet stunning designed Change Management Training Feedback Analysis Dashboard Ppt PowerPoint Presentation File Diagrams PDF. It is the best one to establish the tone in your meetings. It is an excellent way to make your presentations highly effective. So, download this PPT today from Slidegeeks and see the positive impacts. Our easy to edit Change Management Training Feedback Analysis Dashboard Ppt PowerPoint Presentation File Diagrams PDF can be your go to option for all upcoming conferences and meetings. So, what are you waiting for Grab this template today.

KPI Dashboard To Track Amazon Performance Ppt PowerPoint Presentation Diagram Lists PDF
This slide provides information regarding dashboard to monitor Amazon performance. The KPIs include tracking of product sales, conversion rate, advertising spends, session, organic sales, etc. Explore a selection of the finest KPI Dashboard To Track Amazon Performance Ppt PowerPoint Presentation Diagram Lists PDF here. With a plethora of professionally designed and pre made slide templates, you can quickly and easily find the right one for your upcoming presentation. You can use our KPI Dashboard To Track Amazon Performance Ppt PowerPoint Presentation Diagram Lists PDF to effectively convey your message to a wider audience. Slidegeeks has done a lot of research before preparing these presentation templates. The content can be personalized and the slides are highly editable. Grab templates today from Slidegeeks.

Market Size Of Information Technology Industry USA Ppt PowerPoint Presentation Diagram Lists PDF
The following slide showcases expected revenue and compound annual growth rate CAGR of IT industry in USA. Information covered in this statistical slide is related to project oriented services, IT outsourcing services, IT support and training services, and enterprise cloud computing services. Get a simple yet stunning designed Market Size Of Information Technology Industry USA Ppt PowerPoint Presentation Diagram Lists PDF. It is the best one to establish the tone in your meetings. It is an excellent way to make your presentations highly effective. So, download this PPT today from Slidegeeks and see the positive impacts. Our easy to edit Market Size Of Information Technology Industry USA Ppt PowerPoint Presentation Diagram Lists PDF can be your go to option for all upcoming conferences and meetings. So, what are you waiting for Grab this template today.

Executing Sales Risk Administration Procedure Major Factors Contributing Sales Risks Diagrams PDF
The following slide depicts some key drivers that elevate sales risks to define its scope and impact. It mainly includes elements such as rapid technology evolution, market fluctuation, market competition, risk management strategies along with key insights etc. Get a simple yet stunning designed Executing Sales Risk Administration Procedure Major Factors Contributing Sales Risks Diagrams PDF. It is the best one to establish the tone in your meetings. It is an excellent way to make your presentations highly effective. So, download this PPT today from Slidegeeks and see the positive impacts. Our easy to edit Executing Sales Risk Administration Procedure Major Factors Contributing Sales Risks Diagrams PDF can be your go to option for all upcoming conferences and meetings. So, what are you waiting for Grab this template today.

Key Elements That Are Considered While Developing Healthcare Budget Diagrams PDF
The following slide showcases the different factors affecting the healthcare spending. Information covered in this slide is related to technology, healthcare products and services, insurance coverage and change in patient volumes. Explore a selection of the finest Key Elements That Are Considered While Developing Healthcare Budget Diagrams PDF here. With a plethora of professionally designed and pre made slide templates, you can quickly and easily find the right one for your upcoming presentation. You can use our Key Elements That Are Considered While Developing Healthcare Budget Diagrams PDF to effectively convey your message to a wider audience. Slidegeeks has done a lot of research before preparing these presentation templates. The content can be personalized and the slides are highly editable. Grab templates today from Slidegeeks.
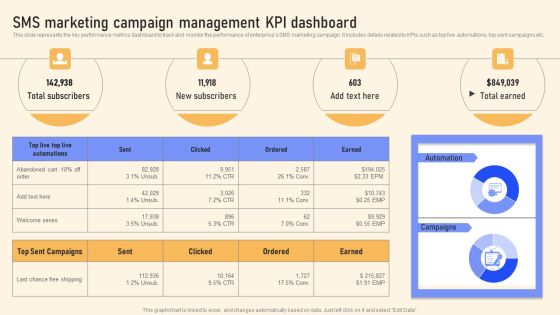
SMS Marketing Campaign Management KPI Dashboard Ppt PowerPoint Presentation Diagram Templates PDF
This slide represents the key performance metrics dashboard to track and monitor the performance of enterprises SMS marketing campaign. It includes details related to KPIs such as top live automations, top sent campaigns etc. Get a simple yet stunning designed SMS Marketing Campaign Management KPI Dashboard Ppt PowerPoint Presentation Diagram Templates PDF. It is the best one to establish the tone in your meetings. It is an excellent way to make your presentations highly effective. So, download this PPT today from Slidegeeks and see the positive impacts. Our easy to edit SMS Marketing Campaign Management KPI Dashboard Ppt PowerPoint Presentation Diagram Templates PDF can be your go to option for all upcoming conferences and meetings. So, what are you waiting for Grab this template today.
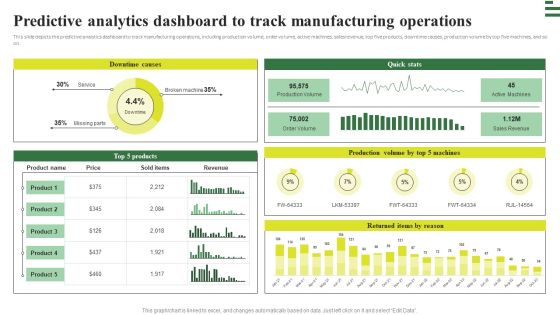
Transforming Manufacturing With Automation Predictive Analytics Dashboard To Track Diagrams PDF
This slide depicts the predictive analytics dashboard to track manufacturing operations, including production volume, order volume, active machines, sales revenue, top five products, downtime causes, production volume by top five machines, and so on. Get a simple yet stunning designed Transforming Manufacturing With Automation Predictive Analytics Dashboard To Track Diagrams PDF. It is the best one to establish the tone in your meetings. It is an excellent way to make your presentations highly effective. So, download this PPT today from Slidegeeks and see the positive impacts. Our easy to edit Transforming Manufacturing With Automation Predictive Analytics Dashboard To Track Diagrams PDF can be your go to option for all upcoming conferences and meetings. So, what are you waiting for Grab this template today.

Life Cycle Charts Technology Adoption Model PowerPoint Templates
Life_Cycle_Charts_Technology_Adoption_Model_PowerPoint_templates-These high quality powerpoint pre-designed slides and powerpoint templates have been carefully created by our professional team to help you impress your audience. All slides have been created and are 100% editable in powerpoint. Each and every property of any graphic - color, size, orientation, shading, outline etc. can be modified to help you build an effective powerpoint presentation. Any text can be entered at any point in the powerpoint template or slide. Simply DOWNLOAD, TYPE and PRESENT! These PowerPoint presentation slides can be used to represent themes relating to --Alone, apart, chasm, clipart, communication, concept, couple, crack, divide, divorce, estranged, female, figure, gap, gender, graphic, illustration, isolated, isolation, issues, loneliness, love, male, man, people, problems, romance, silhouette, stick, symbol, vector, woman-Life_Cycle_Charts_Technology_Adoption_Model_PowerPoint_templates

Technology Adoption Lifecycle Chart Table PowerPoint Ppt Slides
Technology_Adoption_LifeCycle_Chart_Table_PowerPoint_PPT_Slides-These high quality powerpoint pre-designed slides and powerpoint templates have been carefully created by our professional team to help you impress your audience. All slides have been created and are 100% editable in powerpoint. Each and every property of any graphic - color, size, orientation, shading, outline etc. can be modified to help you build an effective powerpoint presentation. Any text can be entered at any point in the powerpoint template or slide. Simply DOWNLOAD, TYPE and PRESENT! These PowerPoint presentation slides can be used to represent themes relating to --Alone, apart, chasm, clipart, communication, concept, couple, crack, divide, divorce, estranged, female, figure, gap, gender, graphic, illustration, isolated, isolation, issues, loneliness, love, male, man, people, problems, romance, silhouette, stick, symbol, vector, woman-Technology_Adoption_LifeCycle_Chart_Table_PowerPoint_PPT_Slides

3 Boxes Interrelated Diagram How To Write Business Plan Template PowerPoint Slides
We present our 3 boxes interrelated diagram how to write business plan template PowerPoint Slides.Download our Hexagon PowerPoint Templates because Our PowerPoint Templates and Slides will let you Leave a lasting impression to your audiences. They possess an inherent longstanding recall factor. Download our Circle Charts PowerPoint Templates because Our PowerPoint Templates and Slides help you meet the demand of the Market. Just browse and pick the slides that appeal to your intuitive senses. Download and present our Arrows PowerPoint Templates because Our PowerPoint Templates and Slides are specially created by a professional team with vast experience. They diligently strive to come up with the right vehicle for your brilliant Ideas. Use our Shapes PowerPoint Templates because Our PowerPoint Templates and Slides will fulfill your every need. Use them and effectively satisfy the desires of your audience. Download our Process and Flows PowerPoint Templates because You have a driving passion to excel in your field. Our PowerPoint Templates and Slides will prove ideal vehicles for your ideas.Use these PowerPoint slides for presentations relating to hexagon, hexagonal, 3d, colored, wheel, color, colorful, pattern, concentric, segment, polygon, saturation, isolated, sample, chromatic, spectrum, pantone, bright, circle, sampler, ring, guide, light, graphic, element, secondary, multicolored, palette, circular, six, round, shade, collection, reflection, design, set, organization, variation, example, effect, style, part, contrast, blender, mix, rainbow, brilliance. The prominent colors used in the PowerPoint template are Yellow, Blue, Green.

8 Stages Concentric Data Flow Diagram Ppt Business Plan Template PowerPoint Slides
We present our 8 stages concentric data flow diagram ppt business plan template PowerPoint Slides.Download our Business PowerPoint Templates because Our PowerPoint Templates and Slides will weave a web of your great ideas. They are gauranteed to attract even the most critical of your colleagues. Present our Circle Charts PowerPoint Templates because Our PowerPoint Templates and Slides are effectively colour coded to prioritise your plans They automatically highlight the sequence of events you desire. Download our Signs PowerPoint Templates because Our PowerPoint Templates and Slides will give you great value for your money. Be assured of finding the best projection to highlight your words. Present our Shapes PowerPoint Templates because Our PowerPoint Templates and Slides have the Brilliant backdrops. Guaranteed to illuminate the minds of your audience. Download our Metaphors-Visual Concepts PowerPoint Templates because Our PowerPoint Templates and Slides will effectively help you save your valuable time. They are readymade to fit into any presentation structure. Use these PowerPoint slides for presentations relating to radial, concentric, shine, pipe, line, environmental, circle, rendered, plastic, striped, shape, abstract, object, shiny, reflective, capsule, stripe, background, border, ecological, repetition. The prominent colors used in the PowerPoint template are Blue, Black, Gray.

Business Flow Diagrams Of Crayons Represent Innovative Concept Ppt PowerPoint Slides
We present our business flow diagrams of crayons represent innovative concept ppt PowerPoint Slides.Download our Communication PowerPoint Templates because Our PowerPoint Templates and Slides ensures Effective communication. They help you put across your views with precision and clarity. Use our Competition PowerPoint Templates because Our PowerPoint Templates and Slides will let Your superior ideas hit the target always and everytime. Use our Shapes PowerPoint Templates because Our PowerPoint Templates and Slides are topically designed to provide an attractive backdrop to any subject. Use our Circle Charts PowerPoint Templates because Watching this your Audience will Grab their eyeballs, they wont even blink. Present our Business PowerPoint Templates because Our PowerPoint Templates and Slides ensures Effective communication. They help you put across your views with precision and clarity.Use these PowerPoint slides for presentations relating to Pencil, isolated, wallpaper, decoration, vibrant, sketching, row, blank, concept, vector, line, spectrum, bright, template, circle, ring, graphic, pastel, drawing, paint, card, assortment, vertical, idea, equipment, multicolored, creative, arrangement, palette, illustration, object, wood, backdrop, design, group, tape, school, pointing, education, draw, art, stripe, wooden, instrument, college, rainbow. The prominent colors used in the PowerPoint template are Blue, Black, Gray.

Website Visitors Data Marketing Research Services Management Business Download Pdf
The following slide highlights the companys audience demographics distribution based on people age and gender to make business strategy for target market. Want to ace your presentation in front of a live audience Our Website Visitors Data Marketing Research Services Management Business Download Pdf can help you do that by engaging all the users towards you. Slidegeeks experts have put their efforts and expertise into creating these impeccable powerpoint presentations so that you can communicate your ideas clearly. Moreover, all the templates are customizable, and easy-to-edit and downloadable. Use these for both personal and commercial use.

Business Management Strategy Many Stages Organizational Diagram Development
We present our business management strategy many stages organizational diagram development.Download and present our Process and Flows PowerPoint Templates because Our PowerPoint Templates and Slides will give you great value for your money. Be assured of finding the best projection to highlight your words. Download and present our Business PowerPoint Templates because Your ideas provide food for thought. Our PowerPoint Templates and Slides will help you create a dish to tickle the most discerning palate. Download our Marketing PowerPoint Templates because Our PowerPoint Templates and Slides will let you Illuminate the road ahead to Pinpoint the important landmarks along the way. Use our Shapes PowerPoint Templates because It can Leverage your style with our PowerPoint Templates and Slides. Charm your audience with your ability. Download our Success PowerPoint Templates because It is Aesthetically crafted by artistic young minds. Our PowerPoint Templates and Slides are designed to display your dexterity.Use these PowerPoint slides for presentations relating to Arrangement, arrow, box, business, ceo, chart, circle, company,concept, connect, connection, copyspace, corporation, design, diagram, diamond,enterprise, flow, flowchart, hierarchy, illustration, job, level, link, linked,management, manager, network, office, organization, organizational, organize,position, post, pyramid, rectangle, relation, relationship, reporting, resources,shape, sign, square, structure, symbolic, teamwork, workflow. The prominent colors used in the PowerPoint template are Gray, Black, Blue.
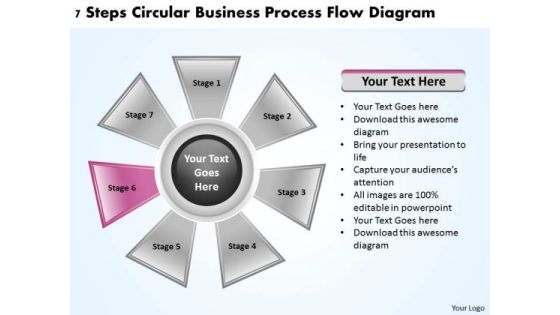
Business Process Strategy 7 Steps Circular Flow Diagram Ppt PowerPoint
We present our business process strategy 7 steps circular flow diagram ppt Powerpoint.Present our Success PowerPoint Templates because Our PowerPoint Templates and Slides will definately Enhance the stature of your presentation. Adorn the beauty of your thoughts with their colourful backgrounds. Download and present our Business PowerPoint Templates because It can Leverage your style with our PowerPoint Templates and Slides. Charm your audience with your ability. Download our Process and Flows PowerPoint Templates because You can Inspire your team with our PowerPoint Templates and Slides. Let the force of your ideas flow into their minds. Download our Shapes PowerPoint Templates because Our PowerPoint Templates and Slides will provide you the cutting edge. Slice through the doubts in the minds of your listeners. Download and present our Signs PowerPoint Templates because You are well armed with penetrative ideas. Our PowerPoint Templates and Slides will provide the gunpowder you need.Use these PowerPoint slides for presentations relating to Art, Business, Chart, Circle, Collection, Color, Colorful, Concept, Control, Creative, Cycle, Design, Development, Diagram, Element, Evaluate, Flow, Flowchart, Graphic, Idea, Info Graphic, Iterative, Life, Life-Cycle, Management, Method, Model, Palette, Place, Process, Quality, Rainbow, Research, Retro, Schema, Sign, Software, Spectrum, Step, Strategy, Success, System, Template. The prominent colors used in the PowerPoint template are Pink, Gray, Black.
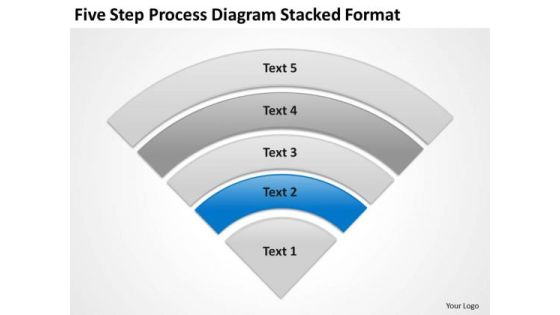
Diagram Stacked Format Business Plan Non Profit Organization PowerPoint Templates
We present our diagram stacked format business plan non profit organization PowerPoint templates.Download and present our Triangles PowerPoint Templates because It will get your audience in sync. Download our Process and Flows PowerPoint Templates because It will let you Set new benchmarks with our PowerPoint Templates and Slides. They will keep your prospects well above par. Present our Marketing PowerPoint Templates because It can Leverage your style with our PowerPoint Templates and Slides. Charm your audience with your ability. Present our Business PowerPoint Templates because Our PowerPoint Templates and Slides will steer your racing mind. Hit the right buttons and spur on your audience. Use our Shapes PowerPoint Templates because Our PowerPoint Templates and Slides help you meet the demand of the Market. Just browse and pick the slides that appeal to your intuitive senses.Use these PowerPoint slides for presentations relating to Color, swatch, print, plate, paint, diagram, chart, process, gamma, press, isolated, semicircle, white, sample, spectrum, pantone, template, circle, sampler, guide, graphic, printout, technology, , computer, management, palette, illustration, spectral, object, system, round, design, selection, choice, rainbow, chooser. The prominent colors used in the PowerPoint template are Blue, Black, Gray.
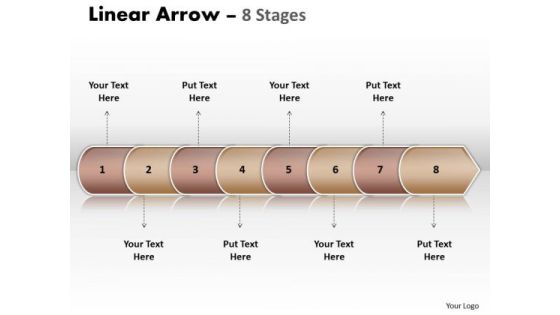
Consulting Diagram Linear Arrow 8 Stages Sales Diagram
Dominate proceedings with your ideas. Our Consulting Diagram Linear Arrow 8 Stages Sales Diagram Powerpoint Templates will empower your thoughts. Our Consulting Diagram Linear Arrow 8 Stages Sales Diagram Powerpoint Templates have a domino effect. Your ideas will generate one after another.

Sales Diagram 3d Arrow Process 8 Stages Business Diagram
Double the impact with our Sales Diagram 3D Arrow Process 8 Stages Business Diagram Powerpoint Templates. Your thoughts will have an imposing effect. Knead the dough with our Sales Diagram 3D Arrow Process 8 Stages Business Diagram Powerpoint Templates. Your thoughts will come up well.
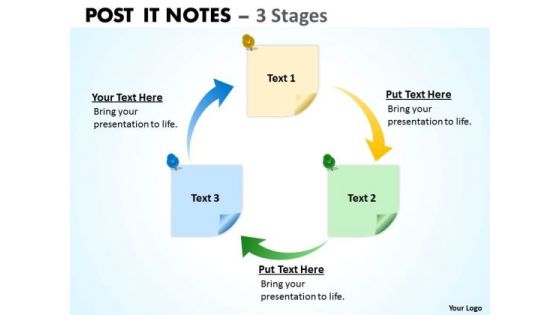
Consulting Diagram Post It Notes 3 Stages Strategy Diagram
Dominate proceedings with your ideas. Our Consulting Diagram POST IT NOTES 3 Stages Strategy Diagram Powerpoint Templates will empower your thoughts. Our Consulting Diagram POST IT NOTES 3 Stages Strategy Diagram Powerpoint Templates have a domino effect. Your ideas will generate one after another.
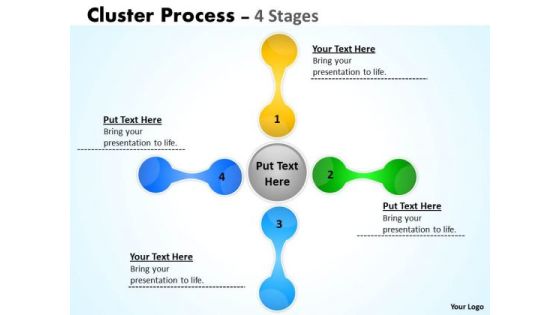
Strategy Diagram Interconnected Business Flow Cluster Development Sales Diagram
Dominate proceedings with your ideas. Our Strategy Diagram Interconnected Business flow Cluster Development Sales Diagram Powerpoint Templates will empower your thoughts. Our Strategy Diagram Interconnected Business flow Cluster Development Sales Diagram Powerpoint Templates have a domino effect. Your ideas will generate one after another.
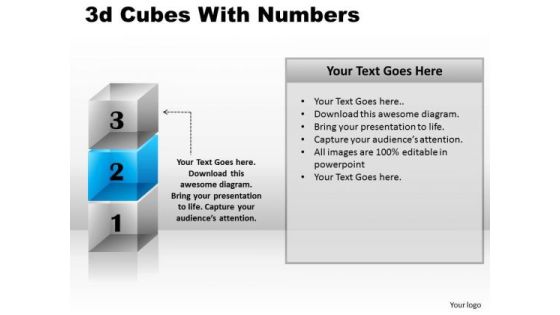
Business Diagram 3d Cubes With Numbers Business Cycle Diagram
Double The Impact With Our Business Diagram 3d Cubes With Numbers Business Cycle Diagram Powerpoint Templates. Your Thoughts Will Have An Imposing Effect. Knead The Dough With Our Business Diagram 3d Cubes With Numbers Business Cycle Diagram Powerpoint Templates. Your Thoughts Will Come Up Well.
Business Diagram 3d List Rectangular Templates Strategy Diagram
Dominate Proceedings With Your Ideas. Our Business Diagram 3D List Rectangular templates Strategy Diagram Powerpoint Templates Will Empower Your Thoughts. Our Business Diagram 3D List Rectangular templates Strategy Diagram Powerpoint Templates Have A Domino Effect. Your Ideas Will Generate One After Another.
Consulting Diagram Vertical Process 6 Stages Templates Marketing Diagram
Double The Impact With Our Consulting Diagram Vertical Process 6 Stages templates Marketing Diagram Powerpoint Templates. Your Thoughts Will Have An Imposing Effect. Knead The Dough With Our Consulting Diagram Vertical Process 6 Stages templates Marketing Diagram Powerpoint Templates. Your Thoughts Will Come Up Well.
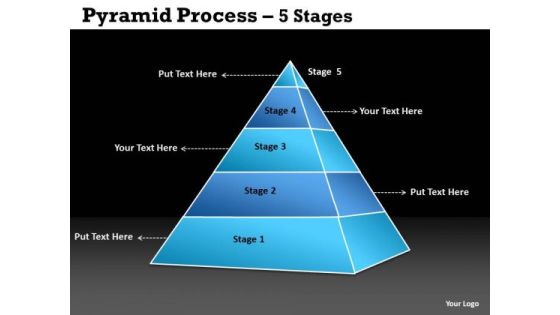
Consulting Diagram 5 Stages For Business Triangle Business Cycle Diagram
Dominate Proceedings With Your Ideas. Our Consulting diagram 5 Stages For Business Triangle Business Cycle Diagram Powerpoint Templates Will Empower Your Thoughts. Our Consulting diagram 5 Stages For Business Triangle Business Cycle Diagram Powerpoint Templates Have A Domino Effect. Your Ideas Will Generate One After Another.

Strategic Management Red Colored Sales Marketing Funnel Diagram Business Diagram
Dominate proceedings with your ideas. Our Strategic Management Red Colored Sales Marketing Funnel Diagram Business Diagram Powerpoint Templates will empower your thoughts. Our Strategic Management Red Colored Sales Marketing Funnel Diagram Business Diagram Powerpoint Templates have a domino effect. Your ideas will generate one after another.

Consulting Diagram 5 Steps For Linear Growth Strategy Diagram
Dominate Proceedings With Your Ideas. Our Consulting Diagram 5 Steps For Linear Growth Strategy Diagram Powerpoint Templates Will Empower Your Thoughts. Our Consulting Diagram 5 Steps For Linear Growth Strategy Diagram Powerpoint Templates Have A Domino Effect. Your Ideas Will Generate One After Another.

Strategy Diagram Circular Puzzle Texture 3 Stages Sales Diagram
Dominate Proceedings With Your Ideas. Our Strategy Diagram circular puzzle texture 3 stages Sales Diagram Powerpoint Templates Will Empower Your Thoughts. Our Strategy Diagram circular puzzle texture 3 stages Sales Diagram Powerpoint Templates Have A Domino Effect. Your Ideas Will Generate One After Another.

Consulting Diagram Circular Puzzle 5 Pieces Strategy Diagram
Dominate Proceedings With Your Ideas. Our Consulting Diagram Circular Puzzle 5 Pieces Strategy Diagram Powerpoint Templates Will Empower Your Thoughts. Our Consulting Diagram Circular Puzzle 5 Pieces Strategy Diagram Powerpoint Templates Have A Domino Effect. Your Ideas Will Generate One After Another.
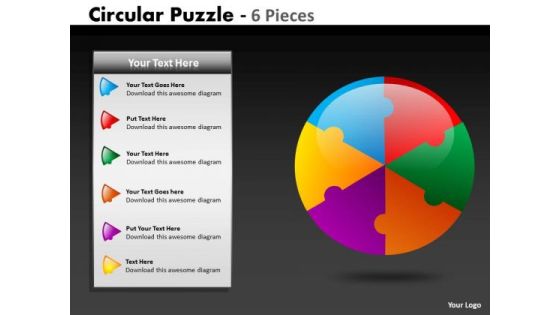
Sales Diagram Circular Puzzle 6 Pieces Consulting Diagram
Double The Impact With Our Sales Diagram Circular Puzzle 6 Pieces Consulting Diagram Powerpoint Templates. Your Thoughts Will Have An Imposing Effect. Knead The Dough With Our Sales Diagram Circular Puzzle 6 Pieces Consulting Diagram Powerpoint Templates. Your Thoughts Will Come Up Well.

Marketing Diagram Gears Process 7 Stages Consulting Diagram
Dominate Proceedings With Your Ideas. Our Marketing Diagram Gears Process 7 Stages Consulting Diagram Powerpoint Templates Will Empower Your Thoughts. Our Marketing Diagram Gears Process 7 Stages Consulting Diagram Powerpoint Templates Have A Domino Effect. Your Ideas Will Generate One After Another.
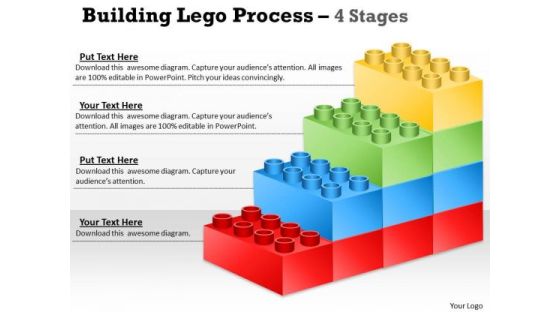
Consulting Diagram Lego Blocks Diagram 4 Stages Strategic Management
Dominate Proceedings With Your Ideas. Our Consulting Diagram Lego Blocks Diagram 4 Stages Strategic Management Powerpoint Templates Will Empower Your Thoughts. Our Consulting Diagram Lego Blocks Diagram 4 Stages Strategic Management Powerpoint Templates Have A Domino Effect. Your Ideas Will Generate One After Another.
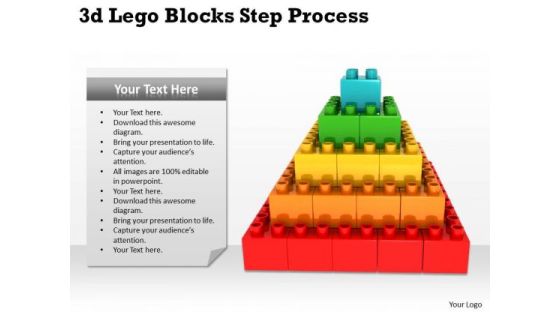
Sales Diagram 3d Lego Blocks Step Process Strategy Diagram
Dominate Proceedings With Your Ideas. Our Sales Diagram 3d Lego Blocks Step Process Strategy Diagram Powerpoint Templates Will Empower Your Thoughts. Our Sales Diagram 3d Lego Blocks Step Process Strategy Diagram Powerpoint Templates Have A Domino Effect. Your Ideas Will Generate One After Another.

Sales Diagram Semi Building Blocks 6 Stages Consulting Diagram
Dominate Proceedings With Your Ideas. Our Sales Diagram Semi Building Blocks 6 Stages Consulting Diagram Powerpoint Templates Will Empower Your Thoughts. Our Sales Diagram Semi Building Blocks 6 Stages Consulting Diagram Powerpoint Templates Have A Domino Effect. Your Ideas Will Generate One After Another.
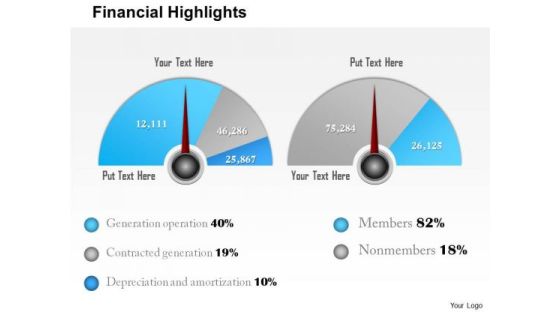
Marketing Diagram Financial Range Definer Diagram Business Framework Model
Dominate Proceedings With Your Ideas. Our Marketing Diagram Financial Range Definer Diagram Business Framework Model Powerpoint Templates Will Empower Your Thoughts. Our Marketing Diagram Financial Range Definer Diagram Business Framework Model Powerpoint Templates Have A Domino Effect. Your Ideas Will Generate One After Another.

Strategic Guide To Perform Marketing Marketing Campaign Performance Management Dashboard Diagrams PDF
This slide presents a dashboard ti track and measure performance of marketing campaign for effective decision making. It provides information about bounce rate, new users, users, average session duration, page performance, page path, average time on page, goal conversion rate and goal completions. Slidegeeks is here to make your presentations a breeze with Strategic Guide To Perform Marketing Marketing Campaign Performance Management Dashboard Diagrams PDF With our easy to use and customizable templates, you can focus on delivering your ideas rather than worrying about formatting. With a variety of designs to choose from, youre sure to find one that suits your needs. And with animations and unique photos, illustrations, and fonts, you can make your presentation pop. So whether youre giving a sales pitch or presenting to the board, make sure to check out Slidegeeks first.
Industrial Robots System Industrial Robots System Performance Tracking Dashboard Diagrams PDF
This slide shows the dashboard to keep a regular track of the performance of industrial robots. the purpose of this slide is to provide a graphical representation of robots performance to enhance the accuracy and effectiveness of these machines. This modern and well-arranged Industrial Robots System Industrial Robots System Performance Tracking Dashboard Diagrams PDF provides lots of creative possibilities. It is very simple to customize and edit with the Powerpoint Software. Just drag and drop your pictures into the shapes. All facets of this template can be edited with Powerpoint, no extra software is necessary. Add your own material, put your images in the places assigned for them, adjust the colors, and then you can show your slides to the world, with an animated slide included.

Dashboard To Manage Marketing Campaigns Of Multiple Brands Ppt PowerPoint Presentation Diagram PDF
This slide showcases dashboard that can help organization to manage the marketing campaigns in multi brand strategy. Its key elements are lead breakdown, total leads, key conversion metrics etc. Coming up with a presentation necessitates that the majority of the effort goes into the content and the message you intend to convey. The visuals of a PowerPoint presentation can only be effective if it supplements and supports the story that is being told. Keeping this in mind our experts created Dashboard To Manage Marketing Campaigns Of Multiple Brands Ppt PowerPoint Presentation Diagram PDF to reduce the time that goes into designing the presentation. This way, you can concentrate on the message while our designers take care of providing you with the right template for the situation.
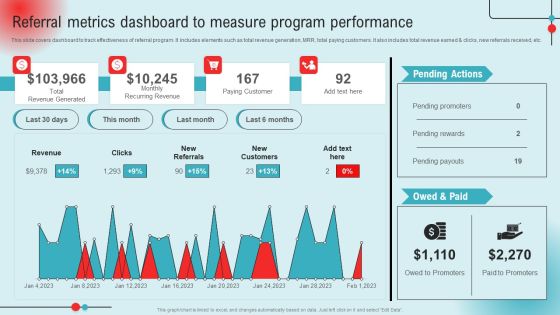
Referral Metrics Dashboard To Measure Program Performance Ppt PowerPoint Presentation Diagram Lists PDF
This slide covers dashboard to track effectiveness of referral program. It includes elements such as total revenue generation, MRR, total paying customers. It also includes total revenue earned and clicks, new referrals received, etc. This Referral Metrics Dashboard To Measure Program Performance Ppt PowerPoint Presentation Diagram Lists PDF from Slidegeeks makes it easy to present information on your topic with precision. It provides customization options, so you can make changes to the colors, design, graphics, or any other component to create a unique layout. It is also available for immediate download, so you can begin using it right away. Slidegeeks has done good research to ensure that you have everything you need to make your presentation stand out. Make a name out there for a brilliant performance.
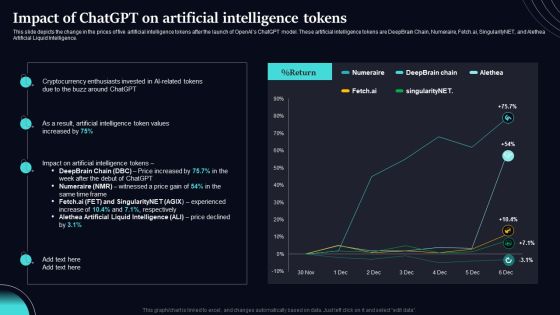
Regenerative Artificial Intelligence Systems Impact Of Chatgpt On Artificial Intelligence Tokens Diagrams PDF
This slide depicts the change in the prices of five artificial intelligence tokens after the launch of OpenAIs ChatGPT model. These artificial intelligence tokens are DeepBrain Chain, Numeraire, Fetch.ai, SingularityNET, and Alethea Artificial Liquid Intelligence. Coming up with a presentation necessitates that the majority of the effort goes into the content and the message you intend to convey. The visuals of a PowerPoint presentation can only be effective if it supplements and supports the story that is being told. Keeping this in mind our experts created Regenerative Artificial Intelligence Systems Impact Of Chatgpt On Artificial Intelligence Tokens Diagrams PDF to reduce the time that goes into designing the presentation. This way, you can concentrate on the message while our designers take care of providing you with the right template for the situation.

Optimizing Brand Equity Through Strategic Management Impact Of Strategic Brand Management On Brand Image Diagrams PDF
This slide presents a brand image tracking analysis to determine the positive impact of various branding activities on brand value perception among consumers. It includes before and after analysis and key insights. Coming up with a presentation necessitates that the majority of the effort goes into the content and the message you intend to convey. The visuals of a PowerPoint presentation can only be effective if it supplements and supports the story that is being told. Keeping this in mind our experts created Optimizing Brand Equity Through Strategic Management Impact Of Strategic Brand Management On Brand Image Diagrams PDF to reduce the time that goes into designing the presentation. This way, you can concentrate on the message while our designers take care of providing you with the right template for the situation.

Laptop Under Umbrella Security PowerPoint Templates Ppt Backgrounds For Slides 0113
We present our Laptop Under Umbrella Security PowerPoint Templates PPT Backgrounds For Slides 0113.Download and present our Umbrellas PowerPoint Templates because You can Double your output with our PowerPoint Templates and Slides. They make beating deadlines a piece of cake. Present our Security PowerPoint Templates because You can Channelise the thoughts of your team with our PowerPoint Templates and Slides. Urge them to focus on the goals you have set. Download our Computer PowerPoint Templates because you can Set pulses racing with our PowerPoint Templates and Slides. They will raise the expectations of your team. Download and present our Network Diagrams PowerPoint Templates because our PowerPoint Templates and Slides are the string of your bow. Fire of your ideas and conquer the podium. Download and present our Signs PowerPoint Templates because You canTake a leap off the starting blocks with our PowerPoint Templates and Slides. They will put you ahead of the competition in quick time.Use these PowerPoint slides for presentations relating to Laptop computer under umbrella, umbrellas, security, computer, network diagrams, signs. The prominent colors used in the PowerPoint template are Red, Blue, Gray. Use our Laptop Under Umbrella Security PowerPoint Templates PPT Backgrounds For Slides 0113 have awesome images to get your point across. The feedback we get is that our security PowerPoint templates and PPT Slides are incredible easy to use. Customers tell us our Laptop Under Umbrella Security PowerPoint Templates PPT Backgrounds For Slides 0113 will generate and maintain the level of interest you desire. They will create the impression you want to imprint on your audience. Customers tell us our network PowerPoint templates and PPT Slides are effectively colour coded to prioritise your plans They automatically highlight the sequence of events you desire. Presenters tell us our Laptop Under Umbrella Security PowerPoint Templates PPT Backgrounds For Slides 0113 provide you with a vast range of viable options. Select the appropriate ones and just fill in your text. Presenters tell us our computer PowerPoint templates and PPT Slides are designed by professionals
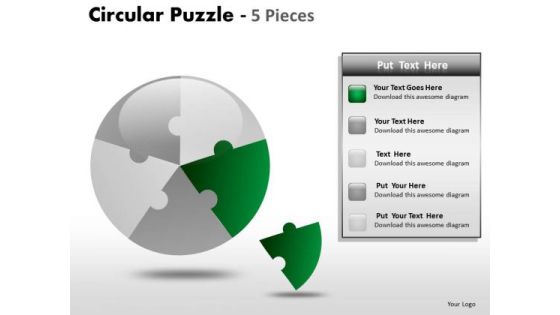
One Fifth Pie Chart PowerPoint Slides And Ppt Templates
One Fifth Pie Chart PowerPoint Slides and PPT templates-These high quality powerpoint pre-designed slides and powerpoint templates have been carefully created by our professional team to help you impress your audience. All slides have been created and are 100% editable in powerpoint. Each and every property of any graphic - color, size, orientation, shading, outline etc. can be modified to help you build an effective powerpoint presentation. Any text can be entered at any point in the powerpoint template or slide. Simply DOWNLOAD, TYPE and PRESENT!

Business Project Planning For Risk Management Ppt PowerPoint Presentation File Smartart PDF
This slide shows the work breakdown structure for managing risks and issues associated with project which are classified into different categories such as technical, external, organization and project management with technologies, quality, capabilities, culture, etc. Presenting business project planning for risk management ppt powerpoint presentation file smartart pdf to dispense important information. This template comprises four stages. It also presents valuable insights into the topics including technical, external, organizational. This is a completely customizable PowerPoint theme that can be put to use immediately. So, download it and address the topic impactfully.

Bar Chart Representing Macroeconomic Analysis Variables Background PDF
This slide shows the graphical representation of macroeconomic variables which includes house prices, stock prices, unemployment and wages that shows effect of macroeconomic policies on the variables of four different countries. Showcasing this set of slides titled Bar Chart Representing Macroeconomic Analysis Variables Background PDF. The topics addressed in these templates are House Prices, Stock Prices, Unemployment, Wages. All the content presented in this PPT design is completely editable. Download it and make adjustments in color, background, font etc. as per your unique business setting.
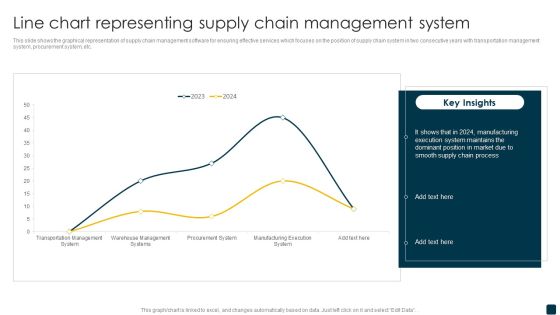
Line Chart Representing Supply Chain Management System Rules PDF
This slide shows the graphical representation of supply chain management software for ensuring effective services which focuses on the position of supply chain system in two consecutive years with transportation management system, procurement system, etc. Pitch your topic with ease and precision using this Line Chart Representing Supply Chain Management System Rules PDF. This layout presents information on Supply Chain Process, Manufacturing, Execution System. It is also available for immediate download and adjustment. So, changes can be made in the color, design, graphics or any other component to create a unique layout.
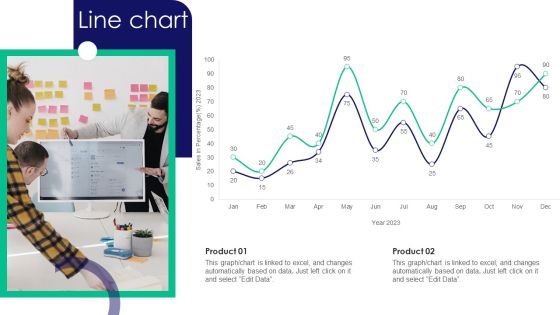
Guide To Business Customer Acquisition Line Chart Infographics PDF
Coming up with a presentation necessitates that the majority of the effort goes into the content and the message you intend to convey. The visuals of a PowerPoint presentation can only be effective if it supplements and supports the story that is being told. Keeping this in mind our experts created Guide To Business Customer Acquisition Line Chart Infographics PDF to reduce the time that goes into designing the presentation. This way, you can concentrate on the message while our designers take care of providing you with the right template for the situation.
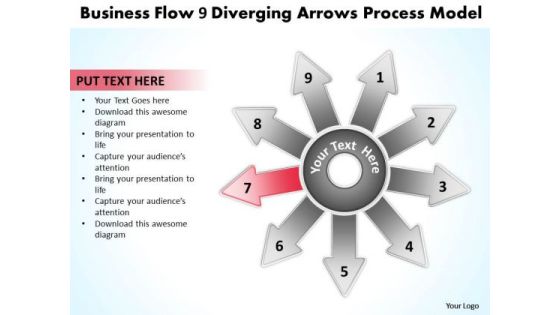
Templates Flow 9 Diverging Arrows Process Model Cycle Chart PowerPoint
We present our templates flow 9 diverging arrows process model Cycle Chart PowerPoint.Download our Business PowerPoint Templates because everybody knows The world over it is a priority for many. Along with it there are so many oppurtunities waiting to be utilised. Download and present our Shapes PowerPoint Templates because Our PowerPoint Templates and Slides are effectively colour coded to prioritise your plans They automatically highlight the sequence of events you desire. Download and present our Success PowerPoint Templates because the choices you make today will determine the future growth of your enterprise. Present our Process and Flows PowerPoint Templates because this diagram helps you to develop your marketing strategy and communicate your enthusiasm and motivation to raise the bar. Download our Arrows PowerPoint Templates because you can Adorn them with your ideas and thoughts.Use these PowerPoint slides for presentations relating to Arrow, Background, Center, Chart, Clip, Communication, Competition, Computer, Concept, Connect, Connection, Diagram, Direction, Group, Illustration, Information, Network, Process, Progress, Purpose, Strategy, Symbol, Target. The prominent colors used in the PowerPoint template are Pink, White, Gray. People tell us our templates flow 9 diverging arrows process model Cycle Chart PowerPoint are Playful. People tell us our Computer PowerPoint templates and PPT Slides are Ultra. The feedback we get is that our templates flow 9 diverging arrows process model Cycle Chart PowerPoint are Multicolored. Presenters tell us our Computer PowerPoint templates and PPT Slides are Sparkling. Customers tell us our templates flow 9 diverging arrows process model Cycle Chart PowerPoint are No-nonsense. The feedback we get is that our Chart PowerPoint templates and PPT Slides are Exuberant.

Strategic Effectiveness Technology Process Ppt PowerPoint Presentation Complete Deck With Slides
This strategic effectiveness technology process ppt powerpoint presentation complete deck with slides acts as backup support for your ideas, vision, thoughts, etc. Use it to present a thorough understanding of the topic. This PPT slideshow can be utilized for both in-house and outside presentations depending upon your needs and business demands. Entailing twelve slides with a consistent design and theme, this template will make a solid use case. As it is intuitively designed, it suits every business vertical and industry. All you have to do is make a few tweaks in the content or any other component to design unique presentations. The biggest advantage of this complete deck is that it can be personalized multiple times once downloaded. The color, design, shapes, and other elements are free to modify to add personal touches. You can also insert your logo design in this PPT layout. Therefore a well-thought and crafted presentation can be delivered with ease and precision by downloading this strategic effectiveness technology process ppt powerpoint presentation complete deck with slides PPT slideshow.
 Home
Home