Economic Growth

Highlighting The Result Of Email Marketing Strategy Opening Retail Store In Untapped Demonstration PDF
The following slide showcases various metrics which will assist the companies to measure the success of email marketing. The key metrics covered in the slide are open, click, delivery, conversion and bounce rate.Slidegeeks has constructed Highlighting The Result Of Email Marketing Strategy Opening Retail Store In Untapped Demonstration PDF after conducting extensive research and examination. These presentation templates are constantly being generated and modified based on user preferences and critiques from editors. Here, you will find the most attractive templates for a range of purposes while taking into account ratings and remarks from users regarding the content. This is an excellent jumping-off point to explore our content and will give new users an insight into our top-notch PowerPoint Templates.

Dashboard For Cloud Storage Tracking Ppt PowerPoint Presentation File Layouts PDF
This slide represents the dashboard for cloud storage tracking by covering details of users, available workspaces, shared files, downloads, uploads, and moves. If you are looking for a format to display your unique thoughts, then the professionally designed Dashboard For Cloud Storage Tracking Ppt PowerPoint Presentation File Layouts PDF is the one for you. You can use it as a Google Slides template or a PowerPoint template. Incorporate impressive visuals, symbols, images, and other charts. Modify or reorganize the text boxes as you desire. Experiment with shade schemes and font pairings. Alter, share or cooperate with other people on your work. Download Dashboard For Cloud Storage Tracking Ppt PowerPoint Presentation File Layouts PDF and find out how to give a successful presentation. Present a perfect display to your team and make your presentation unforgettable.

Data Center Infrastructure Technologies Data Center Storage In Containers Designs PDF
This slide depicts the data center storage in containers, including its popularity, reasons to use containers, and type of containers, such as public cloud and on-premises. The containers need three repositories image storage, a data store for container administration and an application program repository. If you are looking for a format to display your unique thoughts, then the professionally designed Data Center Infrastructure Technologies Data Center Storage In Containers Designs PDF is the one for you. You can use it as a Google Slides template or a PowerPoint template. Incorporate impressive visuals, symbols, images, and other charts. Modify or reorganize the text boxes as you desire. Experiment with shade schemes and font pairings. Alter, share or cooperate with other people on your work. Download Data Center Infrastructure Technologies Data Center Storage In Containers Designs PDF and find out how to give a successful presentation. Present a perfect display to your team and make your presentation unforgettable.
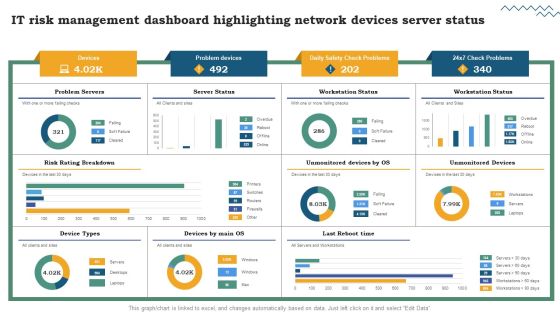
Risk Evaluation Of Information Technology Systems IT Risk Management Dashboard Highlighting Network Devices Server Status Professional PDF
If you are looking for a format to display your unique thoughts, then the professionally designed Risk Evaluation Of Information Technology Systems IT Risk Management Dashboard Highlighting Network Devices Server Status Professional PDF is the one for you. You can use it as a Google Slides template or a PowerPoint template. Incorporate impressive visuals, symbols, images, and other charts. Modify or reorganize the text boxes as you desire. Experiment with shade schemes and font pairings. Alter, share or cooperate with other people on your work. Download Risk Evaluation Of Information Technology Systems IT Risk Management Dashboard Highlighting Network Devices Server Status Professional PDF and find out how to give a successful presentation. Present a perfect display to your team and make your presentation unforgettable.

Cloud Dashboard For Tracking Project Sprints Ppt PowerPoint Presentation File Layouts PDF
The following slide depicts cloud dashboard for monitoring project sprints. It provides information about sprint blockers, resolved issues, under performers, sprint health, releases, sprint burndown, etc. If you are looking for a format to display your unique thoughts, then the professionally designed Cloud Dashboard For Tracking Project Sprints Ppt PowerPoint Presentation File Layouts PDF is the one for you. You can use it as a Google Slides template or a PowerPoint template. Incorporate impressive visuals, symbols, images, and other charts. Modify or reorganize the text boxes as you desire. Experiment with shade schemes and font pairings. Alter, share or cooperate with other people on your work. Download Cloud Dashboard For Tracking Project Sprints Ppt PowerPoint Presentation File Layouts PDF and find out how to give a successful presentation. Present a perfect display to your team and make your presentation unforgettable.

Evaluating The Impact Of Marketing Strategies Market Share Topics PDF
The following slide outlines a comprehensive line chart indicating the market share of our company and the most successful competitor. Information covered in this slide is related to four quarters. Do you have to make sure that everyone on your team knows about any specific topic I yes, then you should give Evaluating The Impact Of Marketing Strategies Market Share Topics PDF a try. Our experts have put a lot of knowledge and effort into creating this impeccable Evaluating The Impact Of Marketing Strategies Market Share Topics PDF. You can use this template for your upcoming presentations, as the slides are perfect to represent even the tiniest detail. You can download these templates from the Slidegeeks website and these are easy to edit. So grab these today.
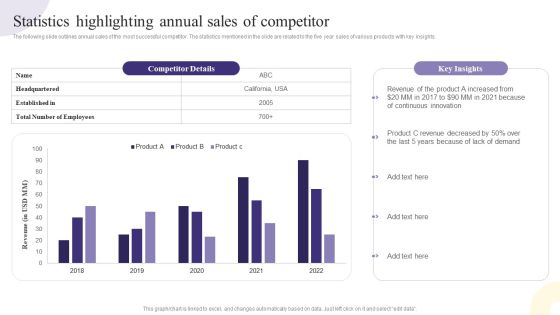
Statistics Highlighting Annual Sales Of Competitor Ideas PDF
The following slide outlines annual sales of the most successful competitor. The statistics mentioned in the slide are related to the five year sales of various products with key insights. Here you can discover an assortment of the finest PowerPoint and Google Slides templates. With these templates, you can create presentations for a variety of purposes while simultaneously providing your audience with an eye catching visual experience. Download Statistics Highlighting Annual Sales Of Competitor Ideas PDF to deliver an impeccable presentation. These templates will make your job of preparing presentations much quicker, yet still, maintain a high level of quality. Slidegeeks has experienced researchers who prepare these templates and write high quality content for you. Later on, you can personalize the content by editing the Statistics Highlighting Annual Sales Of Competitor Ideas PDF.

Statistics Highlighting Annual Sales Of Competitor Graphics PDF
The following slide outlines annual sales of the most successful competitor. The statistics mentioned in the slide are related to the five year sales of various products with key insights. Here you can discover an assortment of the finest PowerPoint and Google Slides templates. With these templates, you can create presentations for a variety of purposes while simultaneously providing your audience with an eye catching visual experience. Download Statistics Highlighting Annual Sales Of Competitor Graphics PDF to deliver an impeccable presentation. These templates will make your job of preparing presentations much quicker, yet still, maintain a high level of quality. Slidegeeks has experienced researchers who prepare these templates and write high quality content for you. Later on, you can personalize the content by editing the Statistics Highlighting Annual Sales Of Competitor Graphics PDF.

Brand Marketing Strategy Dashboard To Track Online Brand Marketing Campaigns Template PDF
This slide showcases dashboard that can help organization to track the results of online brand marketing campaigns. Its key elements are leads breakdown,web traffic, lead to trial, organic search, website traffic, web users etc. If you are looking for a format to display your unique thoughts, then the professionally designed Brand Marketing Strategy Dashboard To Track Online Brand Marketing Campaigns Template PDF is the one for you. You can use it as a Google Slides template or a PowerPoint template. Incorporate impressive visuals, symbols, images, and other charts. Modify or reorganize the text boxes as you desire. Experiment with shade schemes and font pairings. Alter, share or cooperate with other people on your work. Download Brand Marketing Strategy Dashboard To Track Online Brand Marketing Campaigns Template PDF and find out how to give a successful presentation. Present a perfect display to your team and make your presentation unforgettable.

Brand Marketing Strategy Dashboard To Track Traffic On Brand Website Template PDF
This slide showcases dashboard that can help organization to analyze and evaluate the website traffic after new brand launch. Its key elements are unique page views, average time on page, channel sessions, page views, bounce rate etc. If you are looking for a format to display your unique thoughts, then the professionally designed Brand Marketing Strategy Dashboard To Track Traffic On Brand Website Template PDF is the one for you. You can use it as a Google Slides template or a PowerPoint template. Incorporate impressive visuals, symbols, images, and other charts. Modify or reorganize the text boxes as you desire. Experiment with shade schemes and font pairings. Alter, share or cooperate with other people on your work. Download Brand Marketing Strategy Dashboard To Track Traffic On Brand Website Template PDF and find out how to give a successful presentation. Present a perfect display to your team and make your presentation unforgettable.
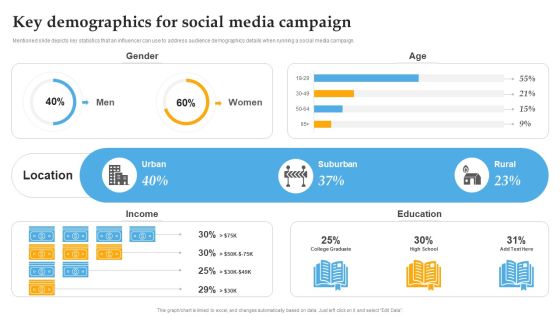
Key Demographics For Social Media Campaign Comprehensive Personal Brand Building Guide For Social Media Information PDF
Mentioned slide depicts key statistics that an influencer can use to address audience demographics details when running a social media campaign. If you are looking for a format to display your unique thoughts, then the professionally designed Key Demographics For Social Media Campaign Comprehensive Personal Brand Building Guide For Social Media Information PDF is the one for you. You can use it as a Google Slides template or a PowerPoint template. Incorporate impressive visuals, symbols, images, and other charts. Modify or reorganize the text boxes as you desire. Experiment with shade schemes and font pairings. Alter, share or cooperate with other people on your work. Download Key Demographics For Social Media Campaign Comprehensive Personal Brand Building Guide For Social Media Information PDF and find out how to give a successful presentation. Present a perfect display to your team and make your presentation unforgettable.

Guide To Create Advertising Campaign For Client Engagement Step 2 Create Customer Persona Background PDF
This slide showcases the overview of customer persona created by marketers to understand and determine target audience. It includes customer details such as age, work, qualification, location, goals, interests, challenges, preferred channels and motivation. If you are looking for a format to display your unique thoughts, then the professionally designed Guide To Create Advertising Campaign For Client Engagement Step 2 Create Customer Persona Background PDF is the one for you. You can use it as a Google Slides template or a PowerPoint template. Incorporate impressive visuals, symbols, images, and other charts. Modify or reorganize the text boxes as you desire. Experiment with shade schemes and font pairings. Alter, share or cooperate with other people on your work. Download Guide To Create Advertising Campaign For Client Engagement Step 2 Create Customer Persona Background PDF and find out how to give a successful presentation. Present a perfect display to your team and make your presentation unforgettable.

Aiops Dashboard To Monitor IT Operations Aiops Integration Summary Report Clipart PDF
The following slide highlights the various key performance indicators of the AIOp, these can be problem quick review, cloud and infrastructure and applications health. If you are looking for a format to display your unique thoughts, then the professionally designed Aiops Dashboard To Monitor IT Operations Aiops Integration Summary Report Clipart PDF is the one for you. You can use it as a Google Slides template or a PowerPoint template. Incorporate impressive visuals, symbols, images, and other charts. Modify or reorganize the text boxes as you desire. Experiment with shade schemes and font pairings. Alter, share or cooperate with other people on your work. Download Aiops Dashboard To Monitor IT Operations Aiops Integration Summary Report Clipart PDF and find out how to give a successful presentation. Present a perfect display to your team and make your presentation unforgettable.

Top SEO Techniques Seo Reporting Dashboard To Evaluate Website Rank Ideas PDF
The purpose of this slide is to outline mobile search engine optimization SEO reporting dashboard. It covers different metrics such as web traffic overview, total views, content overview, goal value and conversion etc. If you are looking for a format to display your unique thoughts, then the professionally designed Top SEO Techniques Seo Reporting Dashboard To Evaluate Website Rank Ideas PDF is the one for you. You can use it as a Google Slides template or a PowerPoint template. Incorporate impressive visuals, symbols, images, and other charts. Modify or reorganize the text boxes as you desire. Experiment with shade schemes and font pairings. Alter, share or cooperate with other people on your work. Download Top SEO Techniques Seo Reporting Dashboard To Evaluate Website Rank Ideas PDF and find out how to give a successful presentation. Present a perfect display to your team and make your presentation unforgettable.
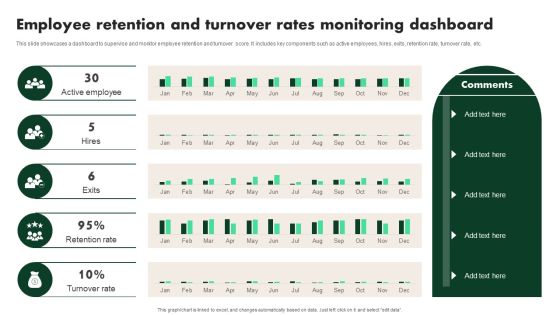
Creating Employee Value Proposition Employee Retention And Turnover Rates Monitoring Brochure PDF
This slide showcases a dashboard to supervise and monitor employee retention and turnover score. It includes key components such as active employees, hires, exits, retention rate, turnover rate, etc. If you are looking for a format to display your unique thoughts, then the professionally designed Creating Employee Value Proposition Employee Retention And Turnover Rates Monitoring Brochure PDF is the one for you. You can use it as a Google Slides template or a PowerPoint template. Incorporate impressive visuals, symbols, images, and other charts. Modify or reorganize the text boxes as you desire. Experiment with shade schemes and font pairings. Alter, share or cooperate with other people on your work. Download Creating Employee Value Proposition Employee Retention And Turnover Rates Monitoring Brochure PDF and find out how to give a successful presentation. Present a perfect display to your team and make your presentation unforgettable.

Toolkit For Data Science And Analytics Transition Reasons Towards Failure Of Data Analytics Project Background PDF
This slide shows the graph highlighting key reasons for the failure of data management project. If you are looking for a format to display your unique thoughts, then the professionally designed Toolkit For Data Science And Analytics Transition Reasons Towards Failure Of Data Analytics Project Background PDF is the one for you. You can use it as a Google Slides template or a PowerPoint template. Incorporate impressive visuals, symbols, images, and other charts. Modify or reorganize the text boxes as you desire. Experiment with shade schemes and font pairings. Alter, share or cooperate with other people on your work. Download Toolkit For Data Science And Analytics Transition Reasons Towards Failure Of Data Analytics Project Background PDF and find out how to give a successful presentation. Present a perfect display to your team and make your presentation unforgettable.

Branches For Visualization Research And Development Lack Of Data Understanding Faced Introduction PDF
This slide depicts the different issues faced by the company in a project, but the lack of data understanding is the primary concern among all. If you are looking for a format to display your unique thoughts, then the professionally designed Branches For Visualization Research And Development Lack Of Data Understanding Faced Introduction PDF is the one for you. You can use it as a Google Slides template or a PowerPoint template. Incorporate impressive visuals, symbols, images, and other charts. Modify or reorganize the text boxes as you desire. Experiment with shade schemes and font pairings. Alter, share or cooperate with other people on your work. Download Branches For Visualization Research And Development Lack Of Data Understanding Faced Introduction PDF and find out how to give a successful presentation. Present a perfect display to your team and make your presentation unforgettable.
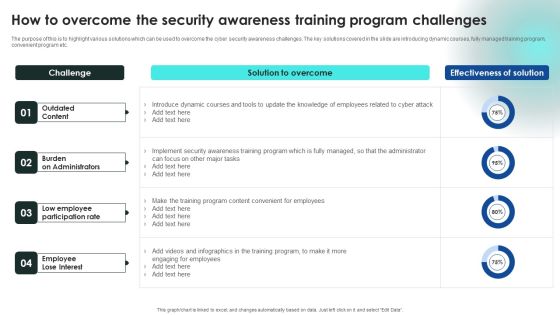
Implementing Cybersecurity Awareness Program To Prevent Attacks How To Overcome The Security Awareness Summary PDF
The purpose of this is to highlight various solutions which can be used to overcome the cyber security awareness challenges. The key solutions covered in the slide are introducing dynamic courses, fully managed training program, convenient program etc. If you are looking for a format to display your unique thoughts, then the professionally designed Implementing Cybersecurity Awareness Program To Prevent Attacks How To Overcome The Security Awareness Summary PDF is the one for you. You can use it as a Google Slides template or a PowerPoint template. Incorporate impressive visuals, symbols, images, and other charts. Modify or reorganize the text boxes as you desire. Experiment with shade schemes and font pairings. Alter, share or cooperate with other people on your work. Download Implementing Cybersecurity Awareness Program To Prevent Attacks How To Overcome The Security Awareness Summary PDF and find out how to give a successful presentation. Present a perfect display to your team and make your presentation unforgettable.

Track Campaign Performance To Determine Effective Ctas Ppt Infographic Template Vector PDF
The following slide showcases content marketing campaign performance to evaluate success and monitor effectiveness of marketing efforts. It includes elements such as new visitors, page views, sessions, visitors, event name, blog open count etc. Slidegeeks has constructed Track Campaign Performance To Determine Effective Ctas Ppt Infographic Template Vector PDF after conducting extensive research and examination. These presentation templates are constantly being generated and modified based on user preferences and critiques from editors. Here, you will find the most attractive templates for a range of purposes while taking into account ratings and remarks from users regarding the content. This is an excellent jumping-off point to explore our content and will give new users an insight into our top-notch PowerPoint Templates.
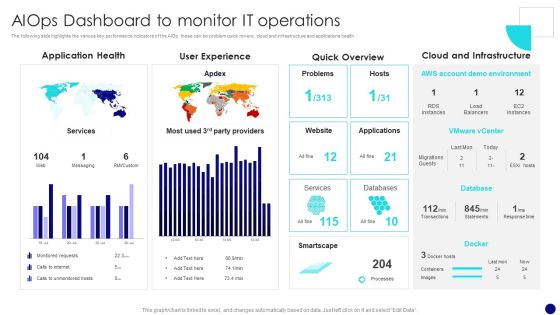
Information Technology Operations Administration With ML Aiops Dashboard To Monitor Diagrams PDF
The following slide highlights the various key performance indicators of the AIOp, these can be problem quick review, cloud and infrastructure and applications health. If you are looking for a format to display your unique thoughts, then the professionally designed Information Technology Operations Administration With ML Aiops Dashboard To Monitor Diagrams PDF is the one for you. You can use it as a Google Slides template or a PowerPoint template. Incorporate impressive visuals, symbols, images, and other charts. Modify or reorganize the text boxes as you desire. Experiment with shade schemes and font pairings. Alter, share or cooperate with other people on your work. Download Information Technology Operations Administration With ML Aiops Dashboard To Monitor Diagrams PDF and find out how to give a successful presentation. Present a perfect display to your team and make your presentation unforgettable.

Operational Strategy For ML In IT Sector Aiops Dashboard To Monitor IT Operations Diagrams PDF
The following slide highlights the various key performance indicators of the AIOps, these can be problem quick review, cloud and infrastructure and applications health If you are looking for a format to display your unique thoughts, then the professionally designed Operational Strategy For ML In IT Sector Aiops Dashboard To Monitor IT Operations Diagrams PDF is the one for you. You can use it as a Google Slides template or a PowerPoint template. Incorporate impressive visuals, symbols, images, and other charts. Modify or reorganize the text boxes as you desire. Experiment with shade schemes and font pairings. Alter, share or cooperate with other people on your work. Download Operational Strategy For ML In IT Sector Aiops Dashboard To Monitor IT Operations Diagrams PDF and find out how to give a successful presentation. Present a perfect display to your team and make your presentation unforgettable.
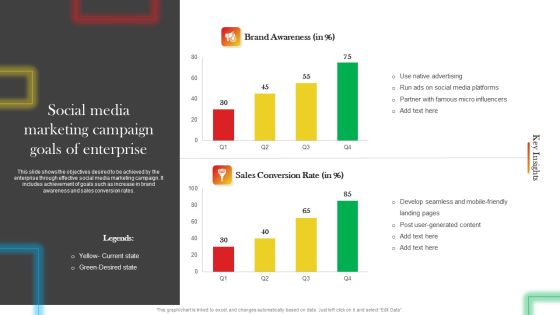
Social Media Marketing Campaign Goals Of Enterprise Mockup PDF
This slide shows the objectives desired to be achieved by the enterprise through effective social media marketing campaign. It includes achievement of goals such as increase in brand awareness and sales conversion rates. If you are looking for a format to display your unique thoughts, then the professionally designed Social Media Marketing Campaign Goals Of Enterprise Mockup PDF is the one for you. You can use it as a Google Slides template or a PowerPoint template. Incorporate impressive visuals, symbols, images, and other charts. Modify or reorganize the text boxes as you desire. Experiment with shade schemes and font pairings. Alter, share or cooperate with other people on your work. Download Social Media Marketing Campaign Goals Of Enterprise Mockup PDF and find out how to give a successful presentation. Present a perfect display to your team and make your presentation unforgettable.

Media Advertising Concerns Regarding Current Social Media Channels Diagrams PDF
This slide highlights the key issues and problems faced by the organization. It showcases the charts and graphs along with declining in organic reach, poor customer engagement and low social media presence. If you are looking for a format to display your unique thoughts, then the professionally designed Media Advertising Concerns Regarding Current Social Media Channels Diagrams PDF is the one for you. You can use it as a Google Slides template or a PowerPoint template. Incorporate impressive visuals, symbols, images, and other charts. Modify or reorganize the text boxes as you desire. Experiment with shade schemes and font pairings. Alter, share or cooperate with other people on your work. Download Media Advertising Concerns Regarding Current Social Media Channels Diagrams PDF and find out how to give a successful presentation. Present a perfect display to your team and make your presentation unforgettable.

Lead Generation By Source In Traditional Marketing Summary PDF
This slide showcases current and estimated lead generation from traditional marketing. Major sources covered are print, outdoor, broadcasting, one-on-one and referral marketing. If you are looking for a format to display your unique thoughts, then the professionally designed Lead Generation By Source In Traditional Marketing Summary PDF is the one for you. You can use it as a Google Slides template or a PowerPoint template. Incorporate impressive visuals, symbols, images, and other charts. Modify or reorganize the text boxes as you desire. Experiment with shade schemes and font pairings. Alter, share or cooperate with other people on your work. Download Lead Generation By Source In Traditional Marketing Summary PDF and find out how to give a successful presentation. Present a perfect display to your team and make your presentation unforgettable.
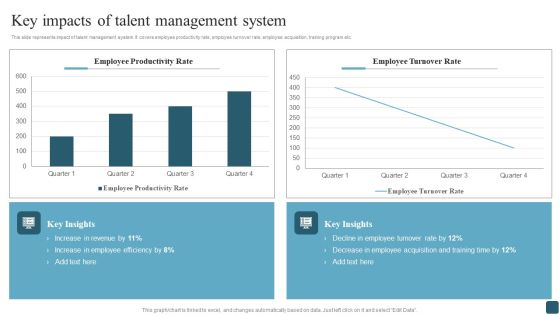
Key Impacts Of Talent Management System Diagrams PDF
This slide represents impact of talent management system. It covers employee productivity rate, employee turnover rate, employee acquisition, training program etc. If you are looking for a format to display your unique thoughts, then the professionally designed Key Impacts Of Talent Management System Diagrams PDF is the one for you. You can use it as a Google Slides template or a PowerPoint template. Incorporate impressive visuals, symbols, images, and other charts. Modify or reorganize the text boxes as you desire. Experiment with shade schemes and font pairings. Alter, share or cooperate with other people on your work. Download Key Impacts Of Talent Management System Diagrams PDF and find out how to give a successful presentation. Present a perfect display to your team and make your presentation unforgettable.

Retail Iot Service Regional Market Share Of Device Management Formats PDF
The following slide highlights the market share of device management on the basis of region. It shows regional market size, market distribution by industry, top countries and major uses of IoT service. If you are looking for a format to display your unique thoughts, then the professionally designed Retail Iot Service Regional Market Share Of Device Management Formats PDF is the one for you. You can use it as a Google Slides template or a PowerPoint template. Incorporate impressive visuals, symbols, images, and other charts. Modify or reorganize the text boxes as you desire. Experiment with shade schemes and font pairings. Alter, share or cooperate with other people on your work. Download Retail Iot Service Regional Market Share Of Device Management Formats PDF and find out how to give a successful presentation. Present a perfect display to your team and make your presentation unforgettable.
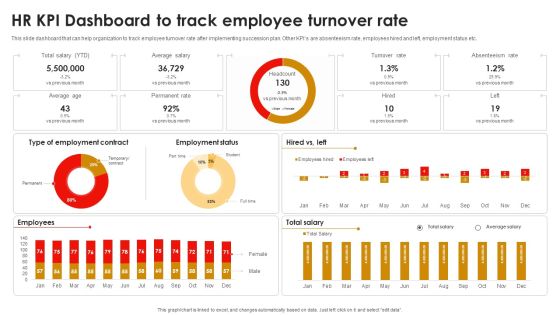
Strategic Talent Development HR KPI Dashboard To Track Employee Turnover Rate Summary PDF
This slide dashboard that can help organization to track employee turnover rate after implementing succession plan. Other KPIs are absenteeism rate, employees hired and left, employment status etc. This modern and well-arranged Strategic Talent Development HR KPI Dashboard To Track Employee Turnover Rate Summary PDF provides lots of creative possibilities. It is very simple to customize and edit with the Powerpoint Software. Just drag and drop your pictures into the shapes. All facets of this template can be edited with Powerpoint, no extra software is necessary. Add your own material, put your images in the places assigned for them, adjust the colors, and then you can show your slides to the world, with an animated slide included.
Determining Customer Lifetime Value And Churn Rate Ppt Icon Guidelines PDF
This slide shows informational statistics about customer lifetime value and churn rate in FY23. It also shows that average customer lifetime for 2023 was 21 months. If you are looking for a format to display your unique thoughts, then the professionally designed Determining Customer Lifetime Value And Churn Rate Ppt Icon Guidelines PDF is the one for you. You can use it as a Google Slides template or a PowerPoint template. Incorporate impressive visuals, symbols, images, and other charts. Modify or reorganize the text boxes as you desire. Experiment with shade schemes and font pairings. Alter, share or cooperate with other people on your work. Download Determining Customer Lifetime Value And Churn Rate Ppt Icon Guidelines PDF and find out how to give a successful presentation. Present a perfect display to your team and make your presentation unforgettable.

AI Deployment In IT Process Aiops Dashboard To Monitor IT Operations Infographics PDF
The following slide highlights the various key performance indicators of the AIOp, these can be problem quick review, cloud and infrastructure and applications health. If you are looking for a format to display your unique thoughts, then the professionally designed AI Deployment In IT Process Aiops Dashboard To Monitor IT Operations Infographics PDF is the one for you. You can use it as a Google Slides template or a PowerPoint template. Incorporate impressive visuals, symbols, images, and other charts. Modify or reorganize the text boxes as you desire. Experiment with shade schemes and font pairings. Alter, share or cooperate with other people on your work. Download AI Deployment In IT Process Aiops Dashboard To Monitor IT Operations Infographics PDF and find out how to give a successful presentation. Present a perfect display to your team and make your presentation unforgettable.

Global Market Insights By Component Ppt Infographic Template Background Designs PDF
This slide showcases the global precision farming market insights by component which represents hardware, software and services segment. If you are looking for a format to display your unique thoughts, then the professionally designed Global Market Insights By Component Ppt Infographic Template Background Designs PDF is the one for you. You can use it as a Google Slides template or a PowerPoint template. Incorporate impressive visuals, symbols, images, and other charts. Modify or reorganize the text boxes as you desire. Experiment with shade schemes and font pairings. Alter, share or cooperate with other people on your work. Download Global Market Insights By Component Ppt Infographic Template Background Designs PDF and find out how to give a successful presentation. Present a perfect display to your team and make your presentation unforgettable.

Website Analytics Dashboard For Consumer Data Insights Ppt PowerPoint Presentation File Slides PDF
This slide showcases dashboard for website analytics that can help organization to gather data about visitors and formulate targeted marketing campaigns. It can also help to make individual and group buyer personas. If you are looking for a format to display your unique thoughts, then the professionally designed Website Analytics Dashboard For Consumer Data Insights Ppt PowerPoint Presentation File Slides PDF is the one for you. You can use it as a Google Slides template or a PowerPoint template. Incorporate impressive visuals, symbols, images, and other charts. Modify or reorganize the text boxes as you desire. Experiment with shade schemes and font pairings. Alter, share or cooperate with other people on your work. Download Website Analytics Dashboard For Consumer Data Insights Ppt PowerPoint Presentation File Slides PDF and find out how to give a successful presentation. Present a perfect display to your team and make your presentation unforgettable.

Creating Positioning Techniques For Market Research Analyzing Customer Demographics Through Performance Background PDF
The following slide outlines key performance indicator KPI dashboard outlining customer demographics. Information covered in this slide is related to metrics such as gender, education level, technology adoption life cycle, and brand innovation consent. If you are looking for a format to display your unique thoughts, then the professionally designed Creating Positioning Techniques For Market Research Analyzing Customer Demographics Through Performance Background PDF is the one for you. You can use it as a Google Slides template or a PowerPoint template. Incorporate impressive visuals, symbols, images, and other charts. Modify or reorganize the text boxes as you desire. Experiment with shade schemes and font pairings. Alter, share or cooperate with other people on your work. Download Creating Positioning Techniques For Market Research Analyzing Customer Demographics Through Performance Background PDF and find out how to give a successful presentation. Present a perfect display to your team and make your presentation unforgettable.

Claims Tracking Dashboard Utilized By Insurance Agency Diagrams PDF
This slide provides glimpse about claim activities tracking by insurance agency in terms of claim amount collected, number of claims, claims by product line, claim status assessment, claim expense by product line, etc. If you are looking for a format to display your unique thoughts, then the professionally designed Claims Tracking Dashboard Utilized By Insurance Agency Diagrams PDF is the one for you. You can use it as a Google Slides template or a PowerPoint template. Incorporate impressive visuals, symbols, images, and other charts. Modify or reorganize the text boxes as you desire. Experiment with shade schemes and font pairings. Alter, share or cooperate with other people on your work. Download Claims Tracking Dashboard Utilized By Insurance Agency Diagrams PDF and find out how to give a successful presentation. Present a perfect display to your team and make your presentation unforgettable.

Addressing B2B Account Based Marketing Management Dashboard Elements PDF
This slide provides information regarding B2B account-based marketing management dashboard catering KPIs related to opportunities, sales activities, average engagement score. If you are looking for a format to display your unique thoughts, then the professionally designed Addressing B2B Account Based Marketing Management Dashboard Elements PDF is the one for you. You can use it as a Google Slides template or a PowerPoint template. Incorporate impressive visuals, symbols, images, and other charts. Modify or reorganize the text boxes as you desire. Experiment with shade schemes and font pairings. Alter, share or cooperate with other people on your work. Download Addressing B2B Account Based Marketing Management Dashboard Elements PDF and find out how to give a successful presentation. Present a perfect display to your team and make your presentation unforgettable.

Smartphone Game Development And Advertising Technique Casual Gaming User Demographics And Daily Time Mockup PDF
If you are looking for a format to display your unique thoughts, then the professionally designed Smartphone Game Development And Advertising Technique Casual Gaming User Demographics And Daily Time Mockup PDF is the one for you. You can use it as a Google Slides template or a PowerPoint template. Incorporate impressive visuals, symbols, images, and other charts. Modify or reorganize the text boxes as you desire. Experiment with shade schemes and font pairings. Alter, share or cooperate with other people on your work. Download Smartphone Game Development And Advertising Technique Casual Gaming User Demographics And Daily Time Mockup PDF and find out how to give a successful presentation. Present a perfect display to your team and make your presentation unforgettable.

Online Video Model Company Profile Story Reach Percentage By Content Type Pictures PDF
This slide represents the average story reach rate by type of content such as images and videos in comparison to users profile size which shows video stories success to gain greater reach. Coming up with a presentation necessitates that the majority of the effort goes into the content and the message you intend to convey. The visuals of a PowerPoint presentation can only be effective if it supplements and supports the story that is being told. Keeping this in mind our experts created Online Video Model Company Profile Story Reach Percentage By Content Type Pictures PDF to reduce the time that goes into designing the presentation. This way, you can concentrate on the message while our designers take care of providing you with the right template for the situation.

Corporate Training Program Company Annual Production In Last 5 Years Rules PDF
The following slide showcases the company annual production graph for last 5 years which shows that annual production has declined during this time period due to decrease in employees efficiency rate and high attrition in the company. If you are looking for a format to display your unique thoughts, then the professionally designed Corporate Training Program Company Annual Production In Last 5 Years Rules PDF is the one for you. You can use it as a Google Slides template or a PowerPoint template. Incorporate impressive visuals, symbols, images, and other charts. Modify or reorganize the text boxes as you desire. Experiment with shade schemes and font pairings. Alter, share or cooperate with other people on your work. Download Corporate Training Program Company Annual Production In Last 5 Years Rules PDF and find out how to give a successful presentation. Present a perfect display to your team and make your presentation unforgettable.

Marketing Initiatives To Promote Fast Food Cafe Dashboard To Track Sales And Expenses Of Restaurant Portrait PDF
This slide showcases dashboard that can help restaurant to keep track of sales and expenses. Its key elements are total sales, average transactions, non labor margin, expenses by category etc If you are looking for a format to display your unique thoughts, then the professionally designed Marketing Initiatives To Promote Fast Food Cafe Dashboard To Track Sales And Expenses Of Restaurant Portrait PDF is the one for you. You can use it as a Google Slides template or a PowerPoint template. Incorporate impressive visuals, symbols, images, and other charts. Modify or reorganize the text boxes as you desire. Experiment with shade schemes and font pairings. Alter, share or cooperate with other people on your work. Download Marketing Initiatives To Promote Fast Food Cafe Dashboard To Track Sales And Expenses Of Restaurant Portrait PDF and find out how to give a successful presentation. Present a perfect display to your team and make your presentation unforgettable.

Integrating CRM Solution To Acquire Potential Customers CRM Email Nurturing Campaign Dashboard Template PDF
This slide represents key metrics dashboard to analyze, manage and track the performance of email nurturing campaign organized by the enterprise. It incudes details related to KPIs such as conversion rate, average order value etc. If you are looking for a format to display your unique thoughts, then the professionally designed Integrating CRM Solution To Acquire Potential Customers CRM Email Nurturing Campaign Dashboard Template PDF is the one for you. You can use it as a Google Slides template or a PowerPoint template. Incorporate impressive visuals, symbols, images, and other charts. Modify or reorganize the text boxes as you desire. Experiment with shade schemes and font pairings. Alter, share or cooperate with other people on your work. Download Integrating CRM Solution To Acquire Potential Customers CRM Email Nurturing Campaign Dashboard Template PDF and find out how to give a successful presentation. Present a perfect display to your team and make your presentation unforgettable.

Global Tiktok Users Statistical Data Portrait PDF
This slide shows the statistical data representing the analysis of global TikTok users on TikTok to help marketers to analyze and identify target audience. It shows data related to users of TikTok are youths and millennials. If you are looking for a format to display your unique thoughts, then the professionally designed Global Tiktok Users Statistical Data Portrait PDF is the one for you. You can use it as a Google Slides template or a PowerPoint template. Incorporate impressive visuals, symbols, images, and other charts. Modify or reorganize the text boxes as you desire. Experiment with shade schemes and font pairings. Alter, share or cooperate with other people on your work. Download Global Tiktok Users Statistical Data Portrait PDF and find out how to give a successful presentation. Present a perfect display to your team and make your presentation unforgettable.
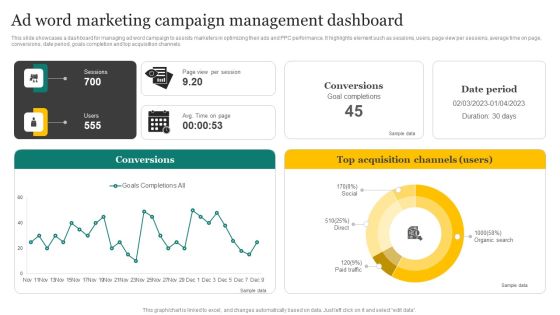
Strategic Promotion Plan Development Stages Ad Word Marketing Campaign Management Dashboard Template PDF
This slide showcases a dashboard for managing ad word campaign to assists marketers in optimizing their ads and PPC performance. It highlights element such as sessions, users, page view per sessions, average time on page, conversions, date period, goals completion and top acquisition channels. If you are looking for a format to display your unique thoughts, then the professionally designed Strategic Promotion Plan Development Stages Ad Word Marketing Campaign Management Dashboard Template PDF is the one for you. You can use it as a Google Slides template or a PowerPoint template. Incorporate impressive visuals, symbols, images, and other charts. Modify or reorganize the text boxes as you desire. Experiment with shade schemes and font pairings. Alter, share or cooperate with other people on your work. Download Strategic Promotion Plan Development Stages Ad Word Marketing Campaign Management Dashboard Template PDF and find out how to give a successful presentation. Present a perfect display to your team and make your presentation unforgettable.

Categories Of Segmenting And Profiling Customers Customer Demographics Segmentation Dashboard Guidelines PDF
This slide showcases a dashboard for segmenting customers based on demographics factors. It includes key components such as make population by age, female population by age, number of male customers and number of female customers. If you are looking for a format to display your unique thoughts, then the professionally designed Categories Of Segmenting And Profiling Customers Customer Demographics Segmentation Dashboard Guidelines PDF is the one for you. You can use it as a Google Slides template or a PowerPoint template. Incorporate impressive visuals, symbols, images, and other charts. Modify or reorganize the text boxes as you desire. Experiment with shade schemes and font pairings. Alter, share or cooperate with other people on your work. Download Categories Of Segmenting And Profiling Customers Customer Demographics Segmentation Dashboard Guidelines PDF and find out how to give a successful presentation. Present a perfect display to your team and make your presentation unforgettable.

Vendor Performance Analysis And Administration Supplier Performance And Order Cycle Time Monitoring Dashboard Themes PDF
The following slide showcases a dashboard to supervise and manage procurement order cycle time an supplier performance. It includes key elements such as defect rate, on time supplies, supplier availability, lead time, supplier defect rate, defect type and delivery time. If you are looking for a format to display your unique thoughts, then the professionally designed Vendor Performance Analysis And Administration Supplier Performance And Order Cycle Time Monitoring Dashboard Themes PDF is the one for you. You can use it as a Google Slides template or a PowerPoint template. Incorporate impressive visuals, symbols, images, and other charts. Modify or reorganize the text boxes as you desire. Experiment with shade schemes and font pairings. Alter, share or cooperate with other people on your work. Download Vendor Performance Analysis And Administration Supplier Performance And Order Cycle Time Monitoring Dashboard Themes PDF and find out how to give a successful presentation. Present a perfect display to your team and make your presentation unforgettable.

Key Statistics Associated With Footwear Industry Ppt Pictures Graphic Tips PDF
This slide highlights the thorough assessment of a market within the footwear industry. It will help in getting valuable insights and project the success that the company expects while introducing its brand and its products to consumers within the market. Present like a pro with Key Statistics Associated With Footwear Industry Ppt Pictures Graphic Tips PDF Create beautiful presentations together with your team, using our easy to use presentation slides. Share your ideas in real time and make changes on the fly by downloading our templates. So whether you are in the office, on the go, or in a remote location, you can stay in sync with your team and present your ideas with confidence. With Slidegeeks presentation got a whole lot easier. Grab these presentations today.

Analyze Online And Offline Marketing Campaigns Data Graphics PDF
This template covers dashboard to measure and analyze target marketing campaign performance. It also helps in tracking and reporting online and offline marketing campaigns through KPIs such as traffic sources, lead generation metrics, offline product sales, store visitations, customer acquisition, and offline retention and advocacy. If you are looking for a format to display your unique thoughts, then the professionally designed Analyze Online And Offline Marketing Campaigns Data Graphics PDF is the one for you. You can use it as a Google Slides template or a PowerPoint template. Incorporate impressive visuals, symbols, images, and other charts. Modify or reorganize the text boxes as you desire. Experiment with shade schemes and font pairings. Alter, share or cooperate with other people on your work. Download Analyze Online And Offline Marketing Campaigns Data Graphics PDF and find out how to give a successful presentation. Present a perfect display to your team and make your presentation unforgettable.

Experiential Shopping Outlet Overview Addressing In Store Purchase Drivers At Present Topics PDF
This slide provides information regarding in store purchase drivers such as live product demonstration, exclusive discounts and reasons why millennials visit stores such as availability of buying online and pick up at store. If you are looking for a format to display your unique thoughts, then the professionally designed Experiential Shopping Outlet Overview Addressing In Store Purchase Drivers At Present Topics PDF is the one for you. You can use it as a Google Slides template or a PowerPoint template. Incorporate impressive visuals, symbols, images, and other charts. Modify or reorganize the text boxes as you desire. Experiment with shade schemes and font pairings. Alter, share or cooperate with other people on your work. Download Experiential Shopping Outlet Overview Addressing In Store Purchase Drivers At Present Topics PDF and find out how to give a successful presentation. Present a perfect display to your team and make your presentation unforgettable.

Cobots Global Statistics Dashboard To Track Cobot Performance Mockup PDF
This slide represents the cobots performance dashboard by covering details of battery level, performance, total hours, average time, time to return, energy consumption, and so on. If you are looking for a format to display your unique thoughts, then the professionally designed Cobots Global Statistics Dashboard To Track Cobot Performance Mockup PDF is the one for you. You can use it as a Google Slides template or a PowerPoint template. Incorporate impressive visuals, symbols, images, and other charts. Modify or reorganize the text boxes as you desire. Experiment with shade schemes and font pairings. Alter, share or cooperate with other people on your work. Download Cobots Global Statistics Dashboard To Track Cobot Performance Mockup PDF and find out how to give a successful presentation. Present a perfect display to your team and make your presentation unforgettable.

Ml And Big Data In Information Technology Processes Aiops Dashboard To Monitor IT Operations Sample PDF
The following slide highlights the various key performance indicators of the AIOp, these can be problem quick review, cloud and infrastructure and applications health If you are looking for a format to display your unique thoughts, then the professionally designed Ml And Big Data In Information Technology Processes Aiops Dashboard To Monitor IT Operations Sample PDF is the one for you. You can use it as a Google Slides template or a PowerPoint template. Incorporate impressive visuals, symbols, images, and other charts. Modify or reorganize the text boxes as you desire. Experiment with shade schemes and font pairings. Alter, share or cooperate with other people on your work. Download Ml And Big Data In Information Technology Processes Aiops Dashboard To Monitor IT Operations Sample PDF and find out how to give a successful presentation. Present a perfect display to your team and make your presentation unforgettable.

Key Factors Affecting SEO Ranking On Search Engine Ppt Infographics Diagrams PDF
This slide represents major factors that impact SEO ranking and site visibility over search engine. It covers user friendly website, page speed, content quality, search intent etc. If you are looking for a format to display your unique thoughts, then the professionally designed Key Factors Affecting SEO Ranking On Search Engine Ppt Infographics Diagrams PDF is the one for you. You can use it as a Google Slides template or a PowerPoint template. Incorporate impressive visuals, symbols, images, and other charts. Modify or reorganize the text boxes as you desire. Experiment with shade schemes and font pairings. Alter, share or cooperate with other people on your work. Download Key Factors Affecting SEO Ranking On Search Engine Ppt Infographics Diagrams PDF and find out how to give a successful presentation. Present a perfect display to your team and make your presentation unforgettable.
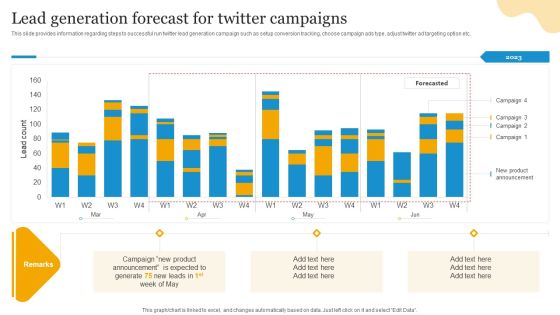
Social Media Advertising Through Twitter Lead Generation Forecast For Twitter Campaigns Slides PDF
This slide provides information regarding steps to successful run twitter lead generation campaign such as setup conversion tracking, choose campaign ads type, adjust twitter ad targeting option etc. Find highly impressive Social Media Advertising Through Twitter Lead Generation Forecast For Twitter Campaigns Slides PDF on Slidegeeks to deliver a meaningful presentation. You can save an ample amount of time using these presentation templates. No need to worry to prepare everything from scratch because Slidegeeks experts have already done a huge research and work for you. You need to download Social Media Advertising Through Twitter Lead Generation Forecast For Twitter Campaigns Slides PDF for your upcoming presentation. All the presentation templates are 100 percent editable and you can change the color and personalize the content accordingly. Download now.
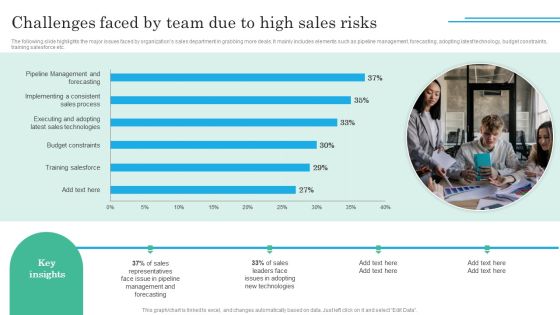
Implementing Sales Volatility Management Techniques Challenges Faced By Team Due To High Sales Risks Guidelines PDF
If you are looking for a format to display your unique thoughts, then the professionally designed Implementing Sales Volatility Management Techniques Challenges Faced By Team Due To High Sales Risks Guidelines PDF is the one for you. You can use it as a Google Slides template or a PowerPoint template. Incorporate impressive visuals, symbols, images, and other charts. Modify or reorganize the text boxes as you desire. Experiment with shade schemes and font pairings. Alter, share or cooperate with other people on your work. Download Implementing Sales Volatility Management Techniques Challenges Faced By Team Due To High Sales Risks Guidelines PDF and find out how to give a successful presentation. Present a perfect display to your team and make your presentation unforgettable.

Implementing Brand Extension Initiatives For Apple Company Analyzing Major Performance Indicators Post Extension Topics PDF
This slide showcases analyzing major performance indicators which can help branding managers to assess extension strategy KPIs. It provides details about market share, product line, launch, variants, color, size, net promotor score NPS, etc. If you are looking for a format to display your unique thoughts, then the professionally designed Implementing Brand Extension Initiatives For Apple Company Analyzing Major Performance Indicators Post Extension Topics PDF is the one for you. You can use it as a Google Slides template or a PowerPoint template. Incorporate impressive visuals, symbols, images, and other charts. Modify or reorganize the text boxes as you desire. Experiment with shade schemes and font pairings. Alter, share or cooperate with other people on your work. Download Implementing Brand Extension Initiatives For Apple Company Analyzing Major Performance Indicators Post Extension Topics PDF and find out how to give a successful presentation. Present a perfect display to your team and make your presentation unforgettable.

Per Device Pricing Strategy For Managed Solutions Global Managed Service Market By Vertical Topics PDF
The following slide displays segmentation of manages services market by verticals , these verticals can be government, retail, healthcare and science, media and entertainment etc. If you are looking for a format to display your unique thoughts, then the professionally designed Per Device Pricing Strategy For Managed Solutions Global Managed Service Market By Vertical Topics PDF is the one for you. You can use it as a Google Slides template or a PowerPoint template. Incorporate impressive visuals, symbols, images, and other charts. Modify or reorganize the text boxes as you desire. Experiment with shade schemes and font pairings. Alter, share or cooperate with other people on your work. Download Per Device Pricing Strategy For Managed Solutions Global Managed Service Market By Vertical Topics PDF and find out how to give a successful presentation. Present a perfect display to your team and make your presentation unforgettable.

Dashboard To Analyze Flexible Working Strategies Impact On Employees Performance Infographics PDF
The following slide delineates a key performance indicator KPI dashboard through which managers can evaluate the success of a flexible working policy on workforce performance. The major KPIs are absenteeism rate, overall labor effectiveness etc. Presenting this PowerPoint presentation, titled Dashboard To Analyze Flexible Working Strategies Impact On Employees Performance Infographics PDF, with topics curated by our researchers after extensive research. This editable presentation is available for immediate download and provides attractive features when used. Download now and captivate your audience. Presenting this Dashboard To Analyze Flexible Working Strategies Impact On Employees Performance Infographics PDF. Our researchers have carefully researched and created these slides with all aspects taken into consideration. This is a completely customizable Dashboard To Analyze Flexible Working Strategies Impact On Employees Performance Infographics PDF that is available for immediate downloading. Download now and make an impact on your audience. Highlight the attractive features available with our PPTs.

B2B Buyers Being Skeptical Prior Making Buying Decisions Information PDF
This slide provides information regarding characteristic of B2B buyer as being skeptical before making buying decision and seek validation for the same. If you are looking for a format to display your unique thoughts, then the professionally designed B2B Buyers Being Skeptical Prior Making Buying Decisions Information PDF is the one for you. You can use it as a Google Slides template or a PowerPoint template. Incorporate impressive visuals, symbols, images, and other charts. Modify or reorganize the text boxes as you desire. Experiment with shade schemes and font pairings. Alter, share or cooperate with other people on your work. Download B2B Buyers Being Skeptical Prior Making Buying Decisions Information PDF and find out how to give a successful presentation. Present a perfect display to your team and make your presentation unforgettable.

Key Products Offered To Customers In Retail Store Optimizing Customer Purchase Experience By Executing Portrait PDF
This slide represents product segmentation for retail store. It covers products such as grocery and food items, dairy products, household cleaning, skin care products etc. If you are looking for a format to display your unique thoughts, then the professionally designed Key Products Offered To Customers In Retail Store Optimizing Customer Purchase Experience By Executing Portrait PDF is the one for you. You can use it as a Google Slides template or a PowerPoint template. Incorporate impressive visuals, symbols, images, and other charts. Modify or reorganize the text boxes as you desire. Experiment with shade schemes and font pairings. Alter, share or cooperate with other people on your work. Download Key Products Offered To Customers In Retail Store Optimizing Customer Purchase Experience By Executing Portrait PDF and find out how to give a successful presentation. Present a perfect display to your team and make your presentation unforgettable.

Determining The Most Important Leadership Skill To Succeed In Digital Workspace Topics PDF
Purpose of this slide is to addresses information statistics about the skills that a leader should have in order to successfully navigate digital transformation. Skills covered are transformative vision, forward thinking, change oriented etc. This Determining The Most Important Leadership Skill To Succeed In Digital Workspace Topics PDF is perfect for any presentation, be it in front of clients or colleagues. It is a versatile and stylish solution for organizing your meetings. The product features a modern design for your presentation meetings. The adjustable and customizable slides provide unlimited possibilities for acing up your presentation. Slidegeeks has done all the homework before launching the product for you. So, do not wait, grab the presentation templates today

Increasing Consumer Engagement With Database Dashboard To Evaluate Targeted Social Media Portrait PDF
The purpose of this slide is to outline a comprehensive dashboard through which marketers can analyze effectiveness of targeted social media campaign performance. The key performance indicators KPIs are social media followers, LinkedIn key metrics, page likes, page impressions, etc. If you are looking for a format to display your unique thoughts, then the professionally designed Increasing Consumer Engagement With Database Dashboard To Evaluate Targeted Social Media Portrait PDF is the one for you. You can use it as a Google Slides template or a PowerPoint template. Incorporate impressive visuals, symbols, images, and other charts. Modify or reorganize the text boxes as you desire. Experiment with shade schemes and font pairings. Alter, share or cooperate with other people on your work. Download Increasing Consumer Engagement With Database Dashboard To Evaluate Targeted Social Media Portrait PDF and find out how to give a successful presentation. Present a perfect display to your team and make your presentation unforgettable.

Competitive Landscaping For Managed Services Market Pictures PDF
The following slide provides a detailed analysis of the market share of our company in comparison to the competition. If you are looking for a format to display your unique thoughts, then the professionally designed Competitive Landscaping For Managed Services Market Pictures PDF is the one for you. You can use it as a Google Slides template or a PowerPoint template. Incorporate impressive visuals, symbols, images, and other charts. Modify or reorganize the text boxes as you desire. Experiment with shade schemes and font pairings. Alter, share or cooperate with other people on your work. Download Competitive Landscaping For Managed Services Market Pictures PDF and find out how to give a successful presentation. Present a perfect display to your team and make your presentation unforgettable.

Go Viral Campaign Strategies To Increase Engagement Impact Of Word Of Mouth Marketing Consumer Information PDF
This slide showcases impact analysis which can guide marketers to assess WOM marketing impact on customer purchase. It provides details about brand awareness, conversion, community interaction, professional, website review, acquaintance, etc. If you are looking for a format to display your unique thoughts, then the professionally designed Go Viral Campaign Strategies To Increase Engagement Impact Of Word Of Mouth Marketing Consumer Information PDF is the one for you. You can use it as a Google Slides template or a PowerPoint template. Incorporate impressive visuals, symbols, images, and other charts. Modify or reorganize the text boxes as you desire. Experiment with shade schemes and font pairings. Alter, share or cooperate with other people on your work. Download Go Viral Campaign Strategies To Increase Engagement Impact Of Word Of Mouth Marketing Consumer Information PDF and find out how to give a successful presentation. Present a perfect display to your team and make your presentation unforgettable.
 Home
Home